Download to read offline
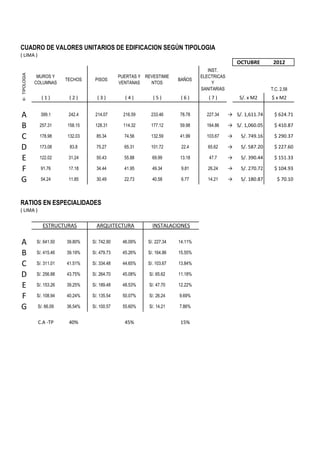

This document contains two tables. The first table lists unit costs in Soles and dollars for various construction elements (walls, floors, etc.) according to building typology from A to G. It also provides the total unit cost per square meter for each typology. The second table shows the cost ratios for specialties (structures, architecture, installations) for each typology, with typology A having the highest costs and typology G the lowest. On average, structures make up 40% of costs, architecture 45%, and installations 15%.


