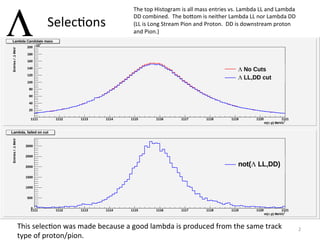
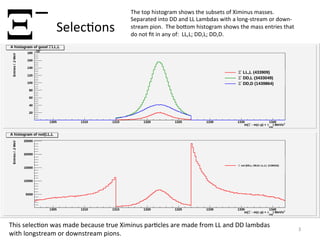
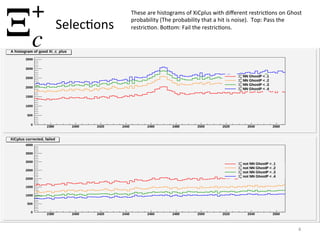
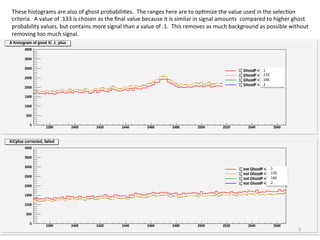
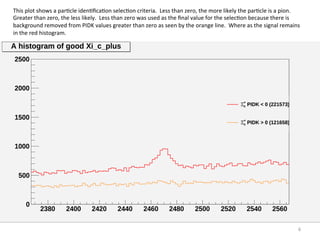
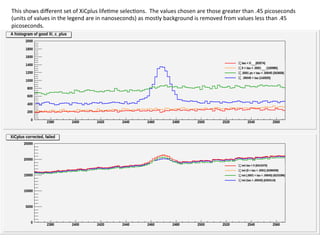
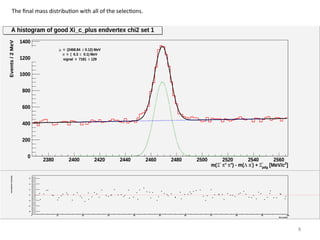
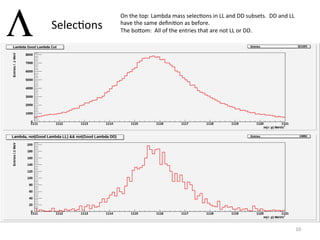
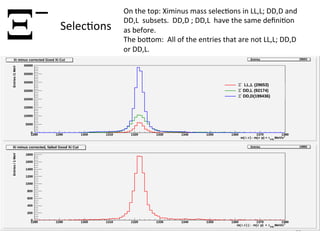
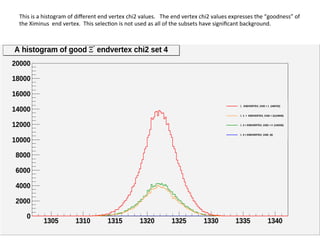
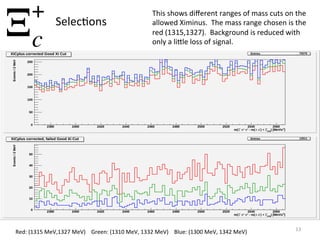
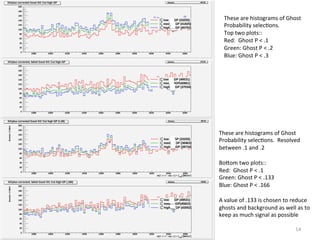
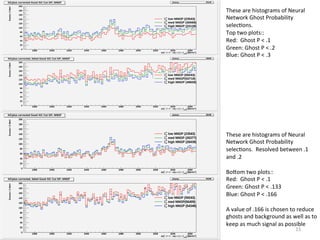
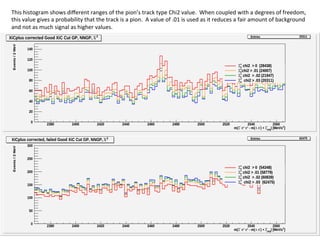
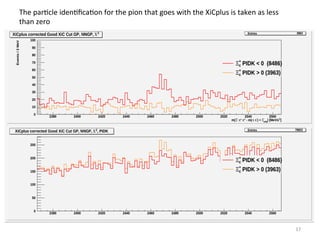
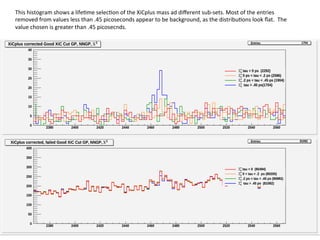
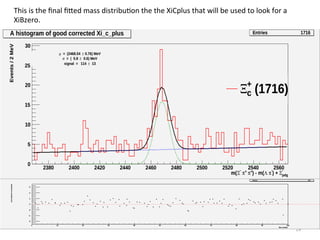
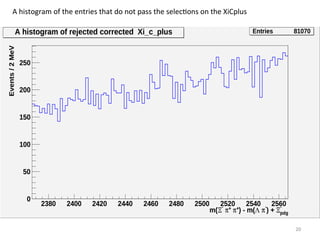
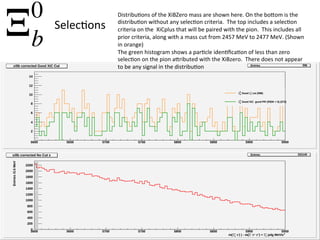
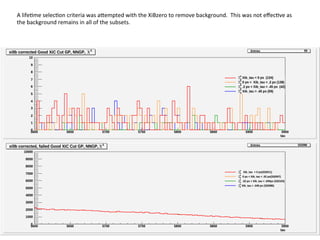
Ξc
+
→ Ξ−
ππ
Ξ−
→ Λπ−
Λ → pπ−
1	
  
Mass	
  measurement	
  study	
  by:	
  	
  Evan	
  Cornuelle	
  
2	
  
Λ Selec8ons	
  
The	
  top	
  Histogram	
  is	
  all	
  mass	
  entries	
  vs.	
  Lambda	
  LL	
  and	
  Lambda	
  
DD	
  combined.	
  	
  The	
  boBom	
  is	
  neither	
  Lambda	
  LL	
  nor	
  Lambda	
  DD	


(LL	
  is	
  Long	
  Stream	
  Pion	
  and	
  Proton.	
  	
  DD	
  is	
  downstream	
  proton	
  
and	
  Pion.)	
  
This	
  selec8on	
  was	
  made	
  because	
  a	
  good	
  lambda	
  is	
  produced	
  from	
  the	
  same	
  track	
  
type	
  of	
  proton/pion.	
  	
  
3	
  
Ξ− Selec8ons	
  
The	
  top	
  histogram	
  shows	
  the	
  subsets	
  of	
  Ximinus	
  masses.	
  	
  
Separated	
  into	
  DD	
  and	
  LL	
  Lambdas	
  with	
  a	
  long-­‐stream	
  or	
  down-­‐
stream	
  pion.	
  	
  The	
  boBom	
  histogram	
  shows	
  the	
  mass	
  entries	
  that	
  
do	
  not	
  fit	
  in	
  any	
  of:	
  	
  LL,L;	
  DD,L;	
  DD,D.	


This	
  selec8on	
  was	
  made	
  because	
  true	
  Ximinus	
  par8cles	
  are	
  made	
  from	
  LL	
  and	
  DD	
  lambdas	
  
with	
  longstream	
  or	
  downstream	
  pions.	


4	
  
Selec8ons	
  
Ξ+
c
These	
  are	
  histograms	
  of	
  XiCplus	
  with	
  different	
  restric8ons	
  on	
  Ghost	
  
probability	
  (The	
  probability	
  that	
  a	
  hit	
  is	
  noise).	
  	
  Top:	
  Pass	
  the	
  
restric8on.	
  BoBom:	
  Fail	
  the	
  restric8ons.	
  
5	
  
.1	
  
.133	
  
.166	
  
.2	
  
.1	
  
.133	
  
.166	
  
.2	
  
These	
  histograms	
  are	
  also	
  of	
  ghost	
  probabili8es.	
  	
  The	
  ranges	
  here	
  are	
  to	
  op8mize	
  the	
  value	
  used	
  in	
  the	
  selec8on	
  
criteria.	
  	
  A	
  value	
  of	
  .133	
  is	
  chosen	
  as	
  the	
  final	
  value	
  because	
  it	
  is	
  similar	
  in	
  signal	
  amounts	
  	
  compared	
  to	
  higher	
  ghost	
  
probability	
  values,	
  but	
  contains	
  more	
  signal	
  than	
  a	
  value	
  of	
  .1.	
  	
  This	
  removes	
  as	
  much	
  background	
  as	
  possible	
  without	
  
removing	
  too	
  much	
  signal.	
  	
  
6	
  
This	
  plot	
  shows	
  a	
  par8cle	
  iden8fica8on	
  selec8on	
  criteria.	
  	
  Less	
  than	
  zero,	
  the	
  more	
  likely	
  the	
  par8cle	
  is	
  a	
  pion.	
  	
  
Greater	
  than	
  zero,	
  the	
  less	
  likely.	
  	
  Less	
  than	
  zero	
  was	
  used	
  as	
  the	
  final	
  value	
  for	
  the	
  selec8on	
  because	
  there	
  is	
  
background	
  removed	
  from	
  PIDK	
  values	
  greater	
  than	
  zero	
  as	
  seen	
  by	
  the	
  orange	
  line.	
  	
  Where	
  as	
  the	
  signal	
  remains	
  
in	
  the	
  red	
  histogram.	
  
7	
  
This	
  shows	
  different	
  set	
  of	
  XiCplus	
  life8me	
  selec8ons.	
  	
  The	
  values	
  chosen	
  are	
  those	
  greater	
  than	
  .45	
  picoseconds	
  
(units	
  of	
  values	
  in	
  the	
  legend	
  are	
  in	
  nanoseconds)	
  as	
  mostly	
  background	
  is	
  removed	
  from	
  values	
  less	
  than	
  .45	
  
picoseconds.	


8	
  
The	
  final	
  mass	
  distribu8on	
  with	
  all	
  of	
  the	
  selec8ons.	


9	
  
Ξ0
b
→ Ξc
+
π −
Ξc
+
→ Ξ−
ππ
Ξ−
→ Λπ −
Λ → pπ
10	
  
Λ Selec8ons	
  
On	
  the	
  top:	
  Lambda	
  mass	
  selec8ons	
  in	
  LL	
  and	
  DD	
  subsets.	
  	
  DD	
  and	
  LL	
  
have	
  the	
  same	
  defini8on	
  as	
  before.	


The	
  boBom:	
  	
  All	
  of	
  the	
  entries	
  that	
  are	
  not	
  LL	
  or	
  DD.	
  
11	
  
Ξ− Selec8ons	
  
On	
  the	
  top:	
  Ximinus	
  mass	
  selec8ons	
  in	
  LL,L;	
  DD,D	
  and	
  
DD,L	
  	
  subsets.	
  	
  DD,D	
  ;	
  DD,L	
  	
  have	
  the	
  same	
  defini8on	
  
as	
  before.	


The	
  boBom:	
  	
  All	
  of	
  the	
  entries	
  that	
  are	
  not	
  LL,L;	
  DD,D	
  
or	
  DD,L.	
  
12	
  
This	
  is	
  a	
  histogram	
  of	
  different	
  end	
  vertex	
  chi2	
  values.	
  	
  	
  The	
  end	
  vertex	
  chi2	
  values	
  expresses	
  the	
  “goodness”	
  of	
  
the	
  Ximinus	
  	
  end	
  vertex.	
  	
  This	
  selec8on	
  is	
  not	
  used	
  as	
  all	
  of	
  the	
  subsets	
  have	
  significant	
  background.	
  
13	
  
Ξ+
c
Selec8ons	
  
This	
  shows	
  different	
  ranges	
  of	
  mass	
  cuts	
  on	
  the	
  
allowed	
  Ximinus.	
  	
  The	
  mass	
  range	
  chosen	
  is	
  the	
  
red	
  (1315,1327).	
  	
  Background	
  is	
  reduced	
  with	
  
only	
  a	
  liBle	
  loss	
  of	
  signal.	


Red:	
  (1315	
  MeV,1327	
  MeV)	


  Green:	
  (1310	
  MeV,	
  1332	
  MeV)	


  Blue:	
  (1300	
  MeV,	
  1342	
  MeV)	
  
14	
  
These	
  are	
  histograms	
  of	
  Ghost	
  
Probability	
  selec8ons.	


Top	
  two	
  plots::	
  
Red:	
  	
  Ghost	
  P	
  <	
  .1	
  
Green:	
  Ghost	
  P	
  <	
  .2	
  
Blue:	
  Ghost	
  P	
  <	
  .3	


These	
  are	
  histograms	
  of	
  Ghost	
  
Probability	
  selec8ons.	
  	
  Resolved	
  
between	
  .1	
  and	
  .2	


BoBom	
  two	
  plots::	
  
Red:	
  	
  Ghost	
  P	
  <	
  .1	
  
Green:	
  Ghost	
  P	
  <	
  .133	
  
Blue:	
  Ghost	
  P	
  <	
  .166	


A	
  value	
  of	
  .133	
  is	
  chosen	
  to	
  reduce	
  
ghosts	
  and	
  background	
  as	
  well	
  as	
  to	
  
keep	
  as	
  much	
  signal	
  as	
  possible	


15	
  
These	
  are	
  histograms	
  of	
  Neural	
  
Network	
  Ghost	
  Probability	
  
selec8ons.	
  	
  Resolved	
  between	
  .1	
  
and	
  .2	


BoBom	
  two	
  plots::	
  
Red:	
  	
  Ghost	
  P	
  <	
  .1	
  
Green:	
  Ghost	
  P	
  <	
  .133	
  
Blue:	
  Ghost	
  P	
  <	
  .166	


A	
  value	
  of	
  .166	
  is	
  chosen	
  to	
  reduce	
  
ghosts	
  and	
  background	
  as	
  well	
  as	
  to	
  
keep	
  as	
  much	
  signal	
  as	
  possible	
  
These	
  are	
  histograms	
  of	
  Neural	
  
Network	
  Ghost	
  Probability	
  
selec8ons.	


Top	
  two	
  plots::	
  
Red:	
  	
  Ghost	
  P	
  <	
  .1	
  
Green:	
  Ghost	
  P	
  <	
  .2	
  
Blue:	
  Ghost	
  P	
  <	
  .3	
  
16	
  
This	
  histogram	
  shows	
  different	
  ranges	
  of	
  the	
  pion’s	
  track	
  type	
  Chi2	
  value.	
  	
  When	
  coupled	
  with	
  a	
  degrees	
  of	
  freedom,	
  
this	
  value	
  gives	
  a	
  probability	
  that	
  the	
  track	
  is	
  a	
  pion.	
  	
  A	
  value	
  of	
  .01	
  is	
  used	
  as	
  it	
  reduces	
  a	
  fair	
  amount	
  of	
  background	
  
and	
  not	
  as	
  much	
  signal	
  as	
  higher	
  values.	
  
17	
  
The	
  par8cle	
  iden8fica8on	
  for	
  the	
  pion	
  that	
  goes	
  with	
  the	
  XiCplus	
  is	
  taken	
  as	
  less	
  
than	
  zero	
  
18	
  
This	
  histogram	
  shows	
  a	
  life8me	
  selec8on	
  of	
  the	
  XiCplus	
  mass	
  ad	
  different	
  sub-­‐sets.	
  Most	
  of	
  the	
  entries	
  
removed	
  from	
  values	
  less	
  than	
  .45	
  picoseconds	
  appear	
  to	
  be	
  background,	
  as	
  the	
  distribu8ons	
  look	
  flat.	
  	
  The	
  
value	
  chosen	
  is	
  greater	
  than	
  .45	
  picosecnds.	
  
19	
  
This	
  is	
  the	
  final	
  fiBed	
  mass	
  distribu8on	
  the	
  the	
  XiCplus	
  that	
  will	
  be	
  used	
  to	
  look	
  for	
  a	
  
XiBzero.	


20	
  
A	
  histogram	
  of	
  the	
  entries	
  that	
  do	
  not	
  pass	
  the	
  selec8ons	
  on	
  the	
  XiCplus	
  
21	
  
Ξ0
b
Selec8ons	
  
Distribu8ons	
  of	
  the	
  XiBZero	
  mass	
  are	
  shown	
  here.	
  On	
  the	
  boBom	
  is	
  the	
  
distribu8on	
  without	
  any	
  selec8on	
  criteria.	
  	
  The	
  top	
  includes	
  a	
  selec8on	
  
criteria	
  on	
  the	
  	
  XiCplus	
  that	
  will	
  be	
  paired	
  with	
  the	
  pion.	
  	
  This	
  includes	
  all	
  
prior	
  criteria,	
  along	
  with	
  a	
  mass	
  cut	
  from	
  2457	
  MeV	
  to	
  2477	
  MeV.	
  (Shown	
  
in	
  orange)	
  
The	
  green	
  histogram	
  shows	
  a	
  par8cle	
  iden8fica8on	
  of	
  less	
  than	
  zero	
  
selec8on	
  on	
  the	
  pion	
  aBributed	
  with	
  the	
  XiBzero.	
  	
  There	
  does	
  not	
  appear	
  
to	
  be	
  any	
  signal	
  in	
  the	
  distribu8on	
  	
  
22	
  
A	
  life8me	
  selec8on	
  criteria	
  was	
  aBempted	
  with	
  the	
  XiBzero	
  to	
  remove	
  background.	
  	
  This	
  was	
  not	
  effec8ve	
  as	
  
the	
  background	
  remains	
  in	
  all	
  of	
  the	
  subsets.	
  	
  
Conclusion	
  
A	
  mass	
  measurement	
  is	
  found	
  for	
  the	
  
with	
  promising	
  errors.	
  	
  The	


  would	
  
something	
  to	
  look	
  into	
  further.	


There	
  is	
  not	
  a	
  result	
  found	
  for	
  the	


  Mass	


23	
  
Ξ+
c
Ξ+
c
Ξ0
b

CornuelleFinal

  • 1.
    Ξc + → Ξ− ππ Ξ− → Λπ− Λ→ pπ− 1   Mass  measurement  study  by:    Evan  Cornuelle  
  • 2.
    2   Λ Selec8ons   The  top  Histogram  is  all  mass  entries  vs.  Lambda  LL  and  Lambda   DD  combined.    The  boBom  is  neither  Lambda  LL  nor  Lambda  DD         (LL  is  Long  Stream  Pion  and  Proton.    DD  is  downstream  proton   and  Pion.)   This  selec8on  was  made  because  a  good  lambda  is  produced  from  the  same  track   type  of  proton/pion.    
  • 3.
    3   Ξ− Selec8ons   The  top  histogram  shows  the  subsets  of  Ximinus  masses.     Separated  into  DD  and  LL  Lambdas  with  a  long-­‐stream  or  down-­‐ stream  pion.    The  boBom  histogram  shows  the  mass  entries  that   do  not  fit  in  any  of:    LL,L;  DD,L;  DD,D.       This  selec8on  was  made  because  true  Ximinus  par8cles  are  made  from  LL  and  DD  lambdas   with  longstream  or  downstream  pions.      
  • 4.
    4   Selec8ons   Ξ+ c These  are  histograms  of  XiCplus  with  different  restric8ons  on  Ghost   probability  (The  probability  that  a  hit  is  noise).    Top:  Pass  the   restric8on.  BoBom:  Fail  the  restric8ons.  
  • 5.
    5   .1   .133   .166   .2   .1   .133   .166   .2   These  histograms  are  also  of  ghost  probabili8es.    The  ranges  here  are  to  op8mize  the  value  used  in  the  selec8on   criteria.    A  value  of  .133  is  chosen  as  the  final  value  because  it  is  similar  in  signal  amounts    compared  to  higher  ghost   probability  values,  but  contains  more  signal  than  a  value  of  .1.    This  removes  as  much  background  as  possible  without   removing  too  much  signal.    
  • 6.
    6   This  plot  shows  a  par8cle  iden8fica8on  selec8on  criteria.    Less  than  zero,  the  more  likely  the  par8cle  is  a  pion.     Greater  than  zero,  the  less  likely.    Less  than  zero  was  used  as  the  final  value  for  the  selec8on  because  there  is   background  removed  from  PIDK  values  greater  than  zero  as  seen  by  the  orange  line.    Where  as  the  signal  remains   in  the  red  histogram.  
  • 7.
    7   This  shows  different  set  of  XiCplus  life8me  selec8ons.    The  values  chosen  are  those  greater  than  .45  picoseconds   (units  of  values  in  the  legend  are  in  nanoseconds)  as  mostly  background  is  removed  from  values  less  than  .45   picoseconds.      
  • 8.
    8   The  final  mass  distribu8on  with  all  of  the  selec8ons.      
  • 9.
    9   Ξ0 b → Ξc + π− Ξc + → Ξ− ππ Ξ− → Λπ − Λ → pπ
  • 10.
    10   Λ Selec8ons   On  the  top:  Lambda  mass  selec8ons  in  LL  and  DD  subsets.    DD  and  LL   have  the  same  defini8on  as  before.       The  boBom:    All  of  the  entries  that  are  not  LL  or  DD.  
  • 11.
    11   Ξ− Selec8ons   On  the  top:  Ximinus  mass  selec8ons  in  LL,L;  DD,D  and   DD,L    subsets.    DD,D  ;  DD,L    have  the  same  defini8on   as  before.       The  boBom:    All  of  the  entries  that  are  not  LL,L;  DD,D   or  DD,L.  
  • 12.
    12   This  is  a  histogram  of  different  end  vertex  chi2  values.      The  end  vertex  chi2  values  expresses  the  “goodness”  of   the  Ximinus    end  vertex.    This  selec8on  is  not  used  as  all  of  the  subsets  have  significant  background.  
  • 13.
    13   Ξ+ c Selec8ons   This  shows  different  ranges  of  mass  cuts  on  the   allowed  Ximinus.    The  mass  range  chosen  is  the   red  (1315,1327).    Background  is  reduced  with   only  a  liBle  loss  of  signal.       Red:  (1315  MeV,1327  MeV)        Green:  (1310  MeV,  1332  MeV)        Blue:  (1300  MeV,  1342  MeV)  
  • 14.
    14   These  are  histograms  of  Ghost   Probability  selec8ons.       Top  two  plots::   Red:    Ghost  P  <  .1   Green:  Ghost  P  <  .2   Blue:  Ghost  P  <  .3       These  are  histograms  of  Ghost   Probability  selec8ons.    Resolved   between  .1  and  .2     BoBom  two  plots::   Red:    Ghost  P  <  .1   Green:  Ghost  P  <  .133   Blue:  Ghost  P  <  .166     A  value  of  .133  is  chosen  to  reduce   ghosts  and  background  as  well  as  to   keep  as  much  signal  as  possible    
  • 15.
    15   These  are  histograms  of  Neural   Network  Ghost  Probability   selec8ons.    Resolved  between  .1   and  .2     BoBom  two  plots::   Red:    Ghost  P  <  .1   Green:  Ghost  P  <  .133   Blue:  Ghost  P  <  .166     A  value  of  .166  is  chosen  to  reduce   ghosts  and  background  as  well  as  to   keep  as  much  signal  as  possible   These  are  histograms  of  Neural   Network  Ghost  Probability   selec8ons.       Top  two  plots::   Red:    Ghost  P  <  .1   Green:  Ghost  P  <  .2   Blue:  Ghost  P  <  .3  
  • 16.
    16   This  histogram  shows  different  ranges  of  the  pion’s  track  type  Chi2  value.    When  coupled  with  a  degrees  of  freedom,   this  value  gives  a  probability  that  the  track  is  a  pion.    A  value  of  .01  is  used  as  it  reduces  a  fair  amount  of  background   and  not  as  much  signal  as  higher  values.  
  • 17.
    17   The  par8cle  iden8fica8on  for  the  pion  that  goes  with  the  XiCplus  is  taken  as  less   than  zero  
  • 18.
    18   This  histogram  shows  a  life8me  selec8on  of  the  XiCplus  mass  ad  different  sub-­‐sets.  Most  of  the  entries   removed  from  values  less  than  .45  picoseconds  appear  to  be  background,  as  the  distribu8ons  look  flat.    The   value  chosen  is  greater  than  .45  picosecnds.  
  • 19.
    19   This  is  the  final  fiBed  mass  distribu8on  the  the  XiCplus  that  will  be  used  to  look  for  a   XiBzero.      
  • 20.
    20   A  histogram  of  the  entries  that  do  not  pass  the  selec8ons  on  the  XiCplus  
  • 21.
    21   Ξ0 b Selec8ons   Distribu8ons  of  the  XiBZero  mass  are  shown  here.  On  the  boBom  is  the   distribu8on  without  any  selec8on  criteria.    The  top  includes  a  selec8on   criteria  on  the    XiCplus  that  will  be  paired  with  the  pion.    This  includes  all   prior  criteria,  along  with  a  mass  cut  from  2457  MeV  to  2477  MeV.  (Shown   in  orange)   The  green  histogram  shows  a  par8cle  iden8fica8on  of  less  than  zero   selec8on  on  the  pion  aBributed  with  the  XiBzero.    There  does  not  appear   to  be  any  signal  in  the  distribu8on    
  • 22.
    22   A  life8me  selec8on  criteria  was  aBempted  with  the  XiBzero  to  remove  background.    This  was  not  effec8ve  as   the  background  remains  in  all  of  the  subsets.    
  • 23.
    Conclusion   A  mass  measurement  is  found  for  the   with  promising  errors.    The                would   something  to  look  into  further.     There  is  not  a  result  found  for  the                  Mass                         23   Ξ+ c Ξ+ c Ξ0 b