1. CONTOZO'S SURVEY REPORT
DEFINITIONS:
For the purpose of this report INDEPENDENT VARIABLES are defined as those attributes of the
product or service being evaluated (like QUALITY OF THE FOOD, FRIENDLYNESS OF THE SERVER,
etc), that affect the DEPENDENT VARIABLES or OUTCOMES (like OVERALL SATISFACTION, LIKELY TO
REFER A FRIEND, LIKELY TO VISIT AGAIN)
METHODS:
A sample of 484 respondents was analyzed. English and Spanish subsets of respondents were
merged and all averages calculated.
All three outcome variables (OVERALL SATISFACTION, LIKELY TO REFER A FRIEND, LIKELY TO VISIT
AGAIN) where analyzed to determine the best set of predictor factors for each of them. A regression
analysis was also performed for each dependent variable to define the weight of a hypothetical
change on each of the independent variables and its impact on outcomes.
In order to define possible patterns, responses with ratings of 1 and 2 in the dependent variables
were analyzed using regression.
GENERAL RESULTS (ALL RATINGS):
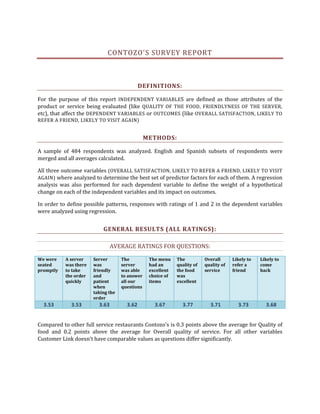
AVERAGE RATINGS FOR QUESTIONS:
We were A server Server The The menu The Overall Likely to Likely to
seated was there was server had an quality of quality of refer a come
promptly to take friendly was able excellent the food service friend back
the order and to answer choice of was
quickly patient all our items excellent
when questions
taking the
order
3.53 3.53 3.63 3.62 3.67 3.77 3.71 3.73 3.68
Compared to other full service restaurants Contozo's is 0.3 points above the average for Quality of
food and 0.2 points above the average for Overall quality of service. For all other variables
Customer Link doesn't have comparable values as questions differ significantly.
2. REGRESSION ANALYSIS
A Best Subset Regression approach was taken. Best subsets regression is an efficient way to identify
models that achieve your goals with as few predictors as possible. For example: How to achieve an
increase in the LIKELIHOOD TO REFER A FRIEND from 3.73 to 4? One way is to increase the ratings
in all independent variables; however, this is not only expensive but usually unnecessary. By
identifying the BEST SUBSET we can define the two or three variables that will have more weight in
achieving this goal.
BEST SUBSET REGRESSION FOR OVERALL QUALITY OF SERVICE
The best subset identified involves the following three variables:
Quality of the food 0.517
Variable Coefficient
Server was friendly and patient 0.242
Server was there to take the order quickly 0.104
The Coefficient is the amount in which the dependent's variable average rating will change if the
independent variable changes by 1 unit. Example: If the average rating of the QUALITY OF FOOD
increases from 3.77 to 4.77 and all other variables remain the same, the OVERALL SATISFACTION
will increase from 3.71 to 4.23 (a positive change of 0.517). Additionally if SERVER FRIENDLINESS
average increases from 3.63 to 4.63 and all other variables remain the same the OVERALL
SATISFACTION will go from 3.71 to 3.95. If all variables mentioned here increase by 1 the OVERALL
SATISFACTION rate will go up to 4.573 (result of adding 0.517+0.242+0.104 to the current average).
A similar increase in all other variables combined will have an effect of less than 0.2 in OVERALL
SATISFACTION . This is also applicable when the change is not positive but negative. This example
can be used to help interpret all other variables.
BEST SUBSET REGRESSION FOR LIKELY TO REFER A FRIEND
The best subset identified involves the following four variables:
Quality of the food 0.328
Variable Coefficient
Server was friendly and patient 0.168
We were seated promptly 0.144
Menu selection 0.158
3. BEST SUBSET REGRESSION FOR LIKELY TO VISIT AGAIN
The best subset identified involves the following three variables:
Quality of the food 0.327
Variable Coefficient
Server was friendly and patient 0.246
Menu selection 0.124
We were seated promptly 0.106
WEEKLY CLIENTS
Further analysis of the data demonstrated that those who visit Contozo's on a weekly basis
represent a population with slightly different expectations. This important population was
composed by 102 respondents (21%) of the sample, and averages a total of 2.87 visits a week.
According to this data this subgroup accounts for 81.26% of all projected visits to Contozo's in one
year.
AVERAGE RATINGS FOR QUESTIONS:
We were A server Server The The menu The Overall Likely to Likely to
seated was there was server had an quality of quality of refer a come
promptly to take friendly was able excellent the food service friend back
the order and to answer choice of was
quickly patient all our items excellent
when questions
taking the
order
3.68 3.82 3.75 3.73 3.85 3.95 3.94 3.93 3.89
This population shows a significantly higher satisfaction with Contozo's service and has different
priorities.
A regression analysis was performed for this population and the results follow:
BEST SUBSET REGRESSION FOR OVERALL QUALITY OF SERVICE (WEEKLY CLIENTS)
The best subset identified involves the following three variables:
Quality of the food 0.466
Variable Coefficient
Server was friendly and patient 0.422
Menu selection 0.296
4. Note that SERVER FRIENDLINESS and MENU SELECTION are significantly more important for this
subgroup as compared to the general sample. The coefficient for these two variables is significantly
higher than the one observed for the general population, meaning a change in any of them will have
a sizable impact on OVERALL SATISFACTION.
BEST SUBSET REGRESSION FOR LIKELY TO REFER A FRIEND (WEEKLY CLIENTS)
The best subset identified involves the following two variables:
Quality of the food 0.303
Variable Coefficient
Menu selection 0.190
Seated promptly 0.153
BEST SUBSET REGRESSION FOR LIKELY TO VISIT AGAIN (WEEKLY CLIENTS)
The best subset identified involves the following two variables:
Menu selection 0.306
Variable Coefficient
Quality of the food 0.332
Server was friendly and patient 0.137
USING THIS INFORMATION
Customer retention is a priority issue to address for any business. Based on the results of this
analysis, this fact is particularly true for Contozo's.
Now that the main variables that drive up or down customer satisfaction have been identified the
next step is usually to define which variables are easier and less expensive to improve.
A recent study done at 384 locations of an important fast food chain in Canada using the same
devises used for Contozo's asked clients WHETHER THEIR SERVER SMILED OR NOT. It was shown
this variable had a strong influence on OVERALL CUSTOMER SATISFACTION and the ratings where
significantly low during the night shift. The client was suggested to reinforce the importance of
courtesy by sharing the results with all personnel in contact with customers.
Contozo's is presented with a similar situation, where SERVER WAS FRIENDLY AND PATIENT has a
coefficient of 0.422 in OVERALL SATISFACTION for frequent customers. An improvement in this
variable will probably have a strong and positive influence on OVERALL CUSTOMER SATISFACTION
and might entail a lower investment than modifying the quality of the food or adding new items to
the menu, the other factors found to have a significant influence. That might be a first step towards
quality improvement.
For other variables the decision might not be as easy and, although providing a method to calculate
return on investment is beyond the scope of this report, the information contained herein can be
useful to avoid pitfall projects.
5. A common approach to do this starts by translating a 1 to 5 scale to percentages and then
calculating the projected change in a given variable by using the coefficient. The formula used to
make the conversion to percentage is (variable average rating – 1) x 25.
Example of scale conversion: Current average agreement with the statement LIKELY TO COME BACK
of 3.89 is equivalent to (3.89-1) x 25= 72.25%
LOW RATINGS ANALYSIS
In order to define possible patterns, responses with ratings of 1 and 2 in the dependent variables
were analyzed using regression.
The results where as follow:
Likely to visit again
Variable Number of responses with 1 and 2
Overall satisfaction
121
Likely to refer someone
106
111
AVERAGE RATINGS FROM LOW RESPONDENTS FOR OVERALL SATISFACTION
We were A server Server The The menu The Overall Likely to Likely to
seated was there was server had an quality of quality of refer a come
promptly to take friendly was able excellent the food service friend back
the order and to answer choice of was
quickly patient all our items excellent
when questions
taking the
order
2.48 2.29 2.12 2.14 2.2 2.01 1.28 2.23 2.24
AVERAGE RATINGS FROM LOW RESPONDENTS FOR LIKELY TO REFER SOMEBODY
We were A server Server The The menu The Overall Likely to Likely to
seated was there was server had an quality of quality of refer a come
promptly to take friendly was able excellent the food service friend back
the order and to answer choice of was
quickly patient all our items excellent
when questions
taking the
order
2.43 2.44 2.36 2.33 2.25 2.42 2.23 1.34 2.16
6. AVERAGE RATINGS FROM LOW RESPONDENTS FOR LIKELY TO VISIT AGAIN
We were A server Server The The menu The Overall Likely to Likely to
seated was there was server had an quality of quality of refer a come
promptly to take friendly was able excellent the food service friend back
the order and to answer choice of was
quickly patient all our items excellent
when questions
taking the
order
2.51 2.5 2.37 2.45 2.5 2.43 2.45 2.34 1.28
Two procedures were used to define a possible pattern in the data and probably single out
variables resulting in such an outcome: a) Stepwise regression and b) Best subsets regression.
Coefficients are not provided in the results below as not all values in the scale were used.
REGRESSION RESULTS FOR LOW RESPONDENTS FOR OVERALL SATISFACTION
The results show preponderance of inconformity with (in order of importance):
1. Quality of the food
2. Variety of the menu
3. A server was there to take the order quickly
REGRESSION RESULTS FOR LOW RESPONDENTS FOR LIKELY TO REFER SOMEBODY
The results show preponderance of inconformity with (in order of importance):
1. Quality of the food
2. Variety of the menu
REGRESSION RESULTS FOR LOW RESPONDENTS FOR LIKELY TO COME BACK
The results show preponderance of inconformity with (in order of importance):
1. Quality of the food
2. Variety of the menu
Even though it was possible to define the most common factors associated with low outcomes, it is
important to note that these customers tended to show very low ratings in most or all of the
variables, making it difficult to reliably define priority issues for this group.
The incorporation of variables like gender, income, nationality, etc, did not change the tendency
shown above.
7. SUGESTIONS
1) Since Quality of the food was present as an important factor throughout the current
analysis it is suggested to survey your customers to find potential problems, e.g.:
freshness, temperature, presentation, taste, consistency in quality, etc, and then
establish an improvement strategy based on specific problems.
2) Reinforce importance of courtesy by sharing these results with ALL personnel who
might get in direct contact with consumers, i.e. hosts, servers, cleaning personnel, etc.
3) Although emphasis should be placed on frequent customers’ needs, it is important to
remember new customers are the gateway group to increase Contozo's frequent
customer base.
4) Menu selection was also an important factor. It has been seen in previous studies that
having a wide range of choices is not as important as having consistent availability of
the choices offered. Having items on the menu that are not consistently available can
create unmet expectations. Input from servers regarding customer’s requests can add
invaluable information.