Download as PDF, PPTX


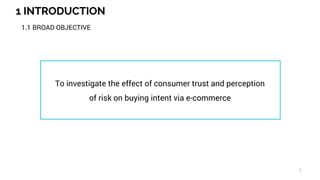
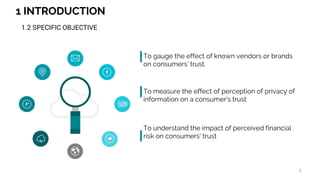

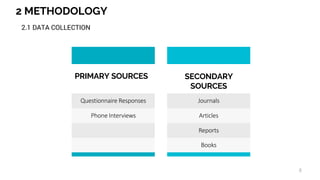
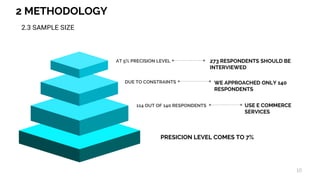
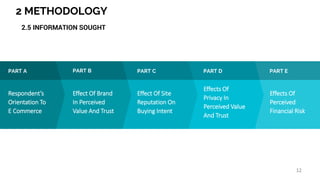


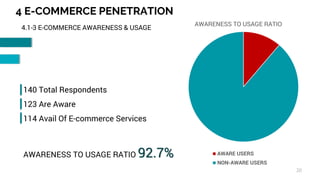
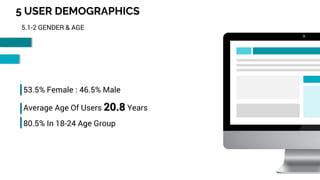


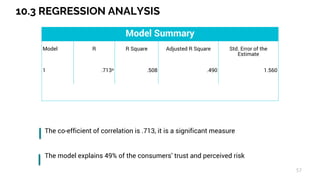
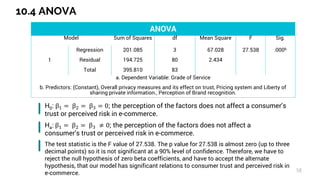

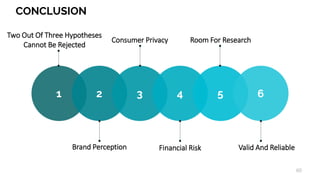


The document discusses a study investigating the effects of consumer trust and perceived risk on purchasing behavior in B2C e-commerce, highlighting the impact of brand recognition, privacy perception, and financial risk. Methodology included surveys and interviews with 114 respondents, revealing insights into consumer demographics and trust factors. Key findings indicated that brand perception positively influences buying intentions, while privacy concerns and financial security have varying impacts on consumer trust.


![6.[45 54]factors influencing online banking customer satisfaction and their i...](https://cdn.slidesharecdn.com/ss_thumbnails/6-45-54factorsinfluencingonlinebankingcustomersatisfactionandtheirimportanceinimprovingoverallretentionlevels-111118182103-phpapp01-thumbnail.jpg?width=640&height=640&fit=bounds)


