Download to read offline
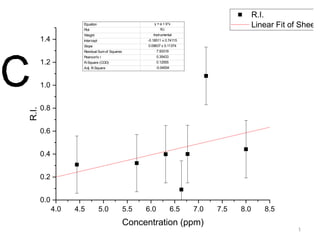

The document presents a linear regression analysis correlating response intensity (r.i.) with concentration levels in ppm, detailing parameters like the instrument's intercept and slope, and their respective uncertainties. It includes statistical measures such as residual sum of squares, Pearson's correlation coefficient, and R-squared values to assess the fit of the model. Data points from varying concentrations are also provided, showing r.i. values across tested concentrations.


