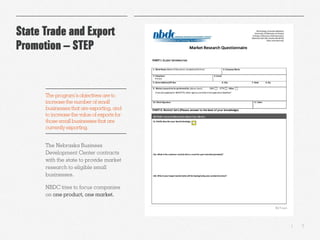
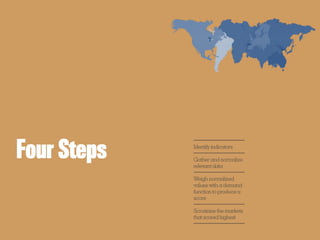
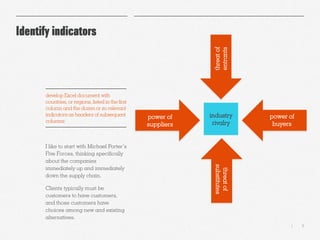
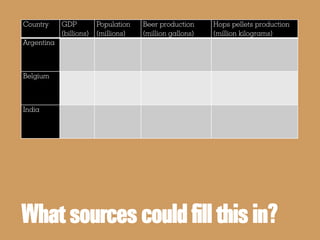
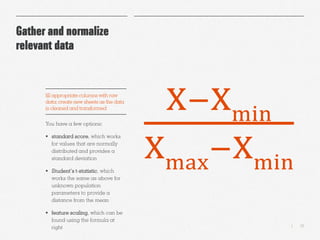
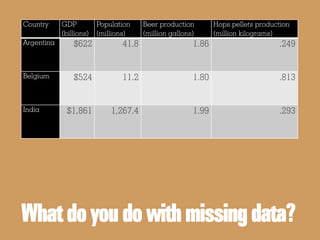
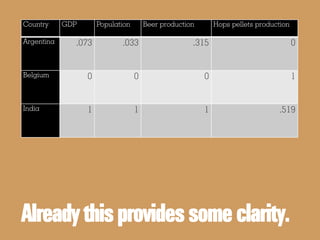
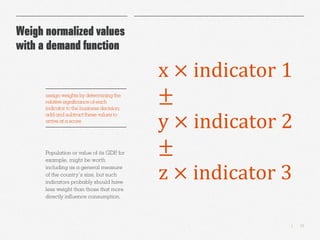
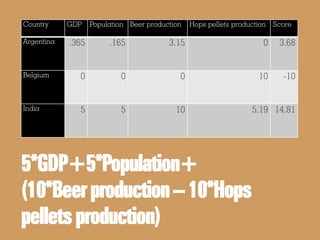
SURVEYING
GLOBAL
DEMAND
INDICATORS
Josh Nichol-Caddy, MA, MBA, CGBP
jnicholcaddy@unomaha.edu | (402) 554-4092
Introductions Josh Nichol-Caddy
NebraskaBusiness
Development Center
State Trade and Export
Promotion – STEP
3|
Josh Nichol-Caddy
 MA, Missouri School of
Journalism
 MBA, University of Missouri’s
Crosby MBA Program
 taught media production and
marketing strategy courses at
Stephens College
 worked as a business reporter
at the St. Louis Post-Dispatch,
multimedia reporter at the
Palm Beach Post, and video
editor and producer at OR-
Live/Broadcast Med
export consultant and market
research analyst at the Nebraska
BusinessDevelopmentCenter
nbdc.unomaha.edu/export-guide
4|
Nebraska Business
Development Center
NBDC centers located in:
1. Scottsbluff
2. Chadron
3. North Platte
4. Kearney
5. Grand Island
6. Wayne
7. Lincoln
8. Omaha
Mammel Hall at the
University of Nebraskaat Omaha
5|
State Trade and Export
Promotion – STEP
The Nebraska Business
Development Center contracts
with the state to provide market
research to eligible small
businesses.
NBDC tries to focus companies
on one product, one market.
The program’sobjectives are to
increase the number of small
businessesthat are exporting, and
to increase the value of exports for
those small businessesthat are
currently exporting.
6|
Selecting Foreign
Markets
Chapter Five — pages 51 to 61
nbdc.unomaha.edu/whitepapers/
Four Steps Identify indicators
Gather and normalize
relevant data
Weigh normalized
valueswith a demand
function to produce a
score
Scrutinize the markets
that scored highest
8|
Identify indicators
I like to start with Michael Porter’s
Five Forces, thinking specifically
about the companies
immediately up and immediately
down the supply chain.
Clients typically must be
customers to have customers,
and those customers have
choices among new and existing
alternatives.
develop Excel document with
countries, or regions, listed in the first
column and the dozen or so relevant
indicatorsas headers of subsequent
columns
industry
rivalry
power of
suppliers
power of
buyers
threatof
entrants
threatof
substitutes
Country GDP
(billions)
Population
(millions)
Beer production
(million gallons)
Hops pellets production
(million kilograms)
Argentina
Belgium
India
Whatsourcescouldfillthisin?
10|
Gather and normalize
relevant data
You have a few options:
 standard score, which works
for values that are normally
distributed and provides a
standard deviation
 Student’s t-statistic, which
works the same as above for
unknown population
parameters to provide a
distance from the mean
 feature scaling, which can be
found using the formula at
right
fill appropriate columns with raw
data; create new sheets as the data
is cleaned and transformed X−Xmin
Xmax
−Xmin
Country GDP
(billions)
Population
(millions)
Beer production
(million gallons)
Hops pellets production
(million kilograms)
Argentina $622 41.8 1.86 .249
Belgium $524 11.2 1.80 .813
India $1,861 1,267.4 1.99 .293
Whatdo you do withmissingdata?
Country GDP Population Beer production Hops pellets production
Argentina .073 .033 .315 0
Belgium 0 0 0 1
India 1 1 1 .519
Alreadythisprovidessome clarity.
13|
Weigh normalized values
with a demand function
Population or value of its GDP, for
example, might be worth
including as a general measure
of the country’s size, but such
indicators probably should have
less weight than those that more
directly influence consumption.
assign weights by determining the
relative significance of each
indicator to the business decision;
add and subtract these values to
arrive at a score
x × indicator 1
±
y × indicator 2
±
z × indicator 3
Country GDP Population Beer production Hops pellets production Score
Argentina .365 .165 3.15 0 3.68
Belgium 0 0 0 10 -10
India 5 5 10 5.19 14.81
5*GDP+5*Population+
(10*Beerproduction–10*Hops
pelletsproduction)
15|
Scrutinize markets that
score highest
Ask:
 Are there some surprises?
 Why might that be?
 Otherwise, do these results
hang together?
 Is this the complete story?
 Why might this information be
imperfect?
 How might holes be filled?
 If they cannot be filled, how
does that affect the analysis?
question the validity of the score,
adding qualitative information and
further context to a report that
discussesthe process
Develop report Background
Objectives
Executive Summary
Methods
ResearchFindings
SWOT
Limitations
Bibliography
Appendix
Attachments
“WE JUST SENT A
SHIPMENT OF HOPS
TO MEXICO, BASED
ON THE ANALYSIS
YOU PROVIDED.
THANK YOU.
SURVEYING
GLOBAL
DEMAND
INDICATORS
Josh Nichol-Caddy, MA, MBA, CGBP
jnicholcaddy@unomaha.edu | (402) 554-4092

conference_presentation

  • 1.
    SURVEYING GLOBAL DEMAND INDICATORS Josh Nichol-Caddy, MA,MBA, CGBP jnicholcaddy@unomaha.edu | (402) 554-4092
  • 2.
    Introductions Josh Nichol-Caddy NebraskaBusiness DevelopmentCenter State Trade and Export Promotion – STEP
  • 3.
    3| Josh Nichol-Caddy  MA,Missouri School of Journalism  MBA, University of Missouri’s Crosby MBA Program  taught media production and marketing strategy courses at Stephens College  worked as a business reporter at the St. Louis Post-Dispatch, multimedia reporter at the Palm Beach Post, and video editor and producer at OR- Live/Broadcast Med export consultant and market research analyst at the Nebraska BusinessDevelopmentCenter nbdc.unomaha.edu/export-guide
  • 4.
    4| Nebraska Business Development Center NBDCcenters located in: 1. Scottsbluff 2. Chadron 3. North Platte 4. Kearney 5. Grand Island 6. Wayne 7. Lincoln 8. Omaha Mammel Hall at the University of Nebraskaat Omaha
  • 5.
    5| State Trade andExport Promotion – STEP The Nebraska Business Development Center contracts with the state to provide market research to eligible small businesses. NBDC tries to focus companies on one product, one market. The program’sobjectives are to increase the number of small businessesthat are exporting, and to increase the value of exports for those small businessesthat are currently exporting.
  • 6.
    6| Selecting Foreign Markets Chapter Five— pages 51 to 61 nbdc.unomaha.edu/whitepapers/
  • 7.
    Four Steps Identifyindicators Gather and normalize relevant data Weigh normalized valueswith a demand function to produce a score Scrutinize the markets that scored highest
  • 8.
    8| Identify indicators I liketo start with Michael Porter’s Five Forces, thinking specifically about the companies immediately up and immediately down the supply chain. Clients typically must be customers to have customers, and those customers have choices among new and existing alternatives. develop Excel document with countries, or regions, listed in the first column and the dozen or so relevant indicatorsas headers of subsequent columns industry rivalry power of suppliers power of buyers threatof entrants threatof substitutes
  • 9.
    Country GDP (billions) Population (millions) Beer production (milliongallons) Hops pellets production (million kilograms) Argentina Belgium India Whatsourcescouldfillthisin?
  • 10.
    10| Gather and normalize relevantdata You have a few options:  standard score, which works for values that are normally distributed and provides a standard deviation  Student’s t-statistic, which works the same as above for unknown population parameters to provide a distance from the mean  feature scaling, which can be found using the formula at right fill appropriate columns with raw data; create new sheets as the data is cleaned and transformed X−Xmin Xmax −Xmin
  • 11.
    Country GDP (billions) Population (millions) Beer production (milliongallons) Hops pellets production (million kilograms) Argentina $622 41.8 1.86 .249 Belgium $524 11.2 1.80 .813 India $1,861 1,267.4 1.99 .293 Whatdo you do withmissingdata?
  • 12.
    Country GDP PopulationBeer production Hops pellets production Argentina .073 .033 .315 0 Belgium 0 0 0 1 India 1 1 1 .519 Alreadythisprovidessome clarity.
  • 13.
    13| Weigh normalized values witha demand function Population or value of its GDP, for example, might be worth including as a general measure of the country’s size, but such indicators probably should have less weight than those that more directly influence consumption. assign weights by determining the relative significance of each indicator to the business decision; add and subtract these values to arrive at a score x × indicator 1 ± y × indicator 2 ± z × indicator 3
  • 14.
    Country GDP PopulationBeer production Hops pellets production Score Argentina .365 .165 3.15 0 3.68 Belgium 0 0 0 10 -10 India 5 5 10 5.19 14.81 5*GDP+5*Population+ (10*Beerproduction–10*Hops pelletsproduction)
  • 15.
    15| Scrutinize markets that scorehighest Ask:  Are there some surprises?  Why might that be?  Otherwise, do these results hang together?  Is this the complete story?  Why might this information be imperfect?  How might holes be filled?  If they cannot be filled, how does that affect the analysis? question the validity of the score, adding qualitative information and further context to a report that discussesthe process
  • 16.
    Develop report Background Objectives ExecutiveSummary Methods ResearchFindings SWOT Limitations Bibliography Appendix Attachments
  • 17.
    “WE JUST SENTA SHIPMENT OF HOPS TO MEXICO, BASED ON THE ANALYSIS YOU PROVIDED. THANK YOU.
  • 18.
    SURVEYING GLOBAL DEMAND INDICATORS Josh Nichol-Caddy, MA,MBA, CGBP jnicholcaddy@unomaha.edu | (402) 554-4092