Downloaded 15 times


![COMPUTER WAREHOUSE GROUP PLC
NOTES TO THE FINANCIAL STATEMENTS - Continued
36
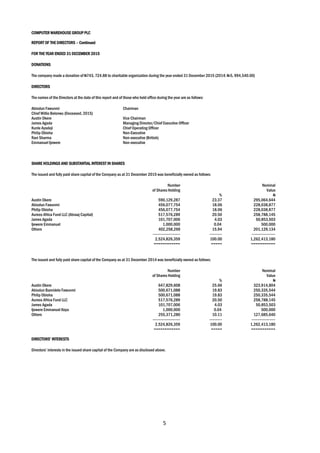
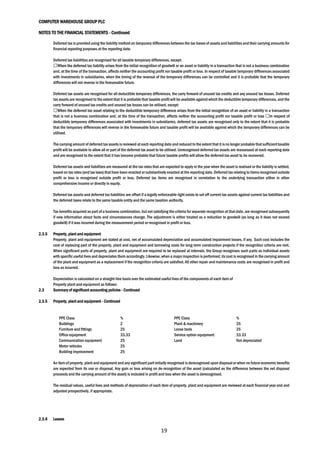
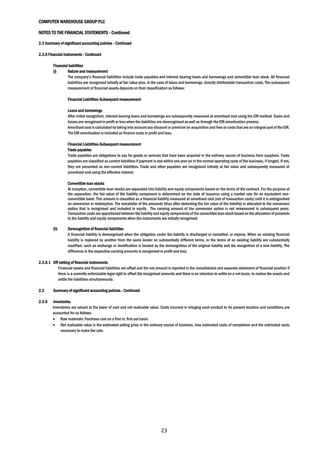
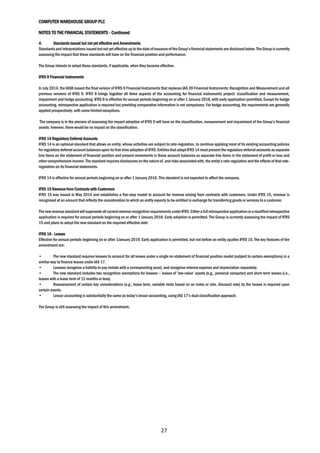
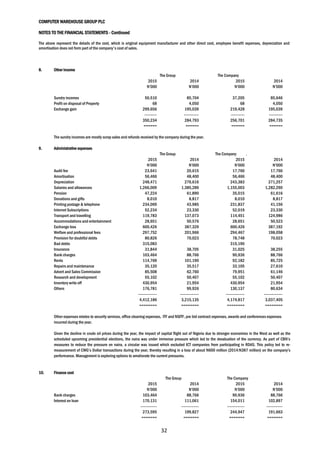
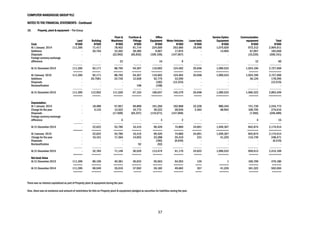
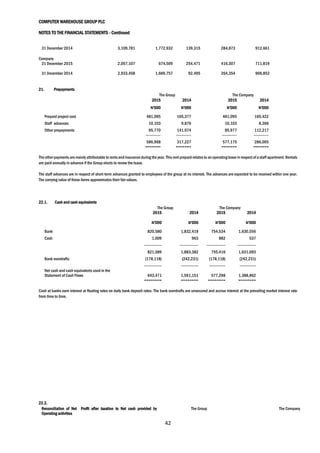
14.2. Goodwill
Goodwill acquired through business combinations has been allocated to two CGUs, which are also operating and reportable segments, for impairment
testing as follows:
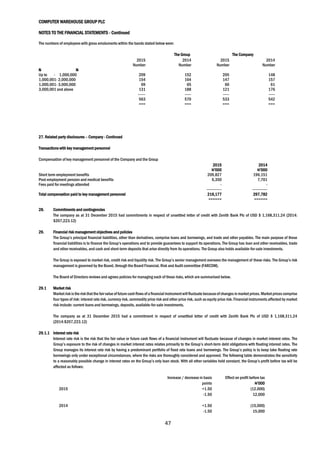
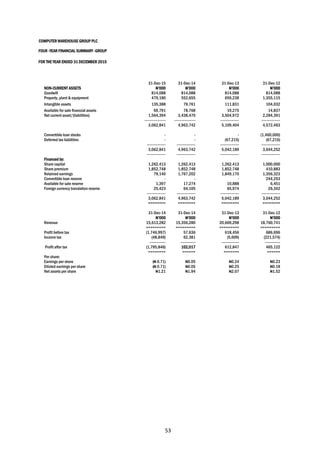
1] Software CGU 2] Hardware CGU
Carrying amount of goodwill allocated to each of the CGUs:
2015 2014
N’000 N’000
Software CGU 76,717 76,717
Hardware CGU** 737,371 737,371
------------- -------------
814,088 814,088
======= =======
** The hardware CGU is included in the IT Infrastructure segment.
Software CGU
The recoverable amount of software cash generating unit was based on its value in use and was determined by discounting the future cash flow projections from
the financial budgets approved by senior management covering a 5 years period. Unless indicated the value in use in December 2015 was determined in similar
was as 31 December 2014.
The calculation of value in use was based on the following keys assumptions:
Cash flow was projected based on past experience, actual operating result and a 5 – year operating cash-flow in both 2014 and 2015.
Revenue growth rate
The revenue growth rate was based on 4%(2016), 5%(2017), 5%(2018), 5%(2019) and 5%(2010). The revenue growth included in the cash flow projections for
the years 2016-2020 has been on the trend of foreseeable growth in the business segments.
Pre-tax discount rate
The pre-tax discount rate of 13.3% was applied in determining the recoverable amount of the unit. The discount rate was estimated based on past experience and
industry weighted average cost of capital which was based on the incremental borrowing rate.
Gross/Cost margin
The gross margin has been projected as 30% (2016), 32% (2017), 32 %( 2018), 30% (2019) and 28% (2020) while the relevant cost margin was estimated as
70% (2016), 68% (2017), 68% (2018), 70% (2019) and 72 %( 2020)
Hardware CGU
The recoverable amount of hardware CGU generating unit was based on its value in use and was determined by discounting the future cash flow projections from
financial budget approved by senior management covering a 4 years period. Unless indicated the value in use in December 2015 was determined similarly to as
in 31 December 2014.
Hardware CGU
The calculation of value in use was based on the following keys assumptions:
Cash flow was projected based on past experience, actual operating result and a 5 year operating plan in both 2014 and 2015.
Revenue growth rate
The revenue growth rate was based on 4%(2016), 5%(2017), 5%(2018), 5%(2019) and 5%(2010). The revenue growth included in the cash flow projections for
the years 2016-2020 has been on the trend of foreseeable growth in the business segments.
Pre-tax discount rate
The pre-tax discount rate 13.3% was applied in determining the recoverable amount of the unit. The discount rate was estimated based on past experience and
industry weighted average cost of capital which was based on the incremental borrowing rate.
Gross/Cost Margins
The gross margin was projected as 15% (2015), 21% (2016), 21% (2017), 20% (2018), and 19% (2016), while the relevant cost margin was estimated as 85%
(2016), 79% (2017), 79% (2018) ,80% (2019) and 81%(2020)
A result of this analysis, there was no impairment charged for Hardware CGU and software CGU in 2014 and 2015.](https://image.slidesharecdn.com/vqyvwvebrcmbbkxqxyfa-signature-634959125bf3f2fe6fe4d90419f6a99fc8c93872f47a115ae157f2ae7a1b1983-poli-160608110051/85/Computer-warehouse-group-annual-report-2015-36-320.jpg)
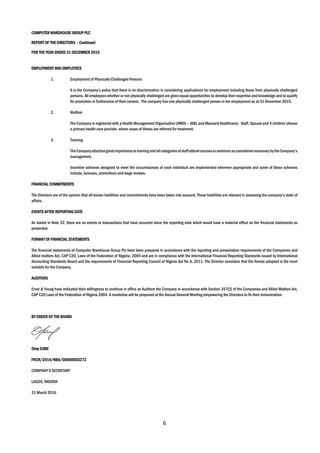
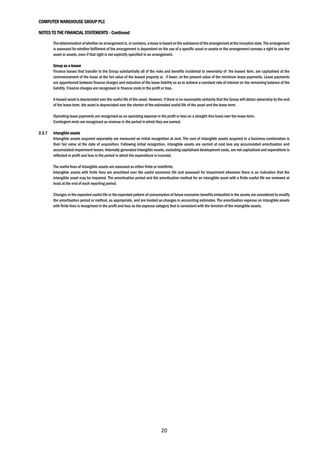
![COMPUTER WAREHOUSE GROUP PLC
NOTES TO THE FINANCIAL STATEMENTS - Continued
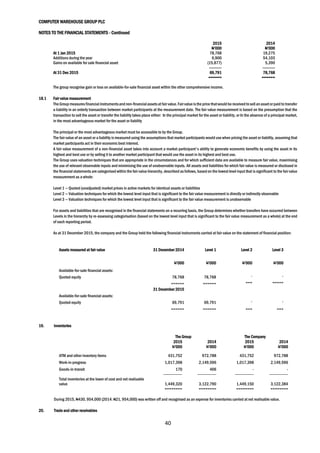
41
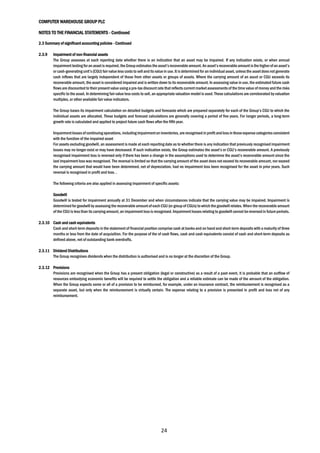
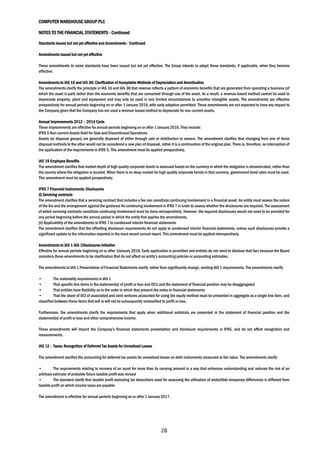
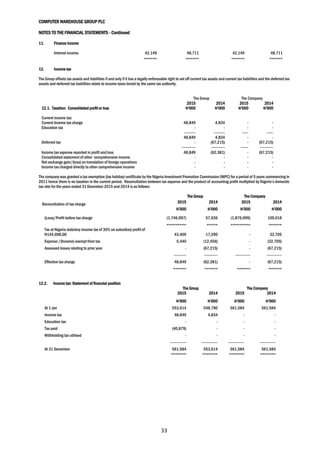
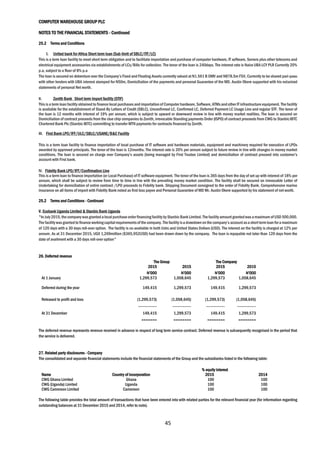
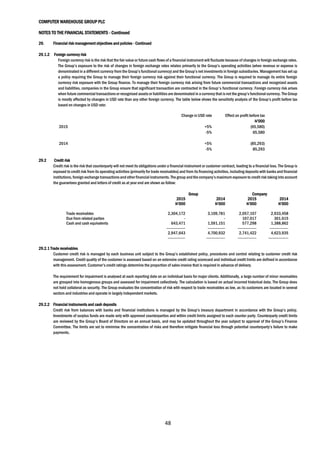
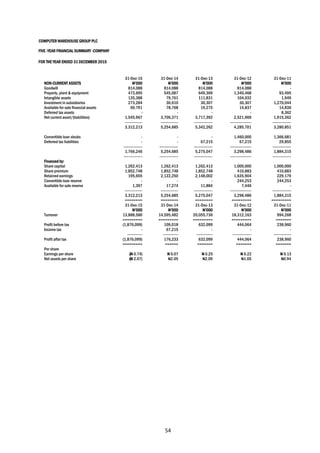
Group Company
2015 2014 2015 2014
N’000 N’000 N’000 N’000
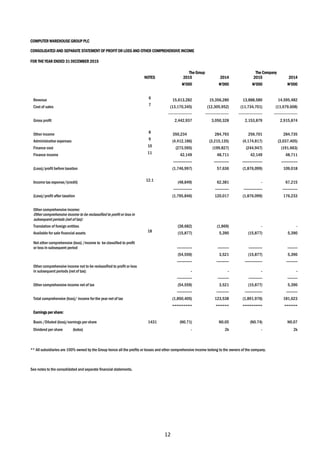
Trade receivable 2,304,172 3,109,781 2,057,107 2,933,458
Impairment allowance [20.1] (151,253) (70,427) (149,175) (70,427)
-------------- ------------- ------------- -------------
2,152,919 3,039,354 1,907,932 2,863,031
Other receivables 165,603 314,789 37,575 179,723
Due from related parties - - 107,017 301,312
WHT receivables 3,851,274 3,493,455 3,792,427 3,484,700
--------------- --------------- ---------------- ----------------
6,169,796 6,847,598 5,844,951 6,828,766
======== ======== ======== ========
Trade receivables are non-interest bearing and are generally on terms of 30 to 90 days. The carrying value of these items approximates their fair value.
As at 31 December 2015, Group trade receivables of an initial value of N 151,253,000 (2014: N 70,427,175) were impaired and fully provided for while Company
trade receivables of an initial value of N 149,175,000 (2014: N 70,427,175) were impaired and fully provided for. See Note 20.1 below for the movements in the
provision for impairment of receivables for the company and the group
20.1 Allowances for Impairment Account – Group Individually impaired Total
N’000 N’000
At 1 January 2014 127,816 127,816
Unused amounts reversed (57,389) (57,389)
------------ -------------
At 1 January 2015 70,427 70,427
Charge for the year 80,826 80,826
------------- -------------
At 31 December 2015 151,253 151,253
======= =======
20.1 Allowances for Impairment Account – Company Individually impaired Total
N’000 N’000
At 1 January 2014 127,816 127,816
Unused amounts reversed (57,389) (57,389)
------------ -------------
At 1 January 2015 70,427 70,427
Charge for the year 78,748 78,748
------------- -------------
At 31 December 2015 149,175 149,175
======= =======
20.2 Ageing analysis
As at 31 December, the ageing analysis of trade receivables for group and the company are as follows:
Group Total Current >30 days >60 days >90 days
N’000 N’000 N’000 N’000 N’000
31 December 2015 2,304,172 822,749 303,885 453,367 724,172](https://image.slidesharecdn.com/vqyvwvebrcmbbkxqxyfa-signature-634959125bf3f2fe6fe4d90419f6a99fc8c93872f47a115ae157f2ae7a1b1983-poli-160608110051/85/Computer-warehouse-group-annual-report-2015-41-320.jpg)


The document is the report of the directors and consolidated and separate audited financial statements for Computer Warehouse Group PLC for the year ended 31 December 2015. It includes information such as the directors' report, corporate governance report, statement of directors' responsibilities, independent auditors' report, consolidated and separate statements of profit or loss and other comprehensive income, financial position, changes in equity, cash flows, notes to the financial statements, value added statement, and 5-year and 4-year financial summaries. The directors report that the group incurred a loss before taxation of N1,746,997,000 for the year ended 31 December 2015 compared to a profit before taxation of N57,636,000 in the prior year.


