Download to read offline
![Engineering in Computer Science Academic Year 2019-2020
3 Manual scraping Wikipedia
DBpedia offers few results for Computer Scientists, which is why it was decided to
take a more demanding path but that would give us more results: Web Scarping.
It was decided to divide this process into 4 logical phases:
1. Collect in a file all the links of computer scientists present in the English
version of Wikipedia (List Of Computer Scientists).
2. For each link of a computer scientist obtained from the previous phase, it was
checked whether the relative web page contained an information table that
included the list of influences and influences of this computer scientist.
3. From the results obtained, the Pagerank was calculated with the aim of quanti-
fying the importance of the relative computer scientist within the set of related
documents.
4. It was decided to dwell on the classification of the various fields of study of a
computer scientist.
3.1 First Phase: Collect data
The English version of Wikipedia contains a list of all the computer scientists (link)
with an existing article, alphabetically sorted. In the first phase, we simply copy
each link and its associated name in a .json file.
The total number of computer scientists retrieved is 509.
3.2 Second Phase: Check informations in Biographic Table
Before starting to extrapolate the information of each computer scientist, for a
matter of code optimization and efficiency in terms of performance it was decided to
download the entire Wikipedia pages of each of them, so as not to make n cs = 509
requests.
After collecting the web pages of each computer scientist, for each of them it was
checked whether the corresponding page contained an information table (Infobox
HTML) which included the list of influences and influencers of the said computer
scientist.
The number of Computer Scientists who meet this requirement is 62.
✞ ☎
1 def bio_table ( self , page ) :
2 name = page . rsplit ( ’/’) [ −1]
3 page = open ( page , ’r’)
4 soup = BeautifulSoup ( page , "html.parser" )
5 table = soup . find ( ’table ’ , class_=’infobox biography vcard ’)
6 try : influencers = table . find_all ( ’ul’ , class_=’NavContent ’) [ 0 ]
7 except : influencers = [ ]
8 try : influenced = table . find_all ( ’ul’ , class_=’NavContent ’) [ 1 ]
9 except : influenced = [ ]
10 final_influencers , final_influenced = ( [ ] for i in range (2) )
11 if influencers != [ ] :
12 for a in influencers . find_all ( ’a’) :
13 final_influencers . append ( a . get ( ’title ’) )
14 if influenced != [ ] :
15 for a in influenced . find_all ( ’a’) :
16 final_influenced . append ( a . get ( ’title ’) )
✝ ✆
Listing 2: Checking Bio Table Function
5](https://image.slidesharecdn.com/wirreport-200722143918/75/Computer-Scientists-Retrieval-PDF-Report-5-2048.jpg)
![Engineering in Computer Science Computer Scientists Retrieval
3.3 Third Phase: Second Approach and Pagerank
Since the result obtained from the second phase was not at all satisfactory, it was
decided to use a second approach: instead of checking only the biography table of a
computer scientist, the entire page associated with him was analyzed.
✞ ☎
1 def make_links ( self , path ) :
2 # Define output dict
3 inlinks = SortedDict ()
4 outlinks = SortedDict ()
5
6 SetofNames = SortedSet ()
7
8 #reading all the folders from the path and creating a set of CS names
9 for name in self . read_names ( path ) :
10 if name == "Guy_L._Steele ,_Jr" : name = "Guy_L._Steele ,_Jr."
11
12 SetofNames . add ( name )
13
14 #creating an empty inlinks of names as sortedSet
15 inlinks [ name ] = SortedSet ()
16
17 #reading their inlinks and outlinks
18 for name in SetofNames :
19 SetOfInLinks = SortedSet ()
20 fp = open ( path + "/"+ name , ’r’ , encoding = "utf -8" )
21 soup = BeautifulSoup ( fp . read () , "html.parser" )
22 linksFound = [ ]
23 linksFound = soup . findAll ( ’a’ , href=re . compile ( "/wiki/" ) )
24
25 HTML = ""
26 for link in linksFound :
27 HTML = HTML + str ( link )
28 HTML = HTML + " and "
29
30 #get All the outlinks by calling get_links
31 outlinks [ name ] = self . get_links ( SetofNames , HTML )
32
33 if name in outlinks [ name ] : outlinks [ name ] . remove ( name )
34
35 for outlink in outlinks [ name ] :
36 SetOfInLinks . add ( name )
37 inlinks [ outlink ] . update ( SetOfInLinks )
38 return ( inlinks , outlinks )
✝ ✆
Listing 3: Making Links
The previous function, after reading the html pages of each computer scientist as
input, creates and returns two SortedDict:
• inlinks: maps from a name to a SortedSet of names that link to it.
• outlinks: maps from a name to a SortedSet of names that it links to.
For example:
• inlinks[’Ada_Lovelace’] = SortedSet([’Charles_Babbage’, ’David_Gelernter’], key=None, load=1000)
• outlinks[’Ada_Lovelace’] = SortedSet([’Alan_Turing’, ’Charles_Babbage’], key=None, load=1000)
To obtain all the outlinks we call self.get_links(SetofNames,HTML), which return a SortedSet
of computer scientist names that are linked from this html page. The return set is
restricted to those people in the provided set of names. The returned list should
contain no duplicates. This function take as input:
• A SortedSet of computer scientist names, one per filename.
• A string representing one html page.
6](https://image.slidesharecdn.com/wirreport-200722143918/75/Computer-Scientists-Retrieval-PDF-Report-6-2048.jpg)
![Engineering in Computer Science Academic Year 2019-2020
✞ ☎
1 def get_links ( self , names , html ) :
2 listofHrefs = [ ]
3 listofHrefTexts = [ ]
4 FinalSortedSet = SortedSet ()
5 splice_char = ’/’
6
7 for i in range (0 , len ( listofHrefs ) ) :
8 value = listofHrefs [ i ] [ 6 : ]
9 listofHrefTexts . append ( value )
10
11 listofHrefTexts = re . findall ( r"href=""]*)" , html )
12
13 for i in listofHrefTexts :
14 value = i [ 6 : ]
15 listofHrefs . append ( value )
16 listofHrefs = list ( set ( listofHrefs ) )
17
18 for href in listofHrefs :
19 for name in names :
20 if ( name == "Guy_L._Steele ,_Jr" ) :
21 names . remove ( name )
22 names . add ( "Guy_L._Steele ,_Jr." )
23 if ( href == name ) : FinalSortedSet . add ( name )
24
25 return FinalSortedSet
✝ ✆
Listing 4: Get Links
With the results obtained by the function make links we can calculate the pagerank
by calling the function compute_pagerank.
✞ ☎
1 def compute_pagerank ( self , urls , inlinks , outlinks , b =.85 , iters=20) :
2 rw = defaultdict ( lambda : 0 . 0 )
3 pageRank = defaultdict ( lambda : 1 . 0 )
4
5 for outlink in outlinks : rw [ outlink]=len ( outlinks [ outlink ] )
6
7 #initialize page ranks scores to 1
8 for url in urls : pageRank [ url ] = 1.0
9
10 for i in range ( iters ) :
11 for url in urls :
12 summ = 0.0
13 for link in inlinks [ url ] : summ += 1.0 ∗ pageRank [ link ]/ rw [ link ]
14 pageRank [ url ] = (1/ len ( urls ) ) ∗ (1.0 − b )+b∗summ
15 return SortedDict ( dict ( pageRank ) )
✝ ✆
Listing 5: Computing Pagerank
This function return a SortedDict mapping each url to its final PageRank value
(float) by using this formula:
R(u) =
! 1
N
"
(1 − b) + b ·
#
w∈Bu
R(w)
|Fw|
where:
• R(u) = Pagerank value of the page u we want to calculate;
• B(u) = A set of pages that contain at least one link to the u page. w represents
each of these pages;
• R(w) = PageRank values of each page w;
• Fw = Total number of links contained on the page offering the link;
• b = Damping factor. It is generally assumed that it will be set around 0.85.
7](https://image.slidesharecdn.com/wirreport-200722143918/75/Computer-Scientists-Retrieval-PDF-Report-7-2048.jpg)
![Engineering in Computer Science Academic Year 2019-2020
4 Categorization
A further experiment was to try to draw up a ranking of the best branches of study
carried out by these people.
In evaluating the fields that can be used, it has been verified that the majority of
computer scientists present in the famous Wikipedia infobox table a field called Field
which is right for us: it contains every category of study carried out from the person
being examined.
Out of a total of 509 computer scientists, this field is present in about 480 people.
In the lower left is shown the code used to extrapolate this information and a function
designed to create a json file that associates the name of a computer scientist with
the categories to which it belongs.
✞ ☎
1 def get_fields ( self , file_name ) :
2 soup = BeautifulSoup ( self .
get_html_content ( file_name ) , ’html.
parser ’)
3 infobox = soup . find ( ’table ’ , {’class ’
: ’infobox ’})
4 fields_list = [ ]
5 if infobox != None :
6 for item in infobox . findAll ( ’tr’) :
7 infobox_key = item . find ( ’th’)
8 if infobox_key != None and
infobox_key . get_text () == ’Fields ’ :
9 infobox_value = item . find ( ’td’)
10 fields_list . append (
infobox_value . get_text () )
11 this_name = self .
get_cs_name_from_filename ( file_name
)
12 return fields_list
✝ ✆
Listing 6: Get Fields
✞ ☎
1 def compute_categorization ( self ,
all_cs_files_list ) :
2 to_ret = [ ]
3 none = 0
4 for file_name in
all_cs_files_list :
5 cs_name = self .
get_cs_name_from_filename (
file_name )
6 his_fields = self . clean_fields
( self . get_fields ( file_name ) )
7
8 new_fields = [ ]
9 for item in his_fields :
new_fields . append ( item .
capitalize () )
10 if new_fields != [ ] :
11 cs_name = urllib . parse .
unquote ( cs_name )
12 to_ret . append ({ cs_name :
new_fields })
13 else :
14 none += 1
15 return to_ret
✝ ✆
Listing 7: Categorization
After obtaining a json file containing the ordered set of categories associated with a
computer scientist, a ranking was finally drawn up through the computation of the
pagerank and hits algorithm.
The results obtained by the two algorithms are shown below:
hits top 20 categories.txt
’Computer science’, 0.326117140120153
’Mathematics’, 0.0905002288461773
’Artificial intelligence’, 0.06685354382887093
’Logic’, 0.03427669758106854
’Electrical engineering’, 0.02833238326892856
’Human-computer interaction’, 0.021348931558433284
’Cognitive psychology’, 0.01891198265547915
’Internet’, 0.017865405333952915
’Cryptography’, 0.01738984860471658
’Engineering’, 0.017205005058716537
’Parallel computing’, 0.016884266897918044
’Computer engineering’, 0.01666589916367132
’Cognitive science’, 0.012768419943534962
’Machine learning’, 0.012000867181936405
’Theoretical biology’, 0.011521251294523721
’Cryptanalysis’, 0.011521251294523721
’Complex systems’, 0.01109965631694415
’Political science’, 0.0105244314790377
’Economics’, 0.0105244314790377
’Biology’, 0.010380178200082258
’Philosophy’, 0.010380178200082258
pagerank top 20 categories.txt
’Computer science’, 0.04919569025380936
’Mathematics’, 0.021521266029255075
’Artificial intelligence’, 0.01889296875653205
’Human-computer interaction’, 0.011111147419646208
’Theoretical computer science’, 0.008998202553339458
’Logic’, 0.008379779665639922
’Semantic web’, 0.008122103462431782
’Machine learning’, 0.00812210346243178
’Robotics’, 0.007864427259223643
’Electrical engineering’, 0.0077613567779403845
’Entrepreneur’, 0.006730651965107824
’Statistics’, 0.006730651965107824
’Computer engineering’, 0.006730651965107824
’Computational information systems’, 0.006730651965107824
’Cognitive science’, 0.006576046243182939
’Cryptography’, 0.006215299558691543
’Parallel computing’, 0.006215299558691543
’Computer graphics’, 0.006215299558691543
’Operating systems’, 0.006215299558691543
’Engineering’, 0.005957623355483403
’Physics’, 0.005957623355483403
9](https://image.slidesharecdn.com/wirreport-200722143918/75/Computer-Scientists-Retrieval-PDF-Report-9-2048.jpg)

![Engineering in Computer Science Computer Scientists Retrieval
References
[1] SPARQLWrapper: https://pypi.org/project/SPARQLWrapper/
[2] bs4 Beautiful Soup: https://www.crummy.com/software/BeautifulSoup/bs4/doc/
[3] urllib: https://docs.python.org/3/library/urllib.html
[4] requests: https://requests.readthedocs.io/en/master/
[5] Regular expression operations (re): https://docs.python.org/3/library/re.html
[6] NetworkX: https://networkx.github.io
[7] Matplotlib: https://matplotlib.org/users/pyplot tutorial.html
[8] Sortedcontainers: http://www.grantjenks.com/docs/sortedcontainers/
[9] Collections: https://docs.python.org/3/library/collections.html
[10] Glob: https://docs.python.org/2/library/glob.html
[11] Tarfile: https://docs.python.org/3/library/tarfile.html
12](https://image.slidesharecdn.com/wirreport-200722143918/75/Computer-Scientists-Retrieval-PDF-Report-13-2048.jpg)
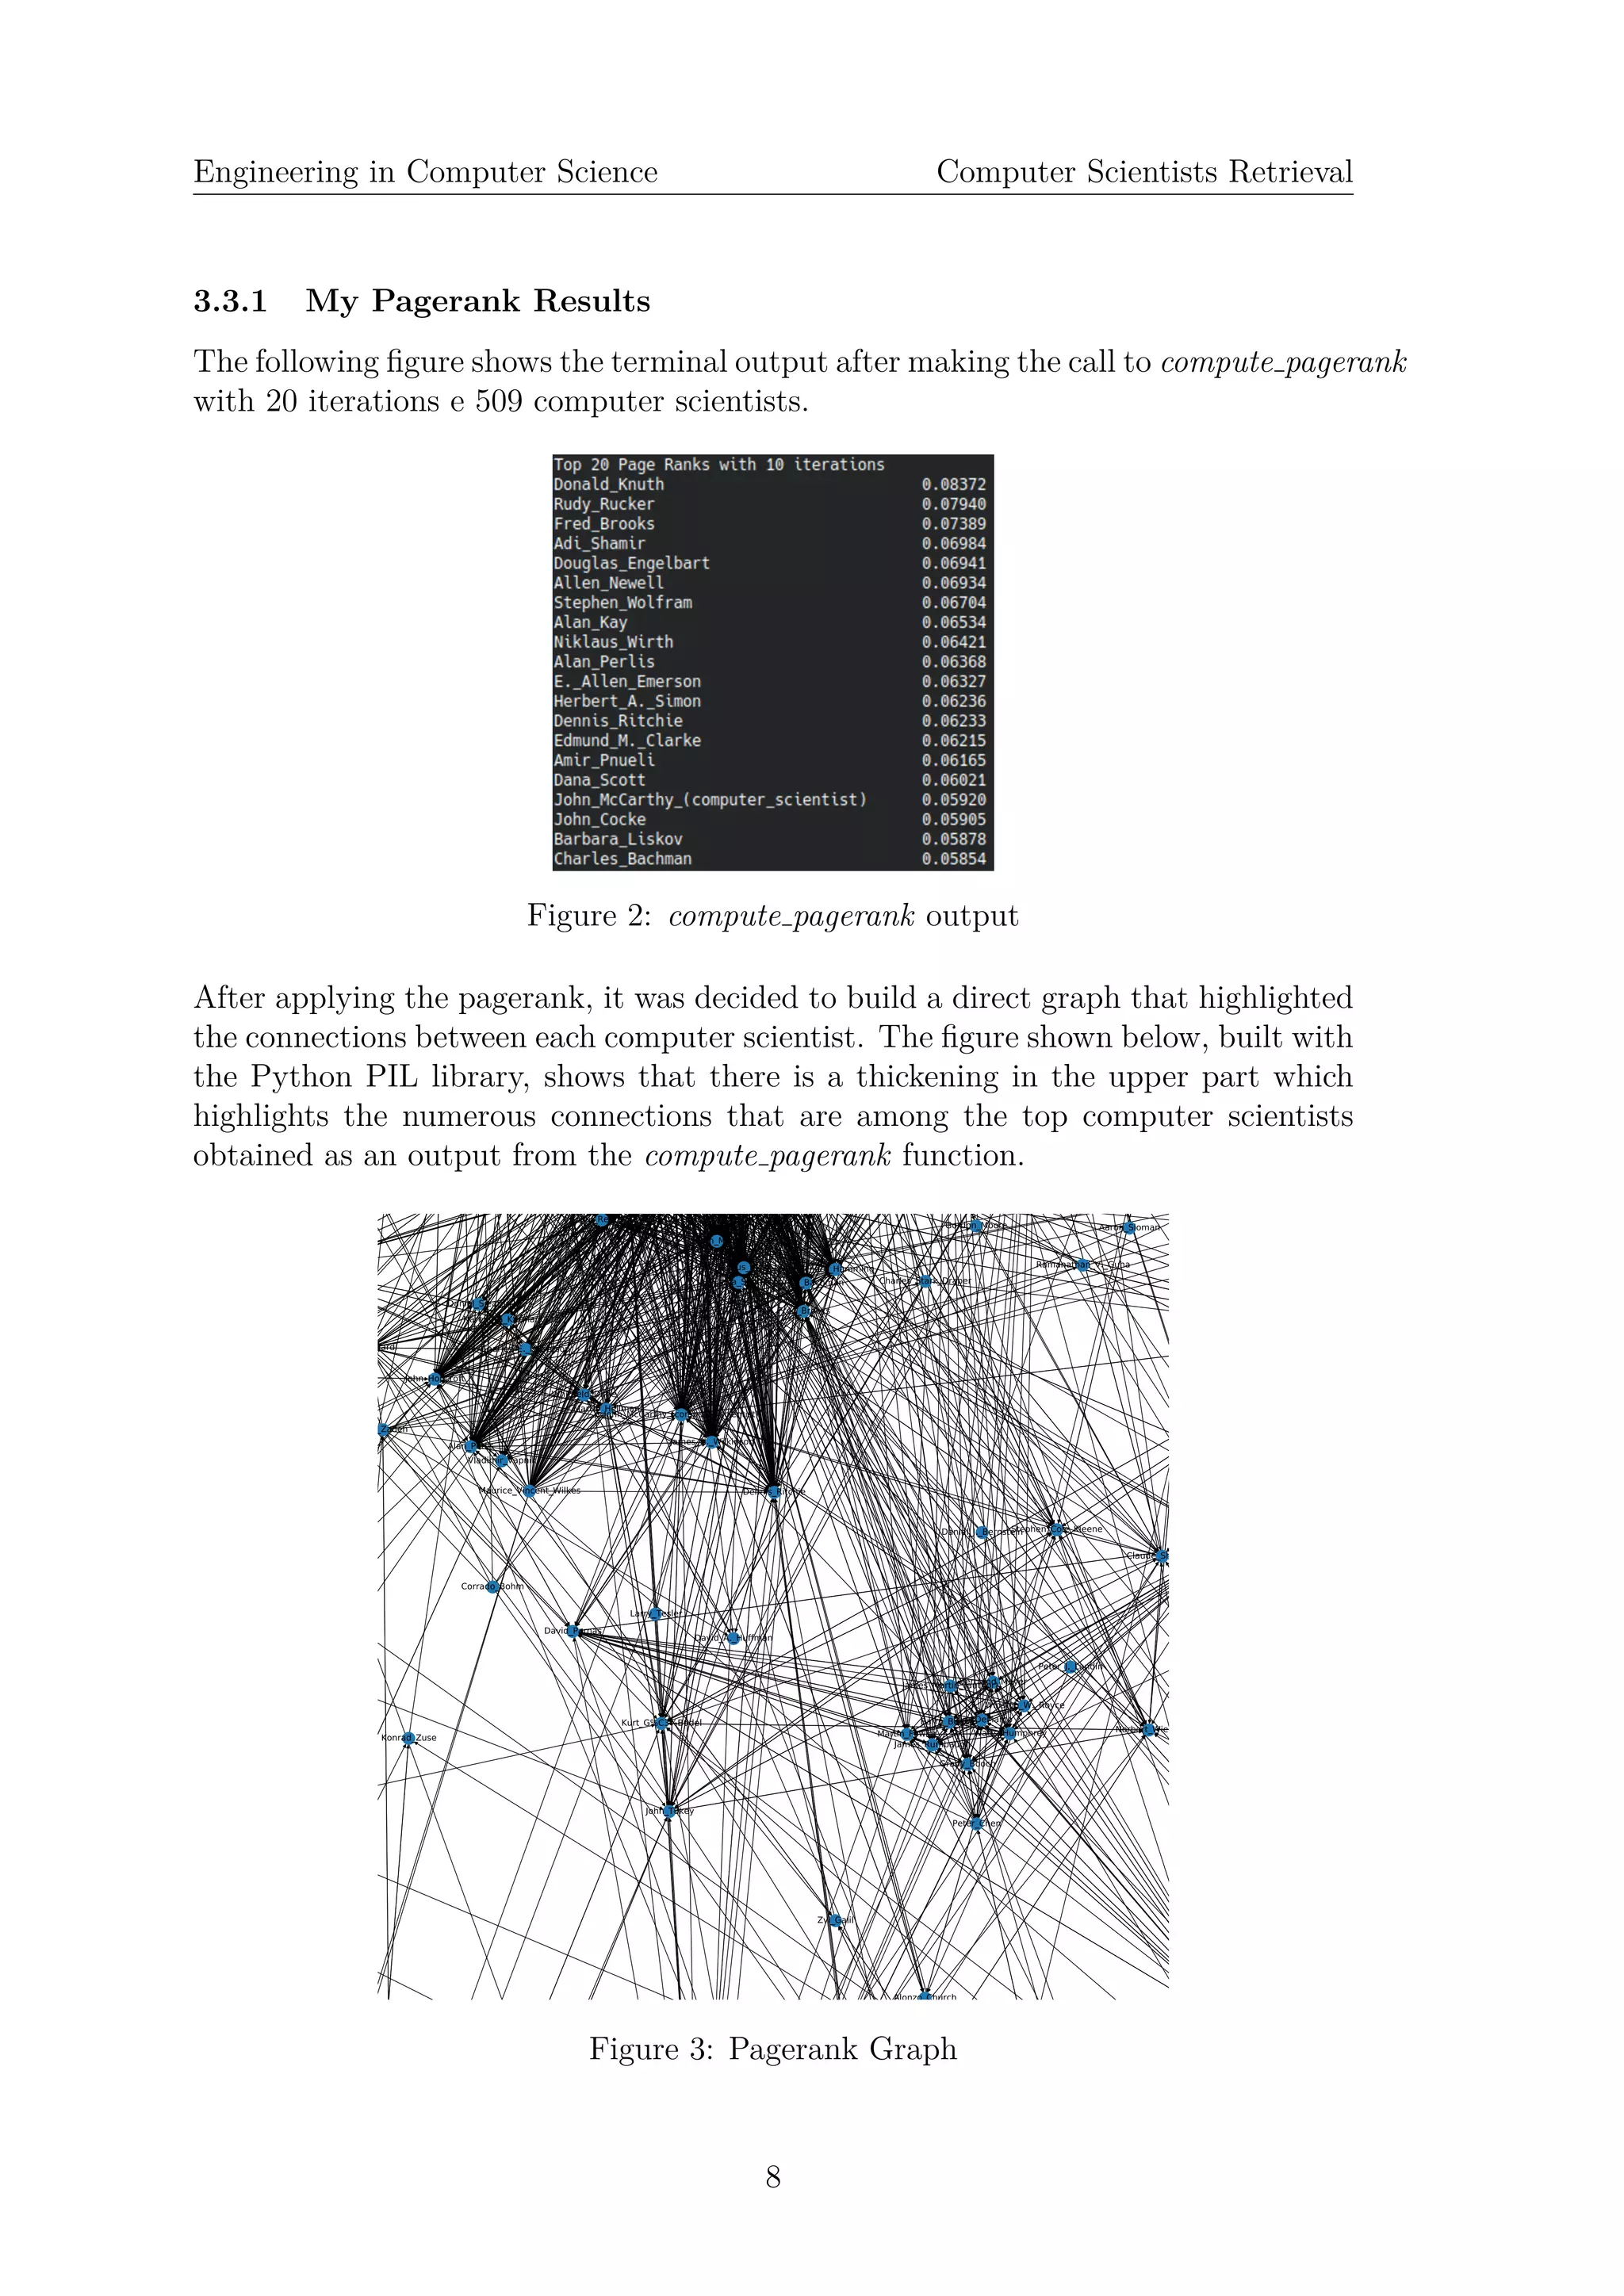
The document outlines a project that applied Google's PageRank algorithm to identify and analyze influential computer scientists, inspired by a previous study on rock guitarists. It describes the methodology involving data collection from Wikipedia and DBpedia, including challenges faced due to the lack of comprehensive data on computer scientists. The project resulted in a directed graph representing connections between scientists and included a ranking of their fields of study based on the information gathered.