More Related Content
Similar to Compstatvoorbeeld
Similar to Compstatvoorbeeld (10)
More from Frank Smilda (20)
Compstatvoorbeeld
- 1. COMPSTAT
Citywide Profile
07/10/11 - 08/06/11
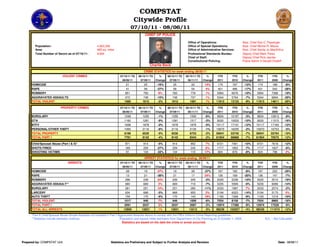
CHIEF OF POLICE
Office of Operations: Asst. Chief Earl C. Paysinger
Population: 4,003,236 Office of Special Operations: Asst. Chief Michel R. Moore
Area: 485 sq. miles Office of Administrative Services: Asst. Chief Sandy Jo MacArthur
Total Number of Sworn as of 07/16/11: 9,844 Professional Standards Bureau: Deputy Chief Mark Perez
Chief of Staff: Deputy Chief Rick Jacobs
Constitutional Policing: Police Admin II Gerald Chaleff
Charlie Beck
0
CRIME STATISTICS for week ending 08/06/11
VIOLENT CRIMES 07/10/11 TO 06/12/11 TO % 06/12/11 TO 05/15/11 TO % YTD YTD % YTD YTD %
08/06/11 07/09/11 Change 07/09/11 06/11/11 Change 2011 2010 Change 2011 2009 Change
HOMICIDE 21 25 -16% 25 22 14% 174 197 -12% 174 189 -8%
RAPE 41 56 -27% 56 54 4% 401 486 -17% 401 542 -26%
ROBBERY 851 783 9% 783 778 1% 5994 6676 -10% 5994 7386 -19%
AGGRAVATED ASSAULTS 672 748 -10% 748 737 1% 5344 5764 -7% 5344 6694 -20%
TOTAL VIOLENT 1585 1612 -2% 1612 1591 1% 11913 13123 -9% 11913 14811 -20%
PROPERTY CRIMES 07/10/11 TO 06/12/11 TO % 06/12/11 TO 05/15/11 TO % YTD YTD % YTD YTD %
08/06/11 07/09/11 Change 07/09/11 06/11/11 Change 2011 2010 Change 2011 2009 Change
BURGLARY 1248 1255 -1% 1255 1330 -6% 9834 10187 -3% 9834 10813 -9%
GTA 1162 1281 -9% 1281 1317 -3% 9220 10202 -10% 9220 11015 -16%
BTFV 1836 1878 -2% 1878 1976 -5% 15117 17101 -12% 15117 17183 -12%
PERSONAL/OTHER THEFT 1950 2116 -8% 2116 2130 -1% 15870 16255 -2% 15870 16753 -5%
TOTAL PROPERTY 6196 6530 -5% 6530 6753 -3% 50041 53745 -7% 50041 55764 -10%
TOTAL PART I 7781 8142 -4% 8142 8344 -2% 61954 66868 -7% 61954 70575 -12%
Child/Spousal Abuse (Part I & II)* 871 914 -5% 914 852 7% 6721 7461 -10% 6721 7616 -12%
SHOTS FIRED 189 259 -27% 259 245 6% 1717 1852 -7% 1717 1827 -6%
SHOOTING VICTIMS 91 134 -32% 134 115 17% 824 879 -6% 824 796 4%
ARREST STATISTICS for week ending 08/06/11
ARRESTS 07/10/11 TO 06/12/11 TO % 06/12/11 TO 05/15/11 TO % YTD YTD % YTD YTD %
08/06/11 07/09/11 Change 07/09/11 06/11/11 Change 2011 2010 Change 2011 2009 Change
HOMICIDE 28 19 47% 19 26 -27% 167 182 -8% 167 222 -25%
RAPE 13 21 -38% 21 17 24% 136 169 -20% 136 147 -7%
ROBBERY 296 239 24% 239 245 -2% 2025 2238 -10% 2025 2510 -19%
AGGRAVATED ASSAULT** 680 669 2% 669 718 -7% 5226 5569 -6% 5226 6086 -14%
BURGLARY 281 251 12% 251 283 -11% 2033 1897 7% 2033 2074 -2%
LARCENY 634 668 -5% 668 655 2% 5194 6023 -14% 5194 5170 0%
AUTO THEFT 159 170 -6% 170 143 19% 1193 1308 -9% 1193 1319 -10%
TOTAL VIOLENT 1017 948 7% 948 1006 -6% 7554 8158 -7% 7554 8965 -16%
TOTAL PART I 2091 2037 3% 2037 2087 -2% 15974 17386 -8% 15974 17528 -9%
TOTAL ALL ARRESTS 12900 12831 1% 12831 13212 -3% 98236 102057 -4% 98236 111074 -12%
*Part II Child/Spousal Abuse Simple Assaults not included in Part I Aggravated Assaults above to comply with the FBI's Uniform Crime Reporting guidelines.
**Statistics include domestic violence. Population and square miles estimates from Department of City Planning as of October 1, 2008 N.C. - Not Calculable
Statistics are based on the date the crime or arrest occurred.
Prepared by: COMPSTAT Unit Statistics are Preliminary and Subject to Further Analysis and Revision Date: 08/08/11