Colorful Expression Highlight Data
•Download as PPT, PDF•
0 likes•485 views

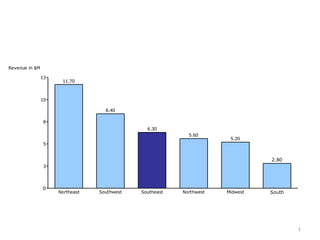
Using color to highlight data in a chart
Report
Share
Report
Share
Recommended
Entrepreneurial Management in a Turnaround Environment
Leadership Initiatives and Innovative Entrepreneurship in a Global Changing Economy
Rassegna Prelios Massimo Caputi- Convegno con Tremonti, Sadun, Luttwak, Fitou...
Massimo Caputi ripercorre Keynes per rilancio Sistema Italia mettendo a confronto Fitoussi, Luttwak, Tremonti, Passera e Taddei.
«C'è un futuro in Italia per i nostri nipoti?». Parafrasando il celebre discorso di Keynes del 1930, Prelios Sgr ripropone il tema, ancora una volta di stretta attualità, in un incontro - esclusivamente su invito - che si terrà giovedì 20 febbraio 2014 a Roma, nella prestigiosa cornice di Palazzo Pallavicini Rospigliosi.
All'invito di Prelios Sgr hanno risposto alcuni esponenti nazionali e internazionali di alto livello, come Jean Paul Fitoussi, Edward Luttwak, Giulio Tremonti, Corrado Passera, Filippo Taddei.
Documentos ada 1
Nacemos para poner en valor el alquiler de vivienda como instrumento para el acceso a una vivfienda digna.
Eurosalotto Nel cuore di un grande divano
Una carellata delle principali tecnologie usate nella costruzione dei divani prodotti da Eurosalotto Padova. www.eurosalotto.com
Amar Infotech -
Amar Infotech is offshore web development company. We are providing web development services in PHP and Open Source. We provide Magento Development services for E-commerce Solutions.
US Covid-19 Deaths in Long-Term Care
For most states, the majority of Covid-19 deaths were in long-term care facilities, as shown in this horizontal bar chart. For the country as a whole, 42% of all Covid-19 deaths were in long-term care facilities. Minnesota's 635 Covid deaths in long-term care were 81% of the state's total Covid deaths. Rhode Island, New Hampshire and Connecticut all had 70% or more of their Covid deaths among long-term care facility occupants. At the other extreme, only 20% of New York's Covid deaths and 24% of Nevada's were long-term care related. Even though New York's percentage was lowest, it had the greatest number of deaths in long-term care at 5,847. Data were compiled by the Kaiser Family Foundation and came from 37 states as of May 21, 2020.
COVID-19 Deaths
Eighty per cent of the 133,359 COVID-19 deaths are concentrated in 7 countries with 20% in the US, as shown in this 100% stacked bar chart. The seven other countries are mostly in Europe--Italy, Spain, France, United Kingdom, and Belgium, with Iran being the other. The 27,886 US COVID-19 deaths are also concentrated. There were 10,834 in New York, which is 39% of the total in the US. New Jersey accounted for 10% (2,805). Two other states, Michigan and Louisiana, had over 1,000 deaths. COVID-19 deaths data were compiled by worldometer on April 15.
COVID-19 Cases by Country
While the most COVID-19 cases to date have been reported in the US, European countries have the highest ratio of cases per capita, as shown in these two horizontal bar charts. Data are from Johns Hopkins Coronavirus COVID-19 Global Cases report and are as of April 9.
CARES Act $2T Stimulus Bill
While individuals receive the largest share of the package, loans to large companies is the largest segment at $425B or 21% of the total, as shown in this Marimekko chart. The bulk of relief to individuals will come in cash payments ($300B) and extra unemployment benefits ($260B). Other large amounts are for new small business loans ($350B) and aid to state and local governments ($340B).
Global Entertainment Market
Home/mobile accounts for most of the growth in the $100B entertainment market, as shown in the top stacked bar chart. Digital has replaced physical distribution for home/mobile viewers, as shown in the bottom chart. Data are from the Motion Picture Association 2019 Theme Report.
Child Malnutrition Worldwide
Malnutrition affects 29% of school age children worldwide, according to UNICEF. In all regions except South Asia, more are overweight and obese than are underweight, as shown in this Marimekko chart.
Vehicle Buyers by Age
Vehicle buyers are older than the typical American and buyers in 2017 are older than buyers in 2007, as shown in these two 100% stacked bar charts. Americans 55 and over make up 38% of the adult population, but 52% of vehicle buyers. While those 34 and under are 30% of the US adult population, but only 14% of vehicle buyers.
This trend is more pronounced now than a decade ago. The largest changes occurred in vehicle buyers 65 and over and those between 35 and 44. The 65 and over segment grew from 13% to 27% of purchasers. The 35-44 segment shrunk from 29% to 14% of purchasers. Data were compiled by Green Car Congress.
Billionaires and Their Wealth
There were 5% fewer billionaires and total billionaire wealth declined 7% from 2017 to 2018, as shown in these stacked bar charts. The decline in the number of billionaires was greatest in Asia, shrinking from 784 to 677 (14%) and their total wealth went from $2.4T to $2.2T (9%). The number of billionaires went from 821 to 792 in Europe (4%) and their wealth went from $2.3T to $2.2T (7%). In North America, the number of billionaires increased from 727 to 750 (3%), but the total wealth of North American billionaires declined 5% from $3.3T to $3.1T. Data are from the WealthX Billionaire Census 2019.
Ask the Expert webinar February 2019
The deck for our February webinar. David Goldstein answers our most common user questions.
A recording of the session can be viewed at https://youtu.be/jSKyqmZ4gTU
Start-Up Funding
Funding of US VC-backed start-ups reached almost $100B in 2018, up from $76B in 2017, as shown in these bar charts. While the number of deals funded fell by 5%, the average deal size increased 37%. Data are from the PwC/CB Insights MoneyTree Report for Q4 2018.
More Related Content
Viewers also liked
Documentos ada 1
Nacemos para poner en valor el alquiler de vivienda como instrumento para el acceso a una vivfienda digna.
Eurosalotto Nel cuore di un grande divano
Una carellata delle principali tecnologie usate nella costruzione dei divani prodotti da Eurosalotto Padova. www.eurosalotto.com
Amar Infotech -
Amar Infotech is offshore web development company. We are providing web development services in PHP and Open Source. We provide Magento Development services for E-commerce Solutions.
Viewers also liked (12)
M2014 s87 why i love the church of christ part 3 11 9-14 sermon
M2014 s87 why i love the church of christ part 3 11 9-14 sermon
More from Mekko Graphics
US Covid-19 Deaths in Long-Term Care
For most states, the majority of Covid-19 deaths were in long-term care facilities, as shown in this horizontal bar chart. For the country as a whole, 42% of all Covid-19 deaths were in long-term care facilities. Minnesota's 635 Covid deaths in long-term care were 81% of the state's total Covid deaths. Rhode Island, New Hampshire and Connecticut all had 70% or more of their Covid deaths among long-term care facility occupants. At the other extreme, only 20% of New York's Covid deaths and 24% of Nevada's were long-term care related. Even though New York's percentage was lowest, it had the greatest number of deaths in long-term care at 5,847. Data were compiled by the Kaiser Family Foundation and came from 37 states as of May 21, 2020.
COVID-19 Deaths
Eighty per cent of the 133,359 COVID-19 deaths are concentrated in 7 countries with 20% in the US, as shown in this 100% stacked bar chart. The seven other countries are mostly in Europe--Italy, Spain, France, United Kingdom, and Belgium, with Iran being the other. The 27,886 US COVID-19 deaths are also concentrated. There were 10,834 in New York, which is 39% of the total in the US. New Jersey accounted for 10% (2,805). Two other states, Michigan and Louisiana, had over 1,000 deaths. COVID-19 deaths data were compiled by worldometer on April 15.
COVID-19 Cases by Country
While the most COVID-19 cases to date have been reported in the US, European countries have the highest ratio of cases per capita, as shown in these two horizontal bar charts. Data are from Johns Hopkins Coronavirus COVID-19 Global Cases report and are as of April 9.
CARES Act $2T Stimulus Bill
While individuals receive the largest share of the package, loans to large companies is the largest segment at $425B or 21% of the total, as shown in this Marimekko chart. The bulk of relief to individuals will come in cash payments ($300B) and extra unemployment benefits ($260B). Other large amounts are for new small business loans ($350B) and aid to state and local governments ($340B).
Global Entertainment Market
Home/mobile accounts for most of the growth in the $100B entertainment market, as shown in the top stacked bar chart. Digital has replaced physical distribution for home/mobile viewers, as shown in the bottom chart. Data are from the Motion Picture Association 2019 Theme Report.
Child Malnutrition Worldwide
Malnutrition affects 29% of school age children worldwide, according to UNICEF. In all regions except South Asia, more are overweight and obese than are underweight, as shown in this Marimekko chart.
Vehicle Buyers by Age
Vehicle buyers are older than the typical American and buyers in 2017 are older than buyers in 2007, as shown in these two 100% stacked bar charts. Americans 55 and over make up 38% of the adult population, but 52% of vehicle buyers. While those 34 and under are 30% of the US adult population, but only 14% of vehicle buyers.
This trend is more pronounced now than a decade ago. The largest changes occurred in vehicle buyers 65 and over and those between 35 and 44. The 65 and over segment grew from 13% to 27% of purchasers. The 35-44 segment shrunk from 29% to 14% of purchasers. Data were compiled by Green Car Congress.
Billionaires and Their Wealth
There were 5% fewer billionaires and total billionaire wealth declined 7% from 2017 to 2018, as shown in these stacked bar charts. The decline in the number of billionaires was greatest in Asia, shrinking from 784 to 677 (14%) and their total wealth went from $2.4T to $2.2T (9%). The number of billionaires went from 821 to 792 in Europe (4%) and their wealth went from $2.3T to $2.2T (7%). In North America, the number of billionaires increased from 727 to 750 (3%), but the total wealth of North American billionaires declined 5% from $3.3T to $3.1T. Data are from the WealthX Billionaire Census 2019.
Ask the Expert webinar February 2019
The deck for our February webinar. David Goldstein answers our most common user questions.
A recording of the session can be viewed at https://youtu.be/jSKyqmZ4gTU
Start-Up Funding
Funding of US VC-backed start-ups reached almost $100B in 2018, up from $76B in 2017, as shown in these bar charts. While the number of deals funded fell by 5%, the average deal size increased 37%. Data are from the PwC/CB Insights MoneyTree Report for Q4 2018.
Profile of America's Homeless
While the 553,000 homeless in the US are more likely to be over 24, male, and on their own, one third of the homeless are members of families with children as shown in this 100% stacked bar chart. Data from the 2018 Annual Homeless Assessment Report to Congress show how the homeless population is broken down by age, race, gender, location and whether or not they were in a shelter.
Ten Worst US Traffic Corridors
The ten worst traffic corridors in the US are shown in this bubble chart. Four are in New York and three in Chicago. The worst is the I-95 corridor in the Bronx, better known as the Cross-Bronx Expressway. The data are supplied by Inrix and the chart can be downloaded in PowerPoint from our website: https://wp.me/p5eN9Y-49Q
Netflix Q1 2018 Results
Member growth and improved international profit margins led to strong Q1 results for Netflix as shown in the cascade and stacked bar charts. Netflix revenue was about evenly split between domestic and international paid members. About 2/3 of profit came from domestic members. Click here to download the chart in PowerPoint to edit using Mekko Graphics: https://wp.me/p5eN9Y-492
Smartphone Sales Growth
Emerging economies had lower priced smartphones and grew between 4 and 10% in units sold in 2017, according to data provided by GfK. Developed economies and China had flat or declining unit sales. The bubble chart maps unit sales growth and cost per unit by region.
Amazon's Record Revenue Quarter
Amazon's revenue grew 34% or $11B in Q3 from 2016 to 2017. Over half came from an increase in sales in North America. Amazon web services (AWS) had the biggest percentage growth. In this cascade chart created using Mekko Graphics, Amazon's Q3 2017 revenue increase from Q3 2016 is broken down by segment.
Mastering Chart Selection
Learn how to choose the right chart based on the message you are trying to convey. See chart examples that address a wide range of business questions.
June 2017 Webinar: Tips and Tricks
This deck was used in our June 2017 webinar to highlight some common tips and time-saving tricks to help you get the most out of Mekko Graphics!
A recorded version of that webinar can be viewed at https://youtu.be/DeT5_qR_pjM
Choosing the Right Chart: Strategies for Effectively Presenting Data
No matter how much effort you’ve put into organizing, validating and analyzing data, if you choose the wrong data representation your insights will be lost on your audience. In this presentation, you’ll see why selecting the right chart is critical, how to match the correct chart to the data you have and the insight you want to present, and how to tweak your charts for maximum impact. I will draw on lessons learned from top strategy consulting and private equity firms.
More from Mekko Graphics (20)
Choosing the Right Chart: Strategies for Effectively Presenting Data
Choosing the Right Chart: Strategies for Effectively Presenting Data
Recently uploaded
一比一原版加拿大渥太华大学毕业证(uottawa毕业证书)如何办理
一模一样【q/微:1954292140】【加拿大渥太华大学毕业证(uottawa毕业证书)成绩单Offer】【q/微:1954292140】(留信学历认证永久存档查询)采用学校原版纸张、特殊工艺完全按照原版一比一制作(包括:隐形水印,阴影底纹,钢印LOGO烫金烫银,LOGO烫金烫银复合重叠,文字图案浮雕,激光镭射,紫外荧光,温感,复印防伪)行业标杆!精益求精,诚心合作,真诚制作!多年品质 ,按需精细制作,24小时接单,全套进口原装设备,十五年致力于帮助留学生解决难题,业务范围有加拿大、英国、澳洲、韩国、美国、新加坡,新西兰等学历材料,包您满意。
【业务选择办理准则】
一、工作未确定,回国需先给父母、亲戚朋友看下文凭的情况,办理一份就读学校的毕业证【q/微:1954292140】文凭即可
二、回国进私企、外企、自己做生意的情况,这些单位是不查询毕业证真伪的,而且国内没有渠道去查询国外文凭的真假,也不需要提供真实教育部认证。鉴于此,办理一份毕业证【q/微:1954292140】即可
三、进国企,银行,事业单位,考公务员等等,这些单位是必需要提供真实教育部认证的,办理教育部认证所需资料众多且烦琐,所有材料您都必须提供原件,我们凭借丰富的经验,快捷的绿色通道帮您快速整合材料,让您少走弯路。
留信网认证的作用:
1:该专业认证可证明留学生真实身份
2:同时对留学生所学专业登记给予评定
3:国家专业人才认证中心颁发入库证书
4:这个认证书并且可以归档倒地方
5:凡事获得留信网入网的信息将会逐步更新到个人身份内,将在公安局网内查询个人身份证信息后,同步读取人才网入库信息
6:个人职称评审加20分
7:个人信誉贷款加10分
8:在国家人才网主办的国家网络招聘大会中纳入资料,供国家高端企业选择人才
→ 【关于价格问题(保证一手价格)
我们所定的价格是非常合理的,而且我们现在做得单子大多数都是代理和回头客户介绍的所以一般现在有新的单子 我给客户的都是第一手的代理价格,因为我想坦诚对待大家 不想跟大家在价格方面浪费时间
对于老客户或者被老客户介绍过来的朋友,我们都会适当给一些优惠。
选择实体注册公司办理,更放心,更安全!我们的承诺:可来公司面谈,可签订合同,会陪同客户一起到教育部认证窗口递交认证材料,客户在教育部官方认证查询网站查询到认证通过结果后付款,不成功不收费!
Recruiting in the Digital Age: A Social Media Masterclass
In this masterclass, presented at the Global HR Summit on 5th June 2024, Luan Wise explored the essential features of social media platforms that support talent acquisition, including LinkedIn, Facebook, Instagram, X (formerly Twitter) and TikTok.
FIA officials brutally tortured innocent and snatched 200 Bitcoins of worth 4...
Farman Ayaz Khattak and Ehtesham Matloob are government officials in CTW Counter terrorism wing Islamabad, in Federal Investigation Agency FIA Headquarters. CTW and FIA kidnapped crypto currency owner from Islamabad and snatched 200 Bitcoins those worth of 4 billion rupees in Pakistan currency. There is not Cryptocurrency Regulations in Pakistan & CTW is official dacoit and stealing digital assets from the innocent crypto holders and making fake cases of terrorism to keep them silent.
ModelingMarketingStrategiesMKS.CollumbiaUniversitypdf
Implicitly or explicitly all competing businesses employ a strategy to select a mix
of marketing resources. Formulating such competitive strategies fundamentally
involves recognizing relationships between elements of the marketing mix (e.g.,
price and product quality), as well as assessing competitive and market conditions
(i.e., industry structure in the language of economics).
Best Forex Brokers Comparison in INDIA 2024
Navigating the world of forex trading can be challenging, especially for beginners. To help you make an informed decision, we have comprehensively compared the best forex brokers in India for 2024. This article, reviewed by Top Forex Brokers Review, will cover featured award winners, the best forex brokers, featured offers, the best copy trading platforms, the best forex brokers for beginners, the best MetaTrader brokers, and recently updated reviews. We will focus on FP Markets, Black Bull, EightCap, IC Markets, and Octa.
The 10 Most Influential Leaders Guiding Corporate Evolution, 2024.pdf
In the recent edition, The 10 Most Influential Leaders Guiding Corporate Evolution, 2024, The Silicon Leaders magazine gladly features Dejan Štancer, President of the Global Chamber of Business Leaders (GCBL), along with other leaders.
Company Valuation webinar series - Tuesday, 4 June 2024
This session provided an update as to the latest valuation data in the UK and then delved into a discussion on the upcoming election and the impacts on valuation. We finished, as always with a Q&A
Hamster Kombat' Telegram Game Surpasses 100 Million Players—Token Release Sch...
Hamster Kombat' Telegram Game Surpasses 100 Million Players—Token Release Schedule Unveiled
Understanding User Needs and Satisfying Them
https://www.productmanagementtoday.com/frs/26903918/understanding-user-needs-and-satisfying-them
We know we want to create products which our customers find to be valuable. Whether we label it as customer-centric or product-led depends on how long we've been doing product management. There are three challenges we face when doing this. The obvious challenge is figuring out what our users need; the non-obvious challenges are in creating a shared understanding of those needs and in sensing if what we're doing is meeting those needs.
In this webinar, we won't focus on the research methods for discovering user-needs. We will focus on synthesis of the needs we discover, communication and alignment tools, and how we operationalize addressing those needs.
Industry expert Scott Sehlhorst will:
• Introduce a taxonomy for user goals with real world examples
• Present the Onion Diagram, a tool for contextualizing task-level goals
• Illustrate how customer journey maps capture activity-level and task-level goals
• Demonstrate the best approach to selection and prioritization of user-goals to address
• Highlight the crucial benchmarks, observable changes, in ensuring fulfillment of customer needs
-- June 2024 is National Volunteer Month --
Check out our June display of books on voluntary organisations
In the Adani-Hindenburg case, what is SEBI investigating.pptx
Adani SEBI investigation revealed that the latter had sought information from five foreign jurisdictions concerning the holdings of the firm’s foreign portfolio investors (FPIs) in relation to the alleged violations of the MPS Regulations. Nevertheless, the economic interest of the twelve FPIs based in tax haven jurisdictions still needs to be determined. The Adani Group firms classed these FPIs as public shareholders. According to Hindenburg, FPIs were used to get around regulatory standards.
Creative Web Design Company in Singapore
At Techbox Square, in Singapore, we're not just creative web designers and developers, we're the driving force behind your brand identity. Contact us today.
Building Your Employer Brand with Social Media
Presented at The Global HR Summit, 6th June 2024
In this keynote, Luan Wise will provide invaluable insights to elevate your employer brand on social media platforms including LinkedIn, Facebook, Instagram, X (formerly Twitter) and TikTok. You'll learn how compelling content can authentically showcase your company culture, values, and employee experiences to support your talent acquisition and retention objectives. Additionally, you'll understand the power of employee advocacy to amplify reach and engagement – helping to position your organization as an employer of choice in today's competitive talent landscape.
Anny Serafina Love - Letter of Recommendation by Kellen Harkins, MS.
This letter, written by Kellen Harkins, Course Director at Full Sail University, commends Anny Love's exemplary performance in the Video Sharing Platforms class. It highlights her dedication, willingness to challenge herself, and exceptional skills in production, editing, and marketing across various video platforms like YouTube, TikTok, and Instagram.
Recently uploaded (20)
Training my puppy and implementation in this story
Training my puppy and implementation in this story
The Influence of Marketing Strategy and Market Competition on Business Perfor...
The Influence of Marketing Strategy and Market Competition on Business Perfor...
Recruiting in the Digital Age: A Social Media Masterclass
Recruiting in the Digital Age: A Social Media Masterclass
FIA officials brutally tortured innocent and snatched 200 Bitcoins of worth 4...
FIA officials brutally tortured innocent and snatched 200 Bitcoins of worth 4...
ModelingMarketingStrategiesMKS.CollumbiaUniversitypdf
ModelingMarketingStrategiesMKS.CollumbiaUniversitypdf
The 10 Most Influential Leaders Guiding Corporate Evolution, 2024.pdf
The 10 Most Influential Leaders Guiding Corporate Evolution, 2024.pdf
Company Valuation webinar series - Tuesday, 4 June 2024
Company Valuation webinar series - Tuesday, 4 June 2024
Hamster Kombat' Telegram Game Surpasses 100 Million Players—Token Release Sch...
Hamster Kombat' Telegram Game Surpasses 100 Million Players—Token Release Sch...
In the Adani-Hindenburg case, what is SEBI investigating.pptx
In the Adani-Hindenburg case, what is SEBI investigating.pptx
Anny Serafina Love - Letter of Recommendation by Kellen Harkins, MS.
Anny Serafina Love - Letter of Recommendation by Kellen Harkins, MS.