Download as PDF, PPTX

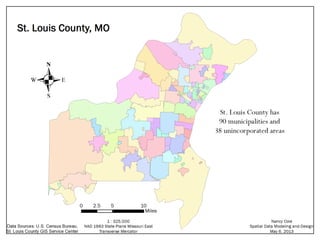


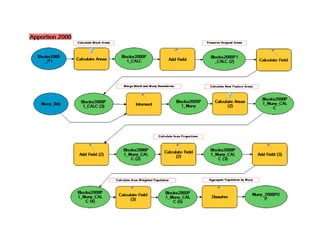


The document discusses population changes in St. Louis County, Missouri, highlighting numerical data from 1950 to 2010 for both the city and county. It notes specific municipalities that have experienced population loss and declines in median household income between 2000 and 2010. Additionally, it addresses the methodology and limitations involved in the population data analysis, including issues with municipal boundary geometry.


