SlideShare a Scribd company logo
1 of 48
Download to read offline
www.cannabissciencetech.com
april 2021 | vol 4 ●
no 3
Temperature
Comparison
of 3M Rapid Yeast and
Mold Petrifilm Utilizing
Manufacturers Suggested
Temperatures on Dried
Cannabis Flower
ANALYTICAL
Breaking Down Liquid
Chromatography
Method Development
in this issue
CULTIVATION
The Environmental Implications
of Energy Consumption
in Cannabis Cultivation
EXTRACTION
The Evolution of
Ethanol Extraction
Methods in Cannabis
PROCESSING/
MANUFACTURING
Why Aren’t Buffers Used
with Cannabis Extractions?
RESEARCH
NIST Helps Cannabis
Laboratories Achieve
High-Quality Measurements
INDUSTRY TRENDS
Even Dispensaries Need
In-House Testing
Flavonoids are found in many colorful fruits, leafy greens,
vegetables, and citrus. They are generally associated with
the defense system of the plant and protect the plant from
hungry herbivores and disease. There are over 5,000
various forms of flavonoids identified throughout the world
which are generally found in the leaves, roots, and stems.
In cannabis, the highest concentrations are present in the
leaves, stems, and pollen.
1
There are approximately twenty
flavonoid compounds found in cannabis including two that
are wholly unique to the plant, cannflavin A, and cannflavin
B. The flavonoids exhibiting the highest concentration in
cannabis include kaempferol, quercetin, apigenin, luteolin,
vitexin, isovitexin, and orientin. Cannabis research involving
flavonoids has indicated activation of both CB1 and CB2
receptors2
in addition to playing a role in the THC metabolism
pathway. These discoveries indicate that flavonoids
competitively bind to both the CB1 and CB2 receptors3
and provide a more therapeutic experience. Adding to
the entourage effect is not the only positive attribute of
flavonoids. They also contribute a wide range of overall health
benefits including anti-cancer, anti-aging, DNA repair, and
anti-inflammatory4
qualities just to name a few.
As consumers of cannabis become more aware of
the full capacity of the plant, analysis of the entourage
compounds associated with the various strains should
become commonplace. In an effort to provide the end
user with a more complete experience, Hamilton Company
has developed a method to confirm the 7 most common
flavonoids found in cannabis utilizing the PRP-1 5 µm HPLC
column. The polymeric stationary phase used in the PRP-1
column yield good peak shape while adding value to the
identification. Sample preparation is kept to a minimum with
only a 15 minute sonication extraction using ethanol:water
3:1. After centrifugation, the sample is injected. There is no
need to filter the sample, allowing faster analysis with the
dilute and shoot sampling protocol while still maintaining
consistent results. This method utilizes tetrahydrofuran
and formic acid as mobile phases and provides baseline
separation for all the components in under twelve minutes.
1 ) Flores-Sanchez, I; Verpoorte, R. Phytochem Rev (2008) 7:615–639.
2 ) Barrett, M; Scutt, A; Evans, F. Experientia. (1986) 15;42(4):452-3.
3 ) Pollastro, F; Minassi, A; Luigia-Grazia, F. Curr Med Chem . 2018;25(10):1160-1185.
4 ) Seelinger G, Merfort I, Schempp CM. Planta Med. 2008 74(14):1667-77.
Column Information
Packing Material PRP-1, 5 µm
P/N 79444
Chromatographic Conditions
Gradient
0.0 – 1.0 min 5% B
1.0 – 1.5 min 5 – 30% B
1.5 – 8.0 min 30% B
8.0 – 13.0 min 30 – 65% B
Temperature 35 °C
Injection Volume 5 µL
Detection UV at 360 nm
Dimensions 150 x 4.1 mm
Eluent A 10 mM Formic Acid
Eluent B Tetrahydrofuran
Flow Rate 1.0 mL/min.
Compounds: 1. Isovitexin 2. Orientin 3. Vitexin
4. Luteolin 5. Apigenin 6. Quercetin 7. Kaempferol
0 2
1
2
4
3 5
6 7
4 6 8 10 12 14
0 2
1
2
4 5 6 7
4 6 8 10 12 14
Hemp Extract
Author: Adam L. Moore, PhD
Cannabinoid’s Wingman?
Determination of Flavonoids in Hemp by Reversed-Phase HPLC
©2020 Hamilton Company. All rights reserved.
All other trademarks are owned and/or registered by Hamilton Company in the U.S. and/or other countries.
Lit. No. L80114 — 10/2020
For more information on Hamilton HPLC columns
and accessories or to order a product, please visit
www.hamiltoncompany.com or call (800) 648-5950
in the US or +40-356-635-055 in Europe.
cannabis science and technology®  
|  
vol. 4 no. 3 cannabissciencetech.com
4
4 8 5 F U S Hi g h w a y O n e S o u t h , S ui t e 2 1 0 | I s e l in , NJ 0 8 8 3 0 | 7 3 2 . 5 9 6 . 0 2 76 | Fa x : 7 3 2 . 6 47.1 2 3 5
Michael J. Tessalone
Senior Vice President,
Industry Sciences
MTessalone@
mjhlifesciences.com
Stephanie Shaffer
Group Publisher
SShaffer@mjhlifesciences.com
Mark Davis
Director of Sales
MDavis@mjhlifesciences.com
David Gordon
Senior Account Manager
DGordon@mjhlifesciences.com
Edward Fantuzzi
Sales Director
EFantuzzi@mjhlifesciences.com
Brianne Molnar
Sales Manager
BMolnar@mjhlifesciences.com
Oliver Waters
Sales Manager
OWaters@mjhlifesciences.com
Liz McLean
Sales Executive
LMcLean@mjhlifesciences.com
Michael Kushner
Senior Director, Digital Media
MKushner@mjhlifesciences.com
Kristen Moore
Webcast Operations Manager
KMoore@mjhlifesciences.com
Vania Oliveira
Project Manager
VOliveira@mjhlifesciences.com
Sabina Advani
Digital Production Manager
SAdvani@mjhlifesciences.com
Kaylynn Chiarello-Ebner
Managing Editor,
Special Projects
KEbner@mjhlifesciences.com
Melissa Stillwell
C.A.S.T. Data and
List Information
MStillwell@mjhlifesciences.com
Alexa Rockenstein
Permissions
ARockenstein@
mjhlifesciences.com
Megan L’Heureux
Group Editorial Director
MLheureux@mjhlifesciences.com
Madeline Colli
Associate Editor
MColli@mjhlifesciences.com
Alissa Marrapodi
Custom Content Writer
AMarrapodi@
mjhlifesciences.com
Josh Crossney
Contributing Editor
josh@jcanna.com
Brianne Pangaro
Marketing Associate
BPangaro@mjhlifesciences.com
Ariana Mexquititla
Graphic Designer
Gwendolyn Salas
Senior Art Director
Melissa Feinen
Creative Director, Publishing
corporate
Chairman & Founder
Mike Hennessy, Sr
Vice Chairman
Jack Lepping
President & CEO
Mike Hennessy, Jr
Chief Financial Officer
Neil Glasser, CPA/CFE
Chief Marketing Officer
Michael Baer
Executive Vice President,
Global Medical Affairs &
Corporate Development
Joe Petroziello
Senior Vice President,
Content
Silas Inman
Senior Vice President
Operations
Michael Ball
Senior Vice President, I.T.
& Enterprise Systems
John Moricone
Vice President, Human
Resources & Administration
Shari Lundenberg
Vice President, Mergers
& Acquisitions
Chris Hennessy
Executive Creative Director,
Creative Services
Jeff Brown
MANUSCRIPTS: To discuss possible article topics or obtain man-
uscript preparation guidelines, contact the editor-in-chief at:
(732) 346-3051, e-mail: MLheureux@mjhlifesciences.com. Cannabis
Science and Technology welcomes unsolicited articles, manuscripts,
photographs, illustrations, and other materials but cannot be held
responsible for their safekeeping or return. Every precaution is taken
to ensure accuracy, but Cannabis Science and Technology cannot
accept responsibility for the accuracy of information supplied herein
or for any opinion expressed.
SUBSCRIPTIONS: For subscription and circulation information:
Cannabis Science and Technology, PO Box 457, Cranbury, NJ
08512-0457, or e-mail mmhinfo@mmhgroup.com. Delivery of
Cannabis Science and Technology outside the United States is
14 days after printing.
CHANGE OF ADDRESS: Send change of address to Cannabis Science
and Technology, PO Box 457, Cranbury, NJ 08512-0457; alternately, send
change via e-mail to fulfill@mjhassoc.com or go to the following URL:
http://mmhpubs.mmhgroup.com/Welcome.aspx?pubid=CNST
Allow four to six weeks for change.
Cannabis Science and Technology (Print ISSN: 2643-8844, Digital
ISSN: 2643-8852) is published 9 times/year by MultiMedia
Healthcare LLC, 2 Clarke Drive, Suite 100, Cranbury, NJ 08512.
POSTMASTER: Please send address changes to CANNABIS
Science and Technology, PO Box 457, Cranbury, NJ 08512-0457.
Return Undeliverable Canadian Addresses to: IMEX Global
Solutions, P. O. Box 25542, London, ON N6C 6B2, CANADA.
Canadian G.S.T. number: R-124213133RT001. Printed in the U.S.A.
C.A.S.T. DATA AND LIST INFORMATION: Contact Melissa Stillwell,
tel. (218) 740-6831, e-mail MStillwell@mjhlifesciences.com.
REPRINTS: Reprints of all articles in this issue and past issues of
this publication are available (500 minimum). Licensing and Reuse of
Content: Contact Stephanie Shaffer about available usages, license fees,
and artwork at SShaffer@mjhlifesciences.com for more information.
INTERNATIONAL LICENSING: Contact Alexa Rockenstein,
e-mail ARockenstein@mjhlifesciences.com.
© 2020 MultiMedia Pharma Sciences LLC All rights reserved. No part of this
publication may be reproduced or transmitted in any form or by any means,
electronic or mechanical including by photocopy, recording, or information
storage and retrieval without permission in writing from the publisher. Author-
ization to photocopy items for internal/educational or personal use, or the in-
ternal/educational or personal use of specific clients is granted by MultiMedia
Pharma Sciences LLC for libraries and other users registered with the Copy-
right Clearance Center, 222 Rosewood Dr. Danvers, MA 01923, 978-750-8400 fax
978-646-8700 or visit http://www.copyright.com online. For uses beyond
those listed above, please direct your written request to Permission Dept.
e-mail: ARockenstein@mjhlifesciences.com
MultiMedia Pharma Sciences LLC provides certain customer contact data
(such as customer’s name, addresses, phone numbers, and e-mail addresses)
to third parties who wish to promote relevant products, services, and other
opportunities that may be of interest to you. If you do not want MultiMedia
Pharma Sciences LLC to make your contact information available to third par-
ties for marketing purposes, simply e-mail mmhinfo@mmhgroup.com and a
customer service representative will assist you in removing your name from
MultiMedia Pharma Sciences LLC lists.
Cannabis Science and Technology does not verify any claims or other informa-
tion ­
appearing in any of the advertisements contained in the publication, and
cannot take responsibility for any losses or other damages incurred by readers
in reliance of such content.
To subscribe, e-mail mmhinfo@mmhgroup.com.
5
0
%
Recycled Pa
p
e
r
1
0
-
2
0
%
Post Consume
r
W
a
s
t
e
N
A
T
I
O
N
A
L
C
A
NNABIS INDUSTRY
A
S
S
O
C
I
A
T
I
O
N
MEMBER
MANUSCRIPTS: To discuss possible article topics or obtain man-
uscript preparation guidelines, contact the editor-in-chief at:
(732) 346-3051, e-mail: MLheureux@mjhlifesciences.com. Cannabis
Science and Technology welcomes unsolicited articles, manuscripts,
photographs, illustrations, and other materials but cannot be held
responsible for their safekeeping or return. Every precaution is taken
to ensure accuracy, but Cannabis Science and Technology cannot
accept responsibility for the accuracy of information supplied herein
or for any opinion expressed.
SUBSCRIPTIONS: For subscription and circulation information:
Cannabis Science and Technology, PO Box 457, Cranbury, NJ
08512-0457, or e-mail mmhinfo@mmhgroup.com. Delivery of
Cannabis Science and Technology outside the United States is
14 days after printing.
CHANGE OF ADDRESS: Send change of address to Cannabis Science
and Technology, PO Box 457, Cranbury, NJ 08512-0457; alternately, send
change via e-mail to fulfill@mjhassoc.com or go to the following URL:
http://mmhpubs.mmhgroup.com/Welcome.aspx?pubid=CNST
Allow four to six weeks for change.
Cannabis Science and Technology (Print ISSN: 2643-8844, Digital
ISSN: 2643-8852) is published 9 times/year by MultiMedia
Healthcare LLC, 2 Clarke Drive, Suite 100, Cranbury, NJ 08512.
POSTMASTER: Please send address changes to CANNABIS
Science and Technology, PO Box 457, Cranbury, NJ 08512-0457.
Return Undeliverable Canadian Addresses to: IMEX Global
Solutions, P. O. Box 25542, London, ON N6C 6B2, CANADA.
Canadian G.S.T. number: R-124213133RT001. Printed in the U.S.A.
C.A.S.T. DATA AND LIST INFORMATION: Contact Melissa Stillwell,
tel. (218) 740-6831, e-mail MStillwell@mjhlifesciences.com.
REPRINTS: Reprints of all articles in this issue and past issues of
this publication are available (500 minimum). Licensing and Reuse of
Content: Contact Stephanie Shaffer about available usages, license fees,
and artwork at SShaffer@mjhlifesciences.com for more information.
INTERNATIONAL LICENSING: Contact Alexa Rockenstein,
e-mail ARockenstein@mjhlifesciences.com.
© 2020 MultiMedia Pharma Sciences LLC All rights reserved. No part of this
publication may be reproduced or transmitted in any form or by any means,
electronic or mechanical including by photocopy, recording, or information
storage and retrieval without permission in writing from the publisher. Author-
ization to photocopy items for internal/educational or personal use, or the in-
ternal/educational or personal use of specific clients is granted by MultiMedia
Pharma Sciences LLC for libraries and other users registered with the Copy-
right Clearance Center, 222 Rosewood Dr. Danvers, MA 01923, 978-750-8400 fax
978-646-8700 or visit http://www.copyright.com online. For uses beyond
those listed above, please direct your written request to Permission Dept.
e-mail: ARockenstein@mjhlifesciences.com
MultiMedia Pharma Sciences LLC provides certain customer contact data
(such as customer’s name, addresses, phone numbers, and e-mail addresses)
to third parties who wish to promote relevant products, services, and other
opportunities that may be of interest to you. If you do not want MultiMedia
Pharma Sciences LLC to make your contact information available to third par-
ties for marketing purposes, simply e-mail mmhinfo@mmhgroup.com and a
customer service representative will assist you in removing your name from
MultiMedia Pharma Sciences LLC lists.
Cannabis Science and Technology does not verify any claims or other informa-
tion ­
appearing in any of the advertisements contained in the publication, and
cannot take responsibility for any losses or other damages incurred by readers
in reliance of such content.
To subscribe, e-mail mmhinfo@mmhgroup.com.
5
0
%
Recycled Pa
p
e
r
1
0
-
2
0
%
Post Consume
r
W
a
s
t
e
N
A
T
I
O
N
A
L
C
A
NNABIS INDUSTRY
A
S
S
O
C
I
A
T
I
O
N
MEMBER
5
cannabissciencetech.com april 2021  
|  
cannabis science and technology®
editorial advisory
board members c a n n a b i s s c i e n ce a n d te c h n o lo g y ®
april 2021 | vol 4 • no 3
Cannabis Science and Technology®
’s Editorial Advisory Board is a group of distinguished individuals assembled to help the
publication fulfill its editorial mission to educate the legal cannabis industry about the science and technology of analytical
testing and quality control. With recognized expertise in a wide range of areas, board members perform various functions, such as
suggesting authors and topics for coverage, reviewing manuscripts, and providing the editor with general direction and feedback.
We are indebted to these individuals for their contributions to the publication and to the cannabis community as a whole.
SUSAN AUDINO
S.A.Audino & Associates, LLC
BOB CLIFFORD
Shimadzu Scientific
Instruments
DOUGLAS DUNCAN
CannaSafe
ASHLEE GERARDI
Restek Corporation
JACKLYN GREEN
Agate Biosciences
JACK HENION
Henion Enterprises
ZAC HILDENBRAND
Inform Environmental, LLC
KARAN KAPOOR
KapoorAg Consulting Inc.
AUTUMN KARCEY
Cultivo, Inc.
BENJAMIN A.
KATCHMAN
PathogenDx Inc.
JULIE KOWALSKI
JA Kowalski Science
Support LLC
ALLEGRA LEGHISSA
Shimadzu France
WILLIAM LEVINE
CannRx Technology Inc.
ANTHONY MACHERONE
Agilent Technologies,
Johns Hopkins University
School of Medicine
SANDY MANGAN
SPEX SamplePrep LLC
DAVID (DEDI) MEIRI
Laboratory of Cancer
Biology and Cannabinoid
Research, Technion Israel
Institute of Technology
DAVID L. NATHAN, MD,
DFAPA
Princeton Psychiatry
& Consulting, LLC
RICHARD SAMS
KCA Laboratories
KEVIN SCHUG
Department of Chemistry &
Biochemistry, The University
of Texas at Arlington
BRIAN SMITH
Big Sur Scientific
KATHERINE STENERSON
MilliporeSigma
cannabis science and technology®  
|  
vol. 4 no. 3 cannabissciencetech.com
6
contents
c a n n a b i s s c i e n ce a n d te c h n o lo g y ®
| april 2021 | 
vol 4 • no 3
■ 
CANNABIS ANALYSIS
10 
Why Dispensaries
Need In-House Testing
BRIAN C. SMITH
Mislabeled cannabis medicines are an on-going
problem; here we discuss appropriate technologies
for cannabis dispensaries to do their own testing.
■ 
EXTRACTION SCIENCE
13 The Evolution of Ethanol
Extraction Methods in Cannabis
LO FRIESEN
A review of the evolution of the ethanol extraction
method within the cannabis industry, where it
stands today, and the other alcohols that are being
introduced to the cannabis extraction space.
■ NAVIGATING THE LABYRINTH:
CHALLENGES IN THE CANNABIS LABORATORY
17 
Looking with Light: Breaking
Down Liquid Chromatography
Method Development
PATRICIA L. ATKINS
A deeper look into the chemistry, physics,
and methodology of HPLC methods.
■ CANNABIS CROSSROADS
29 Is This Cannabis or Hemp—NIST
Helps Cannabis Laboratories
Achieve High-Quality
Measurements
JOSHUA CROSSNEY
Dr. Walter Wilson discusses NIST's focus on
developing cannabis reference materials and
a quality assurance program (CannaQAP).
■ PEER-REVIEWED ARTICLE
32 
Temperature Comparison
of 3M Rapid Yeast and Mold
Petrifilm Utilizing Manufacturer’s
Suggested Temperatures
on Dried Cannabis Flower
(Cannabis spp.)
ANTHONY J. REPAY
In this study, dried cannabis flower found to have
yeast and mold during compliance screening
were randomly chosen to be plated at two
different incubation temperatures to compare
total amount of yeast and mold growth.
DEPARTMENTS
05 
Editorial Advisory
Board
08 Cannabis News Focus
45 Product Spotlight
features
36 The Environmental Implications
of Energy Consumption in
Cannabis Cultivation
ZACARIAH HILDENBRAND AND ROBERT MANES
What are the environmental implications of energy consumption
for outdoor, indoor, and greenhouse cultivation? ?
40 The Fields of Science and
Technology Would Not Exist Without
the Use of Buffers—Why Aren’t They
Used with Cannabis Extractions?
DANIEL MAIDA HAYDEN
Here, we take a closer look at buffers to see what solutions they might offer.
44 Gaining Deep Knowledge About
Cannabis Cultivation: How and Why
MIA VOLKOVA
A review of the changing attitude and knowledge gap in cannabis
cultivation and more.
32
on the
cover:
roxxyphotos /
adobestock.com
©2019 Hamilton Company. All rights reserved. All other trademarks are owned
and/or registered by Hamilton Company in the U.S. and/or other countries.
Lit. No. L80098 — 08/2019
Hamilton Americas  Pacific Rim
Hamilton Company Inc.
4970 Energy Way
Reno, Nevada 89502 USA
Tel: +1-775-858-3000
Fax: +1-775-856-7259
sales@hamiltoncompany.com
Hamilton Europe, Asia  Africa
Hamilton Central Europe S.R.L.
str. Hamilton no. 2-4
307210 Giarmata, Romania
Tel: +40-356-635-055
Fax: +40-356-635-060
contact.lab.ro@hamilton-ce.com
To find a representative in your area, please visit hamiltoncompany.com/contacts.
Web: www.hamiltoncompany.com
USA: 800-648-5950
Europe: +40-356-635-055
With the recent legalization of both medicinal and recreational marijuana in the United States, analysis
of individual cannabinoids has captured the public’s interest at a new level. As such, many new cannabis
products are now available, i.e., edibles, vaporizers, and extracts to name a few. The increased marketability
of the product has incited consumers to take a greater interest in the quality and craft ability of the products
being sold. Through the quantification of individual cannabinoids, the consumer can make an informed
decision about the possible effects they could expect from the products they purchase. Therefore, the
need for accurate, robust, and affordable analysis tools are of the upmost importance.
With health, safety, and edibles dosing as the primary motivation, Hamilton Company developed
an HPLC method that isolates eight major cannabinoids. The HxSil C18 (3 µm) column provides
an accurate, cost effective, and robust solution that can be used in any HPLC system.
Column Information
Packing Material HxSil, 3 µm
Part Number 79641
Chromatographic Conditions
Gradient
0–10 min, 78–92% B
10–15 min, 78% B
Temperature Ambient
Injection Volume 5 μL
Detection UV at 230
Dimensions 150 x 4.6 mm
Eluent A 20 mM NH4
COOH pH 3.5
Eluent B Acetonitrile
Flow Rate 1.0 mL/min
Author: Adam L. Moore, PhD, Hamilton Company
Compounds:
1: Cannabidivarin (CBDV)
2: Cannabidiol (CBD)
3: Cannabidiolic Acid (CBDA)
4: Cannabigerolic Acid (CBGA)
Separation of Eight Cannabinoids
5: Cannabigerol (CBG)
6: Cannabinol (CBN)
7: ∆-9-Tetrahydrocannabinol (∆-9-THC)
8: ∆-9-Tetrahydrocannabinolic Acid
(∆-9-THCA)
Time (minutes)
1
2
3
4
6
5
2
7 8
3 4 5 6 7 8 9
0
10
20
30
40
mAU
Separation of Eight Cannabinoids
cannabis science and technology®  
|  
vol. 4 no. 3 cannabissciencetech.com
8
cannabis news focus
Groundbreaking COVID-19 Study
Shows CBD May Help Inhibit Infection
Madeline Colli
RESEARCHERSINTHEUSrecentlyconductedastudywhichdisclosed
that a cannabis plant compound inhibited infection with severe
acute respiratory syndrome coronavirus 2 (SARS-CoV-2) in human
lung cells. SARS-CoV-2 is the virus that causes COVID-19, threaten-
ing global health and world economies (1,2). Marsha Rosner, PhD, and
other colleagues from the University of Chicago (Chicago, Illinois) dis-
covered that cannabidiol (CBD) and its metabolite 7-OH-CBD potently
blocked SARS-CoV-2 replication in lung epithelial cells (3).
Through the combination of CBD and 7-OH-CBD, the expression
of certain genes within the viral cells were inhibited and changes in
gene expression within the lung cells that resulted from the pres-
ence of COVID-19 were reversed (4). Thus, CBD and 7-OH-CBD serve in
both protective and therapeutic roles. CBD was also found to have
the ability to block viral ribonucleic acid (RNA), including the cod-
ing for the spike protein, which is the tool the virus uses to enter our
cells. “This study highlights CBD, and its active metabolite, 7-OH-CBD,
as potential preventative agents and therapeutic treatments for
SARS-CoV-2 at early stages of infection,” said Rosner and the team (1).
Even with recently approved vaccines being rolled out in many
countries, the virus continues to spread rapidly, heightened by more
transmissible variants, such as the B.1.1.7 variant. Rosner and her col-
leagues say that this highlights the need for alternative approaches,
especially among populations with limited access to vaccines. Few
therapies to date have been identified as being able to block SARS-
CoV-2 replication and viral reproduction.
Primarily, the SARS-CoV-2 virus enters host cells through the bind-
ing of a surface viral protein—called spike protein—to the human
host cell receptor angiotensin-converting enzyme 2 (ACE2). From
there, the viral genome is then translated into two large polypep-
tides that are severed by the viral proteases main protease (MPro)
and papain-like protease (PLPro) to produce the proteins necessary
for viral replication, assembly, and budding (1).
To analyze the effect of CBD on SARS-CoV-2 replication, the re-
searchers pretreated A549 human lung carcinoma cells express-
ing ACE-2 (A549-ACE2) with 0-10 μM CBD for 2 hours before infect-
ing them with SARS-CoV-2. Evaluation of the cells 48 hours later
expressed CBD had potently inhibited viral replication in the cells.
When CBD was assessed to possibly prevent proteolytic cleavage
by MPro and PLPro, it was observed that CBD had no effect on the
activity of either protease. This revelation led the team to hypoth-
esize that CBD targets host cell processes. Consistent with their
hypothesis, RNA sequencing of infected A549-ACE2 cells treat-
ed with CBD for 24 hours showed significant suppression of SARS-
CoV-2-induced changes in gene expression. CBD was shown to have
Richard Sams, PhD, Joins Cannabis
Science and Technology®’s EAB
Madeline Colli
CANNABIS SCIENCE AND TECHNOLOGY® is pleased to
announce the addition of Richard Sams to its editorial
advisory board (EAB).
Dr. Richard Sams earned his Bachelor of Science degree in
pharmacy and a Doctor of Philosophy degree in pharmaceu-
tics from Ohio State University. After his time working as a
research scientist at Ciba-Geigy Pharmaceuticals in Suffern,
New York, he served as a faculty member in the Colleges of
Veterinary Medicine and Pharmacy at OSU. There, he special-
ized in veterinary pharmacology and directed the testing and
research activities of the Analytical Toxicology Laboratory,
which is the official testing laboratory of the Ohio State Rac-
ing Commission. In 2001, Sams became a scientific consult-
ant to the Racing Medication and Testing Consortium and be-
came a member of its Scientific Advisory Committee.
From 2006–2010 Sams served as a professor in the Col-
lege of Veterinary Medicine at the University of Florida
where he was responsible for teaching veterinary clinical
pharmacology and directing the Florida Racing Laborato-
ry, the official testing laboratory of the Florida Department
of Business Regulation Division of Racing. After his time at
the University of Florida, Sams became the director of the
HFL Sport Science Laboratory in Lexington, Kentucky. This
laboratory was the official testing laboratory for the Ken-
tucky Horse Racing Commission, the Indiana Racing Com-
mission, the Maine Harness Racing Commission, the Vir-
ginia Racing Commission, the Puerto Rico Racing Authority,
the Delaware Thoroughbred Racing Commission, and the
Trinidad  Tobago Racing Authority. Since 2019, Sams has
held the role of the scientific director of KCA Laborato-
ries, a cannabis testing and research laboratory located in
Nicholasville, Kentucky.
Currently, Sams is serving on the Scientific Advisory
Committee to the Association of Racing Commissioners In-
ternational, Inc. In addition, he has authored more than
130 peer-reviewed scientific studies. Frequently, he is re-
quested to consult on cannabis-related matters and the
disposition of drugs and other substances in animals.
SCAN THE QR CODE
for a complete list of the
Cannabis Science and Technology®
Editorial Advisory Board members.
cannabis news focus
effectively eliminated viral RNA expres-
sion, which included RNA coding for the
spike protein. It was also found that
both SARS-CoV-2 and CBD triggered sig-
nificant changes in cellular gene expres-
sion, such as the expression of several
transcription factors. Further analysis
of host cell RNA expressed that the vi-
rus-induced changes were almost com-
pletely reversed, though rather than the
cells returning to a normal cell state, the
CBD plus virus-infected cells resembled
those treated with CBD alone.
Another critical finding researchers
discovered was that CBD had “effective-
ly reversed” the triggering of a hyperin-
flammatory response, also known as a
“cytokine storm” which is brought on by
the presence of the virus, restoring cells
not to a previral level of inflation, but a
state as if the cells had been treated with
only CBD. A study completed near the end
of 2020 by the Dental College of Georgia
(DCG) (Augusta, Georgia) and the Medical
College of Georgia (Augusta, Georgia) also
had similar findings to the team from the
University of Chicago (5). Cytokine storms
have been one of the principal causes of
death resulting from a COVID-19 infection.
CBD was identified in reducing damage
in the lungs spurred by cytokine storms
caused from COVID-19 by normalizing lev-
els of apelin, a peptide known to reduce
inflammation, decreasing physical lung
damage associated with adult respiratory
distress syndrome (ARDS), and improving
oxygen levels. During a COVID-19 infection,
these apelin levels were seen to be at
very low levels. Rosner and her team stat-
ed that “CBD has the potential not only to
act as an antiviral agent at early stages
of infection but also to protect the host
against an overactive immune system at
later stages,” (1).
During the University of Chicago’s study,
a range if other cannabinoids were also
tested, but by the end of the trial, CBD
was the only cannabinoid found to have
any effect at all on COVID-19-infected cells.
Limited-to-no antiviral activity was exhib-
ited by the other cannabinoids investi-
gated. CBD is often consumed as part of a
Cannabis Sativa extract, which is also what
led the team to consider investigating oth-
er cannabinoids with closely related struc-
tures to see if they would reveal similar or
stronger results. The team hopes that CBD
will continue to be investigated as a po-
tential COVID-19 treatment following the
research from their article about the study,
which is currently under peer-review. “We
advocate carefully designed placebo-con-
trolled clinical trials with known concen-
trations and highly-characterized for-
mulations in order to define CBD’s role in
preventing and treating early SARS-CoV-2
infection,” the authors stated (4).
SCAN THE QR CODE
for a full list of
references cited
in this piece.
cannabis science and technology®  
|  
vol. 4 no. 3 cannabissciencetech.com
10
cannabis analysis
Why Dispensaries Need
In-House Testing
By Brian C. Smith
T
hinkaboutyourlasttriptoaphar-
macy.Whatdidyousee?Everything
imaginableonsalefromaspirin
togroceriestoofficesuppliesper-
haps.Andwhatdidyouseebehindthecoun-
terasyouwerewaitingtogetyourprescrip-
tionfilled?Probablyrowsofshelveswith
bottlesofpillsinthem,andpharmacistsand
theirassistantscladinnicewhitelaborato-
rycoats,lookingforalltheworldlikeanalyt-
icalchemists.Butwhatwasmissingbehind
thatcounter?Thefumehoods,chromato-
graphs,andspectrometersyouwouldnor-
mallyseeinananalyticalchemistrylabora-
tory.Whyisthis?BecausethankstotheUS
FoodandDrugAdministration(FDA)every
bottlebehindthatpharmacycountercon-
tainsaknownamountofactivepharmaceu-
ticalingredients,alistofinactiveingredients
(excipients),andanexpirationdate.
For example, a bottle of pain reliever I
bought recently from my local pharmacy
clearly states each tablet contains 200 mg
ibuprofen, and there is a list of inactive in-
gredients in descending order of concentra-
tion. The label also says, “Store at 20 °C to
25 °C . . . avoid excessive heat above 40 °C.”
The label also has a batch number on it, in-
structions for use, warnings, indications,
contra-indications, and a sell by date.
How do we know what is in each tab-
let? How do we know the best storage
conditions? How was the sell by date de-
termined? Because the FDA compels
pharmaceutical companies to perform in-
house testing to make sure every bottle
produced contains what is advertised. Ad-
ditionally, each label will have a clear sell by
date on it because chemistry tells us medi-
cines degrade over time, and again thanks
to the FDA stability studies were per-
formed so we know how long it is safe take
a specific medicine.
Contrast this with your last trip to your
local cannabis dispensary, assuming they
are legal where you live and you actually vis-
it them. The lack of analytical equipment
is similar to a normal pharmacy, but that
is where the similarity ends. Pick up a can-
nabidiol (CBD) tincture bottle. It may list a
few ingredients such as CBD extract, medi-
um chain triglycerides (MCT) oil, and “fla-
voring” but that is probably it. A list of excip-
ients is typically not there, nor should you
expect to see a sell by date.
Cannabis medicines contain more than
CBD and tetrahydrocannabinol (THC), they
contain other cannabinoids, terpenes, and
who knows what else. An extractor may for-
mulate their tinctures with a distillate that
is 90% cannabinoids, but what is in that oth-
er 10%? Fats? Waxes? Chlorophyll? Pesti-
cides and heavy metals? Is any of what is in
that 10% harmful to human health? We have
no idea since there is little scientific work on
the analysis of the noncannabinoid compo-
nents of cannabis extracts and distillates.
This means we are formulating cannabis
medicines with poorly characterized ingre-
dients, putting our patient’s health at risk.
The Dose Makes the
Poison . . . and the Cure
The old adage “the dose makes the poison”
(1) translated into chemical terms means
that concentration matters. A little of
something may be benign or even beneficial,
whereas in large doses it can be fatal. For
example, acetaminophen is an effective pain
reliever and fever reducer, but in high doses
is a liver poison (2). At minimum then, the
label for any medicine needs to have an
accurate statement of the amount of active
pharmaceutical ingredient (API) present in
each dose. And yet in the cannabis industry
mislabeled medicines are an ongoing prob-
lem (3–5). In a recent paper, 62% of commer-
cially available samples had incorrect CBD
amounts on their labels (5). This same paper
found that CBD degrades measurably over
the course of 30 days, and that light and heat
accelerate the degradation (5). This means
the common sell by date of one year on
cannabis products is probably wrong.
To supplement the data on CBD prod-
ucts, I performed a study on the labeling of
marijuana buds. This involved purchasing
1/8 oz of buds of different strains at local dis-
pensaries, noting the total THC value on
the label, and then having the potency test-
ed by high performance liquid chromatog-
raphy (HPLC) at a California state licensed,
If cannabis were regulated like other medicines, the product you obtain at a dispensary would contain a label
with an accurate statement of the amount of active pharmaceutical ingredient, a list of the inactive ingredients,
and an expiration date. I present data below that shows up to 77% of dispensary products are mislabeled. This is
alarming since it means cannabis patients are receiving the wrong dose of medicine, and cannabis consumers
are being ripped off. To solve this problem, cannabis dispensaries need to do their own testing. I discuss
appropriate technologies for this.
cannabissciencetech.com april 2021  
|  
cannabis science and technology®
11
industry trends / cannabis analysis
International Organization for Standardiza-
tion (ISO) certified laboratory (6). The re-
sults for the 14 different marijuana strains
are shown in Table I.
The relative difference for each strain
was calculated by subtracting the label val-
ue from the laboratory value and dividing
by the laboratory value. The state of Cali-
fornia considers a cannabis product misla-
beled if the laboratory value is more than
10% relative different than the label claim.
Other workers have used this same stand-
ard (5). Using this criterion, 10 out of 13 or
77% of the samples examined here were
mislabeled. Note that for all strains the
third party laboratory value is lower than
the label claim. On average, the laborato-
ry value is lower than the label value by
4.55 wt.% total THC, and on average the
relative percent difference was 25.2%.
The fact that all strains studied are signif-
icantly lower than advertised is distressing.
This means cannabis patients are receiving
the wrong dose of medicine, and that can-
nabis consumers are not getting what they
are paying for. All the samples had been har-
vested and packaged at least two months be-
fore this study. A possible explanation for
these results is that the marijuana lost po-
tency over time under the storage condi-
tions used. Cannabis potency decrease over
time has been observed before (7-10). An-
other possible explanation for these results
is inter-laboratory error, where different
cannabis laboratories obtain different num-
bers on the same samples. I have written
on this problem extensively in previous col-
umns and papers (11). If the vendor's in this
study used a different third party laboratory
than I did, it makes sense that we might get
different results. Ultimately though these
results are a condemnation of the state of
California's laboratory testing certifica-
tion program. This obviously needs to be re-
formed to prevent cannabis patients from
receiving incorrect doses and cannabis con-
sumers from being ripped off.
Imagine the uproar if 77% of the bottles
in a batch of ibuprofen were mislabeled?
There would be a hue and cry, gnashing of
teeth, reams of bad publicity, calls for in-
vestigations, sanctions, and possible crim-
inal prosecution. And yet this same exact
scenario takes place regularly in the canna-
bis industry. Why do we tolerate this?
Why Do Dispensaries
Need In-House Testing?
To prevent these problems dispensaries
need to do their own in-house testing for
these reasons.

1. Insure Customer Safety: Dispensaries
are clearly selling mislabeled products.
Medicines need to be labeled properly so
patients get the proper dose. Dispensa-
ries should test their stock before sale to
make sure it is labeled properly.

2.LowerLiability:Anincorrectlylabeled
productcouldcauseharmtoaconsum-
er.Ifadispensarytesteditsstockitself,it
canmakesureonlycorrectlylabeledmed-
icinesaresold,reducingliability.

3. Prevent Customers from Being
Ripped Off: Cannabis consumers are en-
titled to get what they are paying for. If
Table I: Comparison of label total THC value, third party laboratory total THC value, weight % (wt.%) difference,
and relative % difference for 14 marijuana strains
Marijuana Strain WT. % Total THC
on Label
WT. % Total THC by
HPLC Measured at
Third Party
Laboratory
WT. % Difference
Laboratory-Label
Relative %
Difference
Yolo Berry 12.4 11.9 -0.5 4.20
Sour Fizz 19.08 12.4 -6.68 53.87
Orangutang 17.8 15.2 -2.6 17.11
Illemonati 20.12 16.4 -3.72 22.68
GMO Cookies 30.6 29.54 -1.06 3.59
Durban Poison 34.61 24.22 -10.39 42.90
Chem Dog 26.6 23.07 -3.53 15.30
Mint Chocolate Chip 30.51 28.14 -2.37 8.42
Chocolate Marshmallow 29.87 26.4 -3.47 13.14
Candyman 31.15 23.06 -8.09 35.08
Kings Cake 26.69 25.6 -1.09 4.26
Royal Flush 25.73 13.19 -12.54 95.07
Golden Lemons 25.55 21.17 -4.38 20.69
Macaroon 22.66 19.35 -3.31 17.11
cannabis science and technology®  
|  
vol. 4 no. 3 cannabissciencetech.com
12
a jar of buds says it is 25 wt.% total THC,
that is what the consumer should get.
Based on the data above this is clearly not
the case. If dispensaries tested their prod-
ucts before sale they could insure that
only properly labeled products are sold, in-
suring consumers get what they pay for.

4. Prevent Dispensaries from
Being Ripped Off: Dispensaries set the
price they pay suppliers based in part on
potency. In many cases suppliers will pro-
vide certificates of analysis (COAs) from
licensed laboratories to help determine
price. However, there is nothing prevent-
ing suppliers from accidentally or inten-
tionally giving the wrong COA to a poten-
tial buyer—and yes, I know this happens.
Dispensaries need to protect themselves
from being ripped off by doing on the spot
potency tests of products before they buy
them so they know what they are getting.

5.ToMonitorTheirStock:Sincewe
knowthatcannabinoidsdegradeovertime
(7–10), itmakessensefordispensariesto
monitorwhatisontheirshelves.Thiswill
preventthemfromsellingmislabeledor
taintedproductstotheircustomers.

6. Reassure the Public: By doing their
own analyses, dispensaries can assure
the public they are getting what they pay
for and the products being purchased are
safe. Our industry will not realize its full
potential until the public can have full
confidence that cannabis medicines are
safe and effective.
Should Dispensaries
Set Up Their Own
Testing Laboratories?
Setting up a cannabis analysis laboratory
with all the equipment needed to test for
pesticides, heavy metals, terpenes, and
potency is a million dollar plus propo-
sition. This is probably not practical for
most dispensaries. However, given that
in most instances the API is THC or
CBD, having the ability to measure these
analytes would be the best way to insure
correct dosages and accurate label claims.
Many third party laboratories use HPLC
or gas chromatography (GC)to measure
potency (11–14).
I have pointed out in previous columns
that amongst the criteria to use when judg-
ing an analytical method are speed, accura-
cy, and cost (11). I have also pointed out that
chromatography is accurate, but can be
slow and expensive (11). Infrared (IR) spec-
troscopy on the other hand can offer equiv-
alent accuracy but will always be faster,
cheaper, and easier than chromatography
(11). There exist IR spectroscopy-based can-
nabis analyzers that work on flower (15,16),
extracts (17), distillates (18), and tinctures
(19) that cost around $30k (20). This is not
cheap, but probably much more within the
budget of a typical cannabis dispensary
than the cost of a chromatograph.
Conclusions
Mislabeled cannabis medicines are an
ongoing problem in this industry. We
found 77% of the products purchased at
dispensaries are mislabeled. Mislabeled
medicines mean patients are receiving
incorrect doses, consumers are being
ripped off, and dispensaries are exposed
to significant litigation. For these reasons,
dispensaries need to test their products
before they sell them. Suggested potency
testing technologies were discussed.
References
(1) https://en.wikipedia.org/wiki/
The_dose_makes_the_poison.
(2) https://en.wikipedia.org/wiki/Paracetamol.
(3) https://mjbizdaily.com/nearly-a-fifth-of-california-
marijuana-products-failing-testing-standards/.
(4) 
M.O. Bonn-Miller, M.J.E. Loflin, B.F. Thomas,
J.P. Marcu, T. Hyke, and V. Ryan, Journal of the
American Medical Association 318, 1708 (2017).
(5) 
C. Mazzetti, E. Ferri, M. Pozzi, and M.
Labra, Scientific Reports 10, 3697 (2020).
(6) www.sclabs.com.
(7) 
J. Fairbairn, J. Liebmann, and M. Rowan, Journal
of Pharmacy and Pharmcacology 28, 1 (1976).
(8) 
I. Trofin, G. Dabija, D. Vaireanu, and L. Filipescu,
Revista de Chimie (Bucharest) 63, 293 (2012).
(9) 
C. Lindholst, Australian Journal of
Forensic Sciences 42, 181 (2010).
(10) 
B.C. Smith, Terpenes  Testing Magazine,
Nov./Dec.(6), 48–51 (2017).
(11) 
B.C. Smith, Cannabis Science and
Technology 2(2), 12-17 (2019).
(12) 
M.W. Giese, M.A. Lewis, L. Giese, and K.M. Smith,
Journal of AOAC International 98(6), 1503 (2015).
(13) 
C. Giroud, CHIMIA Intl. Journal of
Chemistry 56, 80 (2002).
(14) 
T. Ruppel and M. Kuffel, Cannabis Analysis:
Potency Testing Identification and Quantification
of THC and CBD by GC/FID and GC/MS,
PerkinElmer Application Note (2013).
(15) 
B.C. Smith, M. Lewis, and J. Mendez,
“Optimization of Cannabis Grows Using
Fourier Transform Mid-Infrared Spectroscopy,”
PerkinElmer Application Note (2016).
(16) 
B.C. Smith, Cannabis Science and
Technology 2(6), 10-14 (2019).
(17) 
B.C. Smith, Terpenes and Testing
Jan.-Feb. 2018., Pg. 32.
(18) 
B.C. Smith, P. Lessard, and R. Pearson, Cannabis
Science and Technology 2(1), 48–53 (2019).
(19) 
B.C. Smith, C.A. Fucetola, K. Ehrmantraut,
and T. Hagan, Terpenes  Testing
Sept./Oct. 2020, Pages 19-24.
(20) www.bigsurscientific.com.

ABOUT THE COLUMNIST
BRIAN C. SMITH, PHD,
is Founder, CEO, and Chief Technical Officer of Big Sur Scientific. He is the inventor of the BSS
series of patented mid-infrared based cannabis analyzers. Dr. Smith has done pioneering
research and published numerous peer-reviewed papers on the application of mid-infrared
spectroscopy to cannabis analysis, and sits on the editorial board of Cannabis Science and
Technology. He has worked as a laboratory director for a cannabis extractor, as an analytical chemist for
Waters Associates and PerkinElmer, and as an analytical instrument salesperson. He has more than 30
years of experience in chemical analysis and has written three books on the subject. Dr. Smith earned his
PhD on physical chemistry from Dartmouth College. Direct correspondence to: brian@bigsurscientific.com
cannabis analysis / industry trends
13
cannabissciencetech.com april 2021  
|  
cannabis science and technology®
E
thanol has been used for cen-
turies as an extraction meth-
od and an ingredient to pro-
duce perfumes, food colorings
and flavorings, medicinal bases, and
essential oils. The US Food and Drug
Administration (FDA) has found pro-
duction of consumer goods using food-
grade ethanol to be safe for human
use and consumption, which cannot
be said of other alcohols. It is the sec-
ond most popular solvent behind wa-
ter. It is also the least toxic of all alco-
hols, making it one of the most widely
used solvents in consumer goods. Be-
cause of all the aforementioned char-
acteristics, it is no surprise that eth-
anol has also maintained its position
in the cannabis industry as one of the
most widely used solvents for extrac-
tion of cannabinoids.
Ethanol is a polar solvent, but can
have both polar and nonpolar proper-
ties. It attracts polar and ionic mole-
cules, through its hydroxyl group, and
can attract nonpolar molecules be-
cause of the nonpolar nature of the
ethyl group. Hydrogen bonding of
ethanol and water with the hydroxyl
group can be seen in Figure 1.
Tetrahydrocannabinolic acid
(THCA) and cannabidiolic acid
(CBDA) are both polar compounds
due to their acidic hydroxyl group.
Therefore, they are both easily ex-
tracted with ethanol at room temper-
ature. Chlorophyll is an undesired
polar compound that easily coex-
tracts with the cannabinoids during
most methods of ethanol extraction.
This is why crude ethanol extracts,
such as modern products listed as
Rick Simpson oil (RSO), have a dark
green color and concentrations in the
40–60% range. Advancements have
been made in methodology to opti-
mize for the extraction of cannab-
inoids and exclude chlorophyll and
waxes.
Methods of the
Early Years
Maceration
This method has been used for centu-
ries and is considered a “traditional”
medicinal preparation method for
phytochemicals (2).
Method
1. 
Plant material, like cannabis, is
soaked in ethanol.
2. 
The plant material is then filtered
to separate the solid from the liq-
uid solvent-solute solution.
3. 
The solution is processed using
rotary evaporation or falling film
evaporation to remove the solvent.
This results in a crude botanical
extract.
4. 
Products, such as alcohol-based
tinctures, can be produced direct-
ly from the extraction using the
solute-solvent solution.
Pros
1. Ease of method
2. 
Fast extraction time
3. Low cost
4. 
Can be used at a small and
large scale
Cons
1. Highly variable
2. 
Minimal control over extracted
target compounds
3. 
Can be a long extraction time de-
pending on the input material,
proof of ethanol, and temperature
at which the extraction occurs.
4. 
With respect to cannabis extrac-
tion, the inability to control the
temperature of the extraction and
therefore the polarity of the sol-
vent, results in an extract contain-
ing chlorophyll, water, and other
compounds. If the goal of the ex-
traction is to purely extract can-
nabinoids, this method produces
an extract that is not.
The Evolution of Ethanol
Extraction Methods in Cannabis
By Lo Friesen
Ethanol has maintained its position as one of the most scalable extraction methods because of its simple
methodology and solvent properties. Over time, the technology used in ethanol extraction has increased the
selectivity of the method and resulted in shortened post-processing times and increased purity. In this article, we
will walk through the evolution of the extraction method within the cannabis industry, where it stands today, and
the other alcohols that are being introduced to the cannabis extraction space.
extraction science
cannabis science and technology®  
|  
vol 4. no. 3 cannabissciencetech.com
14
Soxhlet Extraction
This method has been used for decades
and is considered a “traditional” medic-
inal preparation method for botanicals.
Method
1. 
Plant material, like cannabis, is
packed into a column that is po-
sitioned between the boiling flask
containing ethanol and a
condensing column.
2. 
The ethanol is heated to produce
a vapor, which will then inter-
act with the plant material such
that an extraction occurs. The re-
sulting solution is a mixture of
solvent and compounds that are
soluble in ethanol at the vapor
temperature of ethanol.
3. 
The ethanol-extract solution then
collects in the boiling flask.
Pros
1. Ease of method
2. 
Plant material is contained sepa-
rately from ethanol-extract solution,
eliminating the need to filter the
plant material from the solution.
3. Fast extraction time
4. Low cost
Cons
1. Low selectivity
2. 
Not scalable
3. 
As with the maceration method,
the result is a cannabis extract
that is far from pure.
Recent Advancements
Cold Ethanol Extraction
This method has developed over the
past decade to improve the selectivity
of ethanol and optimize extraction of
cannabinoids.
Method (5)
1. 
Plant material is loaded into a
mesh bag or basket and placed in
the extraction chamber.
2. 
Ethanol is chilled to -40 °C then
introduced to the extraction
chamber soaking the plant materi-
al and the solute is extracted with
the ethanol that flows through the
plant material.
3. 
The ethanol-extract solution is
then pumped out of the extraction
chamber to a collection vessel to
be processed further.
4. 
The solvent is evaporated using
rotary evaporation or falling film
evaporation.
5. 
The extract can then be used to
formulate final products or dis-
tilled further for higher purity of
cannabinoids.
Pros
1. 
Increased solvent selectivity, re-
sulting in a more pure-cannabi-
noid extract
2. 
Scalability
Cons
1. Increased extraction time
2. 
Reduced solvent solubility and
yield
3. 
High equipment cost
4. High electricity usage to chill the
solvent
Liquid-Solid Mix and
Separation Centrifuge
Extraction with Cold Ethanol
This is the most common method used
in cannabis and hemp ethanol
extraction today.
Method
1. 
Plant material is ground to a uni-
form size.
2. 
Plant material is added to a mesh
bag and placed inside a centrifuge
basket.
3. 
Ethanol is chilled to -40 °C then
introduced to the centrifuge
chamber where the ethanol soaks
the cannabis.
4. 
The centrifuge is powered on and
churns like a washing machine to
mix the solvent and plant material
while the solute is extracted.
5. 
After the extraction, the extract-
ed solution is pumped out of the
centrifuge basket into a collection
vessel.
6. 
The solution is then introduced
to a solvent removal process, like
falling film evaporation, which
leaves the final extract complete
and ready to formulate.
Pros
1. Fast extraction time
2. Increased solvent selectivity
3. 
Separation of liquid and solid occurs
simultaneously with the extraction,
eliminating a filtration step
4. Ease of use
Cons
1. 
Reduced solvent solubility and
yield
2. High equipment cost
3. 
High electricity usage to chill the
solvent
4. 
Equipment maintenance—etha-
nol can easily cause fast wear on
bearings that are integral to high
speed centrifuges
Figure 1: Hydrogen bonding of ethanol
and water with the hydroxyl group (1).
ethanol
H H
H
H
H
H
H
H
H
H
O
O
O
C
C
extraction science / ethanol extraction
15
ethanol extraction / extraction science
cannabissciencetech.com april 2021  
|  
cannabis science and technology®
5. 
Highly laborious to continuous-
ly remove and refill the centri-
fuge with plant material
6. 
Note: As the process scales up,
a noticeable decrease in yield
has been acknowledged as a re-
sult of more ethanol being used
and remaining within the plant
material. This reduces the yield
and increases processing time in
the evaporation stage.
Other Alcohols
Other alcohols, like isopropyl or meth-
anol, have been utilized in botanical
extraction for many years. Isopropyl
alcohol and methanol are significantly
lower in cost than ethanol, but have
their own pros and cons including being
toxic to inhale or ingest at far lower con-
centrations than ethanol (6). Methanol
has a lower boiling point, which also in-
dicates a lower polarity. Being less polar
than ethanol, methanol is less efficient at
extracting THCA and CBDA. Isopropyl
alcohol has a higher boiling point and
higher polarity, this results in higher
yields of cannabinoids in a shorter
amount of time, but also extracts higher
quantities of chlorophyll. The evaluation
of solvents is heavily focused around the
cost of a solvent, a company’s ability to
remove all of the residual solvent to min-
imize consumer risk, and post-process-
ing time and methods. These alternative
alcohols are strong candidates for any
business that further refines the extract
using distillation. Wiped or thin-film
distillation can produce a pure cannab-
inoid distillate, reducing the need for
purity in the crude form.
The Future
As hemp and cannabis processors
continue to scale up, technology must
keep up with rapid improvements and
development to address the bottle-
necks in processing massive amounts of
biomass. These bottlenecks are in the
grinding process, loading and unloading
inputs, and solvent evaporation. Leading
manufacturers, such as Eden Labs, are
introducing continuous-feed centrifuge
technology to the cannabis industry.
This methodology involves a continuous
stream of ground plant material and
ethanol flowing through a centrifuge
which creates a solid-liquid slurry where
the extraction occurs. The slurry is then
continuously pumped into a separation
centrifuge where the solid and liquid
materials are separated. The liquid
ethanol-extract solution is then continu-
ously pumped into a solvent evaporation
step. While falling film evaporators
have become the chosen evaporation
method, the continuous feed technology
has forced an even better method to be
utilized called membrane filtration. Using
scalable membrane technology, the
extract and solvent are easily separat-
ed and can accommodate continuous
feed. Ethanol extraction is primed for
continuous feed and complete automa-
tion, reducing costs and bottlenecks in
scalability.
Through advancements in technolo-
gy, such as the coldfinger or cold-eth-
anol extraction of cannabis and hemp,
Figure 2: The soxhlet extraction methoed (2).
Figure 3: The cold ethanol extraction method (4).
cannabis science and technology®  
|  
vol 4. no. 3 cannabissciencetech.com
16
efficiency and selectivity of the sol-
vent has dramatically increased and im-
proved the extraction of desired com-
pounds. After the solvent evaporation
process, the cannabinoid concentrate is
ready to be formulated for end products.
With the right temperature, extraction
time, and equipment, ethanol extracted
cannabis and hemp can produce relative-
ly high purity (60–70%), golden cannab-
inoid extract, with extraction efficien-
cies of +90%. Ethanol continues to be
the solvent of choice for high-throughput
cannabis processors aiming to extract
hundreds to thousands of pounds of can-
nabis and hemp biomass daily. Ethanol
extraction is a prime candidate for auto-
mation, which will translate to improved
efficiency, lower costs, higher through-
put, and much more. It will be interest-
ing to watch as automation is integrated
into ethanol extraction and refinement
processes in the coming years.
References
(1) 
N.E. Schore and K.P.C. Vollhardt, Organic
Chemistry: Structure and Function (Bleyer,
Brennan, New York, New York, 2007).
(2) 
B.A. Weggler, B. Gruber, P. Teehan, R.
Jaramillo, and F.L. Dorman, in Separation
Science and Technology (Academic Press,
Volume 12, 2020, Chapter 5 - Inlets
and sampling) pp. 141–203, https://doi.
org/10.1016/B978-0-12-813745-1.00005-2.
(3) 
New Directions Aromatics, 2017,
“Untapping the Power of Nature: Essential
Oil Extraction Methods” https://www.
newdirectionsaromatics.com/blog/articles/
how-essential-oils-are-made.html.
(4) 
Eden Labs, 2021, “Coldfinger Ethanol
Extraction” https://www.edenlabs.com/
coldfinger/ethanol-extraction-process/.
(5) 
R. Anton, et al., European Food and
Feed Law Review 9(6), 391–398 (2014).
www.jstor.org/stable/24326136.
(6) 
Q.W. Zhang, L.G. Lin, and W.C. Ye, Chin. Med.
13(20), doi:10.1186/s13020-018-0177-x (2018).
ABOUT THE COLUMNIST
LO FRIESEN is the
founder, CEO, and Chief
Extractor of Heylo.
With a background in
chemistry and clinical
research, Lo was inspired to explore
cannabis as a medicine and to enter
the emerging industry. She joined Eden
Labs, a leading CO2
extraction equipment
manufacturer to support and expand a
Research and Development department.
There she managed the development of
their latest and greatest CO2
extraction
system. In 2017, after working with Eden
Labs and another cannabis processor, Lo
launched Heylo with a mission to help
people get more out of life with cannabis.
extraction science / ethanol extraction
Endocannabinoid
Educational Certification Courses
In partnership with Havas ECS, Cannabis Science and Technology®
, Cannabis Patient Care™ are
offering this comprehensive training curriculum for all levels of students—from healthcare
professionals to patients, parents, caregivers, and budtenders. With three different course
offerings, you can choose to learn the basics of the endocannabinoid system or earn continuing
medical education (CME) credits in either a 3-CME course or 12-CME course.
Learn more at
cannabissciencetech.com/courses
In Partnership with
17
cannabissciencetech.com april 2021  
|  
cannabis science and technology®
Looking with Light: Breaking
Down Liquid Chromatography
Method Development
By Patricia Atkins
T
he start of method develop-
ment is identifying and un-
derstanding the physical and
chemical nature of the analyti-
cal targets and the scope of analytical
instruments. Methods are a complete
package of the chemistries, modali-
ties, and functionality of all the tar-
gets, sample preparation, instrumen-
tation, chromatographic phases, and
parameters that allow for the separa-
tion, identification, and quantitation
of the analytes of interest.
Often, ambitious analysts try to
create a single method for all their
analytes under one process and one
instrument and end up with lots of
mediocre data. Equally frustrating
is setting up a method with stand-
ard conditions and settings without
fine tuning it to the samples and an-
alytes then becoming disappointed
when the method “doesn’t work.” It
is important to recognize that there
will be instances where the sample
preparation or the analysis meth-
od will require separate processes or
“tweaking” to report all the target
analytes efficiently and accurately.
There is no one size fits all or straight
out of the box solution.
Instrument Selection
and Dynamic Range
I am sorry to say there is no one
piece of instrumentation that will fill
all needs. Some technologies have a
wider range of targets, such as liquid
chromatography–mass spectrometry
(LC–MS) versus gas chromatography
(GC)–MS, but each technique has
its limitations and uses. Instrument
choice is often dependent on the
chemistry of target analytes and their
potential analytical concentration. For
instance, in cannabis there are several
classes of organic analytes that are
routinely examined including canna-
binoids for potency; terpenes and fla-
vonoids for identity, flavor, fragrance,
and chemical fingerprinting; and
pesticide residues or mycotoxins as
potential contaminants. By their very
nature all of these compounds occur
in vastly different concentrations.
Trace analysis (low parts-per-million
[ppm] or parts-per-billion [ppb])
is the range for any method created
to quantify potentially dangerous
contaminants such as pesticides or
mycotoxins and requires systems such
as GC–MS, LC–MS and LC–tandem
MS (MS/MS), which have sensitivity in
those low ranges.
Cannabinoids and terpenes on the
other hand can occur in the high ppm
level up to the percent level and re-
quire a different range of analysis
such as what is found in high per-
formance liquid chromatography
(HPLC) coupled with ultraviolet-vis-
ible (UV-vis) detection and GC cou-
pled with flame ionization detection
(FID). These two ranges of analy-
sis often cannot be produced and
The analytical scientist is often tasked with a difficult job of being accurate, efficient, and expedient in their
work. Often these focused goals do not allow a lot of time for research and fine tuning of their workflow. Many
chromatographers use methods they find from manufacturers or technical sources and adapt them to their
situations and analyses. Sometimes the methods get adjusted or “tweaked” to improve the fit or increase the
output but, unless the scientist is doing research or creating a totally new method approach, they build upon
the backs of other methods. In this column, we take a deeper look into the chemistry, physics, and methodology
of high performance liquid chromatography (HPLC) methods. We will look at how columns function and
what changes can be made to increase resolution, efficiency, and separation to reach a laboratory’s
chromatographic goals.
navigating the lab
cannabis science and technology®  
|  
vol. 4 no. 3 cannabissciencetech.com
18
navigating the lab / analytical
quantitated by a single method of
an instrument without significant
changes to the samples.
The accuracy and ability to quan-
tify analyte concentrations depends
on the instrument's analytical spec-
ification levels and dynamic range
often bracketed by the level of de-
tection (LOD) and level of lineari-
ty (LOL)(Figure 1). The lowest lim-
it of an analytical system is the limit
of detection (LOD), this is the point
where a target can be differentiated
from a blank or noise with a high de-
gree of confidence (usually over three
standard deviations from the noise or
blank response). The highest level of
accurate quantitation ends with the
LOL, where the linearity of the sys-
tem starts to skew often due to detec-
tor saturation. Peaks that reach LOL
appear broad, flatten at their apex, or
are cut off before their apex.
The range of the most accuracy
(dynamic range) is between the LOD
and LOL starting at the limit of quan-
titation (LOQ). The limit of quanti-
tation (LOQ) is the lower limit of a
method or system, which the target
analyte can be reasonably calculated
(over 10 standard deviations from the
blank or baseline response).
A simple method to determine if
a response peak reaches the cutoff
for LOD or LOQ is to look at the ra-
tio of signal-to-noise (S/N). A blank
baseline in chromatographic systems
is rarely flat and straight. The low-
est points of the chromatogram are a
combination of the true baseline and
system noise. Baseline noise is the sum
of all the random variations (electri-
cal, temperature, and so on) and con-
tamination or interference from the
chemical components.
To determine if a peak can be quan-
tified, one can either compare relative
heights or relative areas. In compar-
ing relative height, the analyst aver-
ages the mean height of the noise and
compares it to the height of the target
peak from the noise mean height. To
compare areas, one or more “peaks”
in the noise are integrated with sim-
ilar width to the target peak and the
areas are compared. If the ratio is
greater than three then it qualifies as
within LOD and if the ratio is greater
than 10, then that peak can be used
for quantitation (LOQ).
The best practice is to integrate
the noise at the baseline at several
points and average the baseline noise
responses then compare to the inte-
grated peak of interest (Figure 2).
Figure 1: Dynamic range and limits.
Figure 2: Example of peaks meeting LOD (peak B), LOQ (peak C), baseline, and
noise levels.
19
cannabissciencetech.com april 2021  
|  
cannabis science and technology®
For example, if the chromatographer
is interested in peak A, they should
integrate areas of baseline near the
peak of similar peak widths to the
target or measure its height com-
pared to the average range of peak
heights found in the noise. If the av-
erage of those baseline noise peaks is
100 units (height or area) then peak A
must be at least 300 units to meet the
LOD criteria of 3X. If peak A is only
200 units then it fails and cannot be
used for either identification or quan-
tification. If peak B is the peak of in-
terest and has a S/N 3 but 10, then
it can be used for detection (LOD)
and possibly identification but should
not be used for quantification (LOQ).
Finally, a peak such as C can be used
for both identification and quantifi-
cation because its S/N value is high-
er than 10.
Instrument sensitivity (represent-
ed as S/N) can be increased by decreas-
ing baseline noise without increasing
the target response. Noise in a system
can be created by matrix from the ex-
tracted sample, contamination of the
sample, and contamination of either the
stationary phase or mobile phase. Prop-
er sample clean-up and processing can
sometimes reduce baseline noise, so the
target peak is not “lost in the weeds”
of the baseline. Often it is believed that
one can get a better response by inject-
ing a larger sample aliquot, but if the
sample matrix is a contributor to the
noise, then a larger sample means more
matrix as well and will not necessarily
help with the issues of S/N.
As for the mobile phases, impuri-
ties in mobile phase can directly af-
fect baseline noise. The wrong grade of
gases in GC can create high baselines
while HPLC mobile phases can accu-
mulate contamination by exposure to
the laboratory environment. Replac-
ing old solvents with fresh solvent can
dramatically lower HPLC baseline
noise. In some cases, especially in LC–
MS and ppb analysis, the use of highly
filtered LC–MS solvents can also play
a role in reducing baseline noise.
Solid phase contamination and
build up can play a role in baseline
noise. As columns age, the backbone
materials—silanes, siloxanes, and so
forth—can break down or lose pro-
tective end capping, which increas-
es noise. Harsh or acidic HPLC mo-
bile phases can strip column phases
and promote column breakdown. By
examining the chromatographic base-
line and cleaning up the contributing
factors it can ensure that more target
peaks fall into the LOQ needed for
many analyses.
Figure 3: Reversed-phase column selection.
Figure4:Example initial chromatogram: t0
= dwell time (void volume) sometimes
also referred to as tD
, tF
= end time of method. A: unretained peaks and co-
elution; B: early eluting peaks and co-elution; C: baseline resolved peak; and
D: late eluting peak cut off by end of method.
analytical / navigating the lab
cannabis science and technology®  
|  
vol. 4 no. 3 cannabissciencetech.com
20
navigating the lab / analytical
Understanding the Targets
HPLC is a powerful analytical tool
that needs extensive adjustments to
maximize its accuracy and efficiency.
All the adjustments and fine tuning
of parameters ultimately are based
on the targets of interest. Generally,
chromatographers group targets as
either polar or nonpolar analytes,
with some fluctuating between the
two classifications. Nonpolar analytes
such as alkanes and alike often are
targets for normal phase chromato-
graphic methods while polar analytes
such as carboxylic acids, will be
examined with reversed-phase chro-
matographic methods. The majority
of modern HPLC analysis falls under
the classification of reversed-
phase LC.
The parameters of reversed-phase
LC dictate that the mobile phas-
es used with be polar solvents while
the stationary phase (column) will be
nonpolar. Target analytes that dis-
solve in polar solvents and water will
then use either ion-exchange columns
or reversed-phases columns depend-
ing on their chemistry (Figure 3).
The most common reversed-phase LC
columns are the C18 or C8 columns
since they service a wide variety of
chemistries. Column manufacturers
may change or supplement the chem-
istries of their standard C18 columns
with different modifiers, which can
assist with particular issues such as
resistance to highly aqueous methods
or better retention of highly
polar compounds.
The chemical properties (in addi-
tion to the concentration) of your tar-
gets will dictate—to a degree—the
type of instrumentation that will be
needed for analysis. As was stated
previously, the concentration of an-
alytes can dictate instrumentation
such as UV over MS. But the chemical
nature of the compounds will play an
important role not only in selecting
the right column but the right detec-
tor. Compounds that are easily ion-
ized can be detected using electros-
pray ionization (ESI) with LC–MS.
But, if your compounds are not as
easily ionized then other atmospheric
pressure ionization sources, such as
chemical and photoionization (APCI
and APPI) need to be considered if
LC–MS is the method of detection.
Learn more: www.acdlabs.com/MSWorkbookSuite
Easily Deconvolute GC/MS  LC/MS Data
3 simple steps from data to answers
Separate Identify Store  Share
Automatically extract and
separate components
Search libraries to
identify structures
Store interpreted
results with live data
21
cannabissciencetech.com april 2021  
|  
cannabis science and technology®
analytical / navigating the lab
Molecules with chromophores can
utilize UV-vis detectors, while fluo-
rescent molecules can utilize other
chemiluminescent detectors.
Once the chromatographer under-
stands their target analyte’s range re-
quirements, selected instruments, de-
tectors, and targeted possible column
chemistries it is time to start building
or refining an analysis method.
Initial Method
Considerations
One of the first questions asked when
researching a new method is: Has any-
one already created a method for my
analysis? The good news is that most
of the time someone, somewhere,
has performed a similar analysis on a
similar class of compounds or a sim-
ilar type of material. The bad news is
that the methods you find usually are
a starting point and not an out-of-the
box solution. Methods that are found
in journals and websites are not nec-
essarily a perfect fit for your labora-
tory’s instrument configurations nor
are they all validated for the purpose
you might need (if they are validated
at all).
In some cases where there are dif-
ferent size columns, tubing, parti-
cle, or pore size, it is helpful to use an
HPLC method translation tool to help
alter flow rates and gauge retention
time. One free method translator tool
can be found at: https://www.acd-
labs.com/resources/freeware/transla-
tor. A downloadable excel calculator
can be found at: https://ispso.uni-
ge.ch/labs/fanal/hplc_calculator:en.
Method translation tools do not al-
ways take into consideration what
may be practical for your system.
They are usually just sophisticated
calculators. The resulting parameters
may exceed the capacity for your sys-
tem (that is, the back pressure creat-
ed will be too high, or the injection
volume cannot be achieved with the
system). Again, these parameters are
meant to be a starting point for opti-
mization and must be examined with
a critical eye.
In initial method development, it
is best to start by separating targets
from either a standard or a well-char-
acterized sample to achieve separa-
tion, then use various concentrations
and matrices to improve sensitivi-
ty and response. An initial chromato-
gram may have multiple unretained
or overlapping (coeluting) analytes.
It is also possible to have peaks re-
tained on the column past the meth-
od run time (Figure 4). It is also pos-
sible that “negative peaks” (peaks or
dips below the baseline) can be seen
in the chromatogram, usually appear-
ing right before the unresolved peaks.
Negative peaks are a visual rep-
resentation of the difference or
change in detector response that re-
sult in response below the baseline or
set point. These peaks can be caused
by a number of issues including the
movement of internal values such as
when the injector values switch back
and forth from injection to normal
flow path. Another way negative
peaks can be observed is when the
solvent used to dilute your sample
differs from the solvent composition
of the HPLC system. For example, if
your extracted sample of cannabis is
in 100% ethanol, but the HPLC mo-
bile phase starts as 50:50 water–ace-
tonitrile; then you may have a signifi-
cant negative peak as the ethanol hits
the detector due to changes in ab-
sorbance, refractive index,
or conductivity.
In any method development it
is best to remember the old adage:
“Slow and steady wins the race.”
Change one parameter at a time and
then move on. It is very tempting to
change multiple parameters (mo-
bile phase, additives, flow rate, tem-
perature) all at once to save time and
effort. Unfortunately, often it di-
lutes the effort, and you cannot track
which changes give you the
best resolution.
Achieving Resolution
There will be times that there are
only general methods available that
are remotely similar to your intended
Figure 5: Examples of peak resolution (R) from unresolved peaks at
0.5 to baseline resolved peaks at greater than 1.5.
cannabis science and technology®  
|  
vol. 4 no. 3 cannabissciencetech.com
22
navigating the lab / analytical
analysis; in that case basic param-
eters become the starting point on
which to build a method that provides
resolution of target analytes. Peak
resolution—the ability of a column to
separate peaks in a chromatogram—is
a complex interaction of forces and
factors observed as adjacent peaks
merging (coeluting) to a single peak
or separating (resolving) into two or
more peaks. Resolution is the rela-
tionship between the differences in
retention times of two adjacent peaks
divided by the sum of the peak widths
of the two target peaks at
the baseline.
Retention time or Rt
is the time be-
tween injection and the appearance
of the peak maximum or apex. The
first step in evaluating another ana-
lysts’ method is to try and duplicate
all the conditions, instrumentation,
columns, mobile phase, and settings
described then run a known test
sample or standard to obtain a
starting chromatogram.
Peak width or band width (w) is the
width of the peak or chromatograph-
ic band measured at the baseline by
drawing tangent lines from the
inflection points of the curve that
represents the peak. The resolution
between two adjacent peaks of
similar heights can be calculated
using the resolution equation
(Equation 1):
[1]
For example, if an analyst is separat-
ing cannabis terpenoids and there
are two terpenes that resolve at
7.5 min and 8.0 min with peak widths
of 0.5 min and 0.75 min would have
R = 2(8.0 – 7.5)/(0.5+0.75) = 0.8
Peak resolution needs to have
R 0.6 to be able to discern sepa-
ration between two peaks of equal
height. Two peaks with values of R
1.5 are considered to have good res-
olution and peaks of R 2 are fully or
baseline resolved. In our example,
the two terpenes would be coeluting
with some minimal separation at the
apexes (Figure 5).
For a cannabis analyst who needed
to separate all the terpenes, cannab-
inoids, pesticides, and so on, effort
to increase resolution would have to
begin. According to the first resolu-
tion equation, resolution is affected
by peak width and retention time. To
improve resolution the analyst would
have to either increase the retention
time of one of the peaks (meaning
that they would have to find a way
to keep the peak partitioned in the
stationary phase for a longer time)
or decrease the peak width. There
are three basic HPLC parameters
that the chromatographer can use
to change conditions of their meth-
od: mobile phase composition, sol-
id phase chemistry, and flow rate.
The usual first step to increase the
amount of time an analyte spends in
either phase is to change the compo-
sition of the mobile phase, usually by
changing the gradient program.
Peaks that elute early in the chro-
matogram and spend too much time
in the mobile phase and are not being
retained well by the stationary phase.
These compounds are more polar or
are hydrophilic. Most reversed-phase
LC gradient methods start with a
high concentration of water (50–
80%) and a lower concentration of
organic mobile phase. The gener-
al rule of thumb for reversed-phase
gradient methods is to start or-
ganic solvents low and increase to
high. If you have early eluting com-
pounds it means you either have to
start with slightly less water mobile
phase or change the stationary phase
chemistry (column). Changes to the
flow will not help unretained peaks
and very early eluting compounds.
Peaks that elute late in the chroma-
togram spend too much time with the
stationary phase and only elute when
the organic mobile phase concen-
tration is high enough to force them
from the column. These compounds
are less polar and more hydrophobic.
To speed up late eluting compounds
the organic phase can be increased
more rapidly by increasing the gra-
dient slope. Changes in the station-
ary phase chemistry can also be used
to resolve late eluters. Sometimes in-
creasing flow rate can help stop late
eluting peaks from being lost if they
are retained on the column until after
the program ends. Some instruments
allow for changes in flow rate over
the method run and increasing flow
rate may assist with late eluting peaks
in this approach.
Generally, flow rate is not the first
choice for peak resolution. Resolution
is a function of peak width and time,
which we observed in equation 1, so
Table I: Eluotropic values for
reversed-phase mobile phase
solvents
Reversed-Phase
LC Mobile Phase
Eluotropic value
(ε0
) Al2
O3
Water 1
Methanol 0.95
Ethanol 0.88
Isopropanol 0.82
Acetonitrile 0.65
Ethyl Acetate 0.58
Acetone 0.56
Tetrahydrofuran 0.45
23
cannabissciencetech.com april 2021  
|  
cannabis science and technology®
analytical / navigating the lab
by increasing flow you do decrease
the peak width, but you also decrease
the difference in retention times,
which has a bigger impact on resolu-
tion. But resolution is also a function
of three other factors: retention (or
capacity), separation (or selectivity),
and efficiency characterized in
Equation 2 for isocratic methods:
[2]
Retention or capacity factor (k) is
the time that a sample analyte resides
in the stationary phase relative to the
time it spends in the mobile phase. It
is calculated from time difference be-
tween the analyte peak (tR
) and the
unretained peak divided by the time
of the unretained peak (t0
)
(Equation 3).
[3]
Capacity factors or retention val-
ues less than five have the biggest ef-
fect on resolution. For example, if k =
10 then in the resolution equation 2
– the factor for retention is 10/(1+10)
which is close to 1; but if the k = 1,
then the retention factor is 1/(1+1) or
½ and will have a larger impact
on retention.
Separation or selectivity factor (α) is
the ability of a chromatography sys-
tem to distinguish the chemical dif-
ferences between compounds. It is
measured as a ratio capacity factors
(k) of the two peaks being
examined (Equation 4).
[4]
Efficiency (N or H) is a measure
of theoretical plates in a chromato-
graphic system. Theoretical plates
are a concept described by the Nobel
prize winners Martin and Synge in
which they related the theories of dis-
tillation to chromatography. In dis-
tillation columns for crude petrole-
um, there are actual separator plates
to help separate and isolate petrole-
um fractions. Early petroleum distil-
lation used different length columns
that related to its efficiency. Chroma-
tography columns do not have phys-
ical plates that can be measured, so
the plates are theoretical to describe
the efficiency of the column. In this
regard, the length of the column is
called a height equivalent to a theo-
retical plate (HETP) and is measured
as column length (L) divided by theo-
retical plates (N). Efficiency or theo-
retical plates are calculated as by the
relationship between peak retention
Figure 6: Graphical representations of resolution factors: retention,
selectivity, and efficiency.
Table II: Common HPLC and LC–MS buffer additives and their corresponding pKa and pH values
Buffer pKa pH Range UV Cutoff (nm) (10 mM) LC–MS
TFA 0.5 1.5 210 (0.05%) Y
Phosphate (pk1) 2.1 1.1–1.3 200 N
Citrate (pk1) 3.1 2.1–4.1 230 N
Formate 3.8 2.8–4.8 210 Y
Acetate 4.8 3.8–5.8 210 Y
Ammonia 9.2 8.2–10.2 200 Y
cannabis science and technology®  
|  
vol. 4 no. 3 cannabissciencetech.com
24
navigating the lab / analytical
time (tR
) and the peak width at base-
line (wb
) (Equation 5).
[5]
If peak width is taken at the half
height point in the peak it is called
width at half height (w1/2
) and is mul-
tiplied by 5.54 instead of 16. Efficien-
cy (N) can also be calculated as a re-
lationship of retention time (tR
), peak
height (hp
), and peak area (A)
(Equation 6). Finally, efficiency can
be measured as a relationship be-
tween separation factor (α), col-
umn length (L), and particle size (dp
)
(Equations 7 and 8).
[6]
[7]
[8]
Starting with
Mobile Phase Chemistry
If the chromatographer wants to
increase resolution, then they must
find a way to increase one of the
three factors: retention, selectivity, or
efficiency (Figure 6). In many cases,
the first place to start is altering the
mobile phase instead of changing
columns (stationary phase). The
goal is to increase the time the peaks
spend in the mobile phase. Increasing
retention will result in peaks spending
more time in the solid phase, mov-
ing the peaks apart but it can result
in band broadening (increased peak
width over time of analysis) and this
approach only works best on early
eluting peaks (which the retention
factor is less than five). One way to
increase retention (k) is to use weaker
solvents or ones with lower
elution strengths.
In my previous column, the con-
cept of eluotropic value (ε0
) was intro-
duced. Eluotropic value (also known
as elution strength) describes the
ability of a solvent to pull an analyte
from the solid phase. The larger the
ε0
of the solvents of the mobile phase
relates to less retention (Table I).
Water has a high ε0
, so using a low-
er concentration in the mobile phase
can increase retention. Switching sol-
vents for lower ε0
solvents such as
changing methanol (ε0
=0.95) for ace-
tonitrile (ε0
=0.65) is the best way to
increase retention, but will increase
in method analysis time. The custom-
ary approach for developing methods
for a sample with many types of ana-
lytes is to increase k for early eluting
compounds and decrease k for late
eluting compounds.
Since selectivity is related to re-
tention, many of the same approach-
es such as changing solvents is effec-
tive as a method to change selectivity.
Selectivity can also be changed by
chemical effects to solvent through
additives and pH modifiers. The
chemical nature of the target ana-
lytes become important, especial-
ly in the understanding of pH, pKa,
and pKb which are the basis for all
acid-base interactions. The letter p
means that value or measurement is
based on a logarithmic (-log) value or
measurement. Then pH is the meas-
urement of hydrogen ion concentra-
tion of a compound in an aqueous
solution, where pH = -log [H+] and
equates to relative acidity or alkalin-
ity of a compound. The scale ranges
from 0 to 14, where low values equate
to acidic compounds and high val-
ues are alkaline. Neutral for the scale
is pH of 7. The pH of a solution indi-
cates an acid or base, but not neces-
sarily the true strength of that acid or
base. To measure the strength of an
acid or base, one needs to look at the
pKa or pKb.
The terms pKa and pKb are the -log
of Ka and Kb (acid and base disso-
ciation constants) that predict if a
compound will donate or accept pro-
tons at a specific pH. These values
are true indicators for the strength
of an acid or base since they are un-
affected by the amount of water add-
ed to the solution. For acids, small-
er pKa values indicate stronger acids
while in bases smaller pKb indicate
stronger bases. By adding buffers to
mobile phase, the chromatographer
can change resolution (Table II). As
methods are being developed, always
start with weaker acids at the lowest
functional concentration possible
(~ 0.01 M) and increase in acid
strength and concentration until the
desired results are achieved. High lev-
els of buffer (0.1 M) since extreme
pH (very acidic or very basic) can
damage columns and increase they
viscosity of the mobile phase there-
by increasing pressure in the sys-
tem. Most columns are safe in the
range between pH 2 to 7.5 (but con-
sult column specifications). For basic
or mixed sample types, mobile phase
pH near neutral increases retention,
while acidic sample are aided by acid-
ic mobile phase.
If an acid analyte is in a mobile
phase whose pH is similar to the tar-
get analyte’s pKa, then there is lower
degree of ionization and an increase
of retention can be observed. When
mobile phase pH is significantly over
or under an analytes pKa or pKb then
the degree of ionization increases and
reduces retention. So, protonated ba-
sic analytes may have low retention
at acidic pH while acidic analytes will
have increased retention.
The reverse can also be true that
basic analytes in a high pH mobile
phase will increase retention where
acid acids will decrease in retention.
25
cannabissciencetech.com april 2021  
|  
cannabis science and technology®
analytical / navigating the lab
Differences between target pKa (or
pKb) and mobile phase pH and pKa
are of even more importance in LC–
MS where ionization is critical to de-
tection. Keeping mobile phase (and
buffers) pH and pKa similar to the
target improves resolution because it
moves the ionizable target to a more
neutral state, but for LC–MS to be
effective the compound needs ion-
ic character or to have the ability
to be easily ionized. Therefore, the
rule of thumb for pH, pKa, and mo-
bile phase is to aim for mobile phase
pH 1–2 units from the target analytes
pKa within the specification range of
the column.
It is important to remember that not
all buffers are appropriate for all ap-
plications. Salts can precipitate out of
solution as mobile phase composition
changes. Salts are also problematic for
LC–MS analysis since they can inhib-
it ionization. If solids are dissolved
into mobile phase it is important to re-
member to filter the mobile phase and,
in some cases, the mobile phase may
need to be heated to dissolve solids
completely. Changes in column com-
partment temperature may aid in keep-
ing buffers in solution.
In some cases, temperature of the
column compartment can be used as a
tool to alter the retention and selection
of a method. Keeping a constant tem-
perature can often help with fine tuning
a retention time by eliminating external
temperature changes. Some reduction in
retention (k) can be achieved by increas-
ing temperature allowing for peaks to
elute earlier. Many changes to resolution
(retention, selectivity, and efficiency)
can be made by the manipulation of the
mobile phase chemistry (Figure 7).
Changing Columns
There will be times when all the
changes to mobile phase have not
resulted in the desired resolution (re-
tention, selectivity, and efficiency) so
then it is time to consider a different
column chemistry or different physi-
cal column parameters.
In reversed-phase LC, the most re-
tention is usually found in C18 col-
umns followed in descending order
to C8, C2, and so forth. The lowest
retention is found in phenyl and cy-
ano columns. Most reversed-phase
LC systems have some form of C18
column as part of their standard ma-
terials package from a manufactur-
er upon set up and is often the most
used or tested column to start meth-
od development. The specifications
for the column should designate its
internal diameter (mm), length (mm),
particle size (µm), and pore size in
Angstroms (Å ). A fairly standard size
for a starting column is 4.6 mm x
100–150 mm, 5 µm and 80–100 Å.
The physical column characteris-
tic can have a large effect on the res-
olution, system pressure and analy-
sis time. First, let us look at column
length. Increasing the length of the
column has a direct effect on effi-
ciency from Equation 7. Doubling the
length of the column does give you a
resolution increase of about 1.4x, but
it also doubles the pressure and anal-
ysis time. Resolution is increased at
the expense of time and pressure. So
conversely, if you want to decrease
Figure 7: Steps to change resolution by changing mobile phase parameters.
cannabis science and technology®  
|  
vol. 4 no. 3 cannabissciencetech.com
26
navigating the lab / analytical
back pressure and decrease analysis
time then a shorter column is needed,
but that will reduce resolution.
The second parameter of the reso-
lution from equations 7 and 8 is par-
ticle size. As the particle size increas-
es (without any change in column
length), resolution, and efficien-
cy (theoretical plates) will decrease.
Smaller particles increase resolution,
efficiency, and retention but they also
will exponentially increase pressure
of the system: P α (1/dp
)2
. Modern
HPLC systems have increased their
ability to handle higher pressures and
often can handle increased pressure
from smaller particles. If smaller par-
ticles are needed to maximize resolu-
tion, then the chromatographer can
reduce column length to reduce pres-
sure and not effect efficiency dramat-
ically since efficiency is inversely pro-
portional to particle size and directly
proportional to length. The bene-
fits of this approach are shorter run
times, less solvent use since column
volume is reduced, and less backpres-
sure with increased resolution.
The diameter of a column becomes
important in the discussion of pres-
sure, flow, and column volume. Col-
umns of diameters between 3.9–
4.6 mm range are considered to be
standard bore. Diameters in the range
of 2.0–3.2 mm are called narrow bore.
Columns with diameters of 1.0 or less
are considered microbore or capillary
columns. The diameter of the column
effects peak height, which can also
affect efficiency as seen in Equation
6. Changes in column diameter must
also consider changes in flow rate
(which is the volume of mobile phase
divided by time) and linear veloci-
ty (µ), which is the distance mobile
phase travels over time. By adjusting
flow rate to maintain linear veloci-
ty, peak height is increased, and band
broadening is decreased allowing for
improved retention.
One of the final dimensions of a
column is pore size. The stationary
phase is composed of particles that
are riddled with spaces and open-
ings. The spaces allow for increased
surface area and interaction between
the target analytes and the stationary
phase. Typical pore sizes can range
from 50 Å to over one million Å. The
choice of pore size is dictated by the
approximate range of the molecu-
lar weights of the various target ana-
lytes. Most small to mid-range molec-
ular weight analysis (1000 mw) can
utilize 50–100 Å pores. Some special-
ty molecules with stereochemistry
considerations could require larger
pore sizes to accommodate steric in-
teractions with the stationary phase.
Pure Chromatography
ADVANTAGE
See What It Can Do for You and Your Lab
Sign up today to access Restek’s
years of chromatography knowledge at
www.restek.com/advantage
27
cannabissciencetech.com april 2021  
|  
cannabis science and technology®
analytical / navigating the lab
Small pores have larger amounts of
surface area than larger pores and al-
low for much more interaction be-
tween molecules and the
stationary phase.
Band Broadening
and Peak Shape
A final consideration on the resolution
of a method is the appearance of the
peaks. Most of the calculations for
peak height and peak width are made
for Gaussian peaks with equal symme-
try. However, as has been discussed the
chemistry of the mobile phase, station-
ary phase and column conditions can
contribute to distortions to the peak
symmetry and band broadening. Sym-
metry (T) of a peak is measured by di-
viding a peak down the from the apex
and comparing at 10% peak height the
ratio of the tailing side (B) to the ear-
lier fronting side (A) in the equation T
= B/A. For Gaussian peaks (Figure 8a)
the sides are equal, so the ratio is 1. In
fronting peaks (Figure 8b), the wider
side appears first so the ratio is less
than one, while tailing peaks (Figure
8c) have ratios greater than one.
In most cases, peaks that fall with-
in 0.9 to 1.3 are considered within ac-
ceptable range. Peak fronting can be
a result of not enough retention (k)
on the column (that is, peak capaci-
ty), or an effect of the matrix of the
sample having stronger elution pow-
er than the mobile phase. Fronting can
happen when the analyte is overloaded
on the column or in the detector and
may need dilution or a smaller injec-
tion volume to avoid saturation. Peak
tailing can be cause by many issues in-
cluding oversaturation of column or
detector, or diffusion in the flow path
by connectors, column voids and fit-
tings. Tailing can occur from pH ef-
fects if the pH of the mobile phase is
close to the pKa of the sample or an-
alytes. Increasing or decreasing the
pH two units from the target pKa will
reduce tailing. Peaks can be seen to
tail as columns age and more silanols
are exposed or if using columns with-
out end capping. The interaction with
these open silanols or the silica can
create the bleeding of peaks seen
in tailing.
Asymmetrical peaks can reduce res-
olution by decreasing efficiency and re-
tention. If the chromatogram shows
consistently asymmetrical peaks then
take care to examine all fittings, col-
umns, junctures for excess flow paths,
dead volume, and air incursions. If
the asymmetry persists examine the
sample dilution composition and try
to match the mobile phase composi-
tion. Mobile phase should measure 2
pH units above or below the sample or
target pKa. The chromatographer can
also check the age and condition of the
column and replace older columns or
change to columns with end capping to
increase symmetry.
Final Thoughts
The goal of method development is
resolution of all the target compounds
of interest in a sample. Sometimes
targets will have to be prioritized so
that maximum resolution is gained for
the analytes of interest. Those analytes
should be ideally near the middle of
your chromatogram away from the
solvent front and before any chances
of band broadening can occur.
Resolution is dependent on the key
factors of efficiency (N), retention (k),
and selectivity (α). Efficiency can be
increased by increasing column length
(L) or in some cases modifying or con-
trolling column temperature. Other
factors that can increase efficiency in-
clude reducing dead volume, peak tail-
ing and finally particle size. Selectivity
(α) and retention are linked together
and can be changed by changing sim-
ilar parameters such as the elution
power of the mobile phases, chang-
ing the pH of the mobile phase by the
use of additives or buffers, or by final-
ly changing the stationary
phase chemistry.
The first changes during method de-
velop often revolve around changes to
the chemistry and composition of the
mobile phase. If those changes fail to
produce adequate resolution, then the
analyst should start to examine chang-
es to physical system parameters and
finally the column or stationary phase
chemistry and dimensions. There are
often no shortcuts or out-of-the-box
solutions to method development. One
should always try to find references as
a starting point, but ultimately those
methods will have to be adjusted to
the particular parameters and idiosyn-
crasies of the individual system and
the target samples. The best approach
is to take changes one at a time and
work in a slow, steady pace to optimize
all the parameters of the mobile phase,
stationary phase, and system to achieve
the best method for your analysis.
Figure 8: Gaussian peaks: (a) equal; (b) fronting peaks; (c) tailing peaks.
cold extraction cannabis flower using ethanol like solvent

More Related Content

Similar to cold extraction cannabis flower using ethanol like solvent

Human Error and Investigations Training - September 28th and 29th 2016 - NIB...
Human Error  and Investigations Training - September 28th and 29th 2016 - NIB...Human Error  and Investigations Training - September 28th and 29th 2016 - NIB...
Human Error and Investigations Training - September 28th and 29th 2016 - NIB...Fiona Gilchrist
 
Online communication channels between physicians and pharma
Online communication channels between physicians and pharmaOnline communication channels between physicians and pharma
Online communication channels between physicians and pharmaEye For Pharma Events
 
Anandapharm summary 05092020 mw (v12)
Anandapharm summary 05092020 mw (v12)Anandapharm summary 05092020 mw (v12)
Anandapharm summary 05092020 mw (v12)WilliamRay38
 
Gregg_SapAnalysisConsultantTraining_160418
Gregg_SapAnalysisConsultantTraining_160418Gregg_SapAnalysisConsultantTraining_160418
Gregg_SapAnalysisConsultantTraining_160418Michelle D. Gregg
 
Bio Pharm Collaborations 9 09
Bio Pharm Collaborations 9 09Bio Pharm Collaborations 9 09
Bio Pharm Collaborations 9 09thess1121
 
Ilovepdf २ for the MRCOG part 1 mcqs book
Ilovepdf २ for the MRCOG part 1 mcqs bookIlovepdf २ for the MRCOG part 1 mcqs book
Ilovepdf २ for the MRCOG part 1 mcqs bookjuhi44349
 
Viropro investor presentation 01_apr11
Viropro investor presentation 01_apr11Viropro investor presentation 01_apr11
Viropro investor presentation 01_apr11rvdatar
 
Pharmacy School Essay Examples.pdf
Pharmacy School Essay Examples.pdfPharmacy School Essay Examples.pdf
Pharmacy School Essay Examples.pdfJanet Rose
 
Pharmacy School Essay Examples
Pharmacy School Essay ExamplesPharmacy School Essay Examples
Pharmacy School Essay ExamplesLinda Bryant
 
Eyf webinar sepa career fair 2010
Eyf webinar sepa career fair 2010Eyf webinar sepa career fair 2010
Eyf webinar sepa career fair 2010elliecantor
 
Handbookofmeatprocessing 130306012404-phpapp02 haccp
Handbookofmeatprocessing 130306012404-phpapp02 haccpHandbookofmeatprocessing 130306012404-phpapp02 haccp
Handbookofmeatprocessing 130306012404-phpapp02 haccpKhoirul Anam
 
SMi Group's Highly Potent Active Pharmaceutical ingredients USA 2019
SMi Group's Highly Potent Active Pharmaceutical ingredients USA 2019SMi Group's Highly Potent Active Pharmaceutical ingredients USA 2019
SMi Group's Highly Potent Active Pharmaceutical ingredients USA 2019Dale Butler
 
Are shitstorms the new arson? Getting your business through reputational sabo...
Are shitstorms the new arson? Getting your business through reputational sabo...Are shitstorms the new arson? Getting your business through reputational sabo...
Are shitstorms the new arson? Getting your business through reputational sabo...ESMT Berlin
 
Biotechnology 1
Biotechnology 1Biotechnology 1
Biotechnology 1sokraturk
 
coreybryant69_resume_Final
coreybryant69_resume_Finalcoreybryant69_resume_Final
coreybryant69_resume_Finalcorey bryant
 

Similar to cold extraction cannabis flower using ethanol like solvent (20)

Human Error and Investigations Training - September 28th and 29th 2016 - NIB...
Human Error  and Investigations Training - September 28th and 29th 2016 - NIB...Human Error  and Investigations Training - September 28th and 29th 2016 - NIB...
Human Error and Investigations Training - September 28th and 29th 2016 - NIB...
 
Online communication channels between physicians and pharma
Online communication channels between physicians and pharmaOnline communication channels between physicians and pharma
Online communication channels between physicians and pharma
 
Anandapharm summary 05092020 mw (v12)
Anandapharm summary 05092020 mw (v12)Anandapharm summary 05092020 mw (v12)
Anandapharm summary 05092020 mw (v12)
 
JTP_CV_english academic
JTP_CV_english academicJTP_CV_english academic
JTP_CV_english academic
 
Gregg_SapAnalysisConsultantTraining_160418
Gregg_SapAnalysisConsultantTraining_160418Gregg_SapAnalysisConsultantTraining_160418
Gregg_SapAnalysisConsultantTraining_160418
 
Bio Pharm Collaborations 9 09
Bio Pharm Collaborations 9 09Bio Pharm Collaborations 9 09
Bio Pharm Collaborations 9 09
 
Ilovepdf २ for the MRCOG part 1 mcqs book
Ilovepdf २ for the MRCOG part 1 mcqs bookIlovepdf २ for the MRCOG part 1 mcqs book
Ilovepdf २ for the MRCOG part 1 mcqs book
 
Viropro investor presentation 01_apr11
Viropro investor presentation 01_apr11Viropro investor presentation 01_apr11
Viropro investor presentation 01_apr11
 
Pharmacy School Essay Examples.pdf
Pharmacy School Essay Examples.pdfPharmacy School Essay Examples.pdf
Pharmacy School Essay Examples.pdf
 
Pharmacy School Essay Examples
Pharmacy School Essay ExamplesPharmacy School Essay Examples
Pharmacy School Essay Examples
 
Eyf webinar sepa career fair 2010
Eyf webinar sepa career fair 2010Eyf webinar sepa career fair 2010
Eyf webinar sepa career fair 2010
 
Handbookofmeatprocessing 130306012404-phpapp02 haccp
Handbookofmeatprocessing 130306012404-phpapp02 haccpHandbookofmeatprocessing 130306012404-phpapp02 haccp
Handbookofmeatprocessing 130306012404-phpapp02 haccp
 
SMi Group's Highly Potent Active Pharmaceutical ingredients USA 2019
SMi Group's Highly Potent Active Pharmaceutical ingredients USA 2019SMi Group's Highly Potent Active Pharmaceutical ingredients USA 2019
SMi Group's Highly Potent Active Pharmaceutical ingredients USA 2019
 
Segra
Segra Segra
Segra
 
Counterfeit medicine
Counterfeit medicineCounterfeit medicine
Counterfeit medicine
 
Are shitstorms the new arson? Getting your business through reputational sabo...
Are shitstorms the new arson? Getting your business through reputational sabo...Are shitstorms the new arson? Getting your business through reputational sabo...
Are shitstorms the new arson? Getting your business through reputational sabo...
 
Biotechnology 1
Biotechnology 1Biotechnology 1
Biotechnology 1
 
Pharma Assets Portal
Pharma Assets PortalPharma Assets Portal
Pharma Assets Portal
 
coreybryant69_resume_Final
coreybryant69_resume_Finalcoreybryant69_resume_Final
coreybryant69_resume_Final
 
LMF resume 2015 v11
LMF  resume 2015 v11LMF  resume 2015 v11
LMF resume 2015 v11
 

Recently uploaded

Call Girls Basavanagudi Just Call 👗 7737669865 👗 Top Class Call Girl Service ...
Call Girls Basavanagudi Just Call 👗 7737669865 👗 Top Class Call Girl Service ...Call Girls Basavanagudi Just Call 👗 7737669865 👗 Top Class Call Girl Service ...
Call Girls Basavanagudi Just Call 👗 7737669865 👗 Top Class Call Girl Service ...amitlee9823
 
Best VIP Call Girls Noida Sector 47 Call Me: 8448380779
Best VIP Call Girls Noida Sector 47 Call Me: 8448380779Best VIP Call Girls Noida Sector 47 Call Me: 8448380779
Best VIP Call Girls Noida Sector 47 Call Me: 8448380779Delhi Call girls
 
Escorts Service Basapura ☎ 7737669865☎ Book Your One night Stand (Bangalore)
Escorts Service Basapura ☎ 7737669865☎ Book Your One night Stand (Bangalore)Escorts Service Basapura ☎ 7737669865☎ Book Your One night Stand (Bangalore)
Escorts Service Basapura ☎ 7737669865☎ Book Your One night Stand (Bangalore)amitlee9823
 
Design Inspiration for College by Slidesgo.pptx
Design Inspiration for College by Slidesgo.pptxDesign Inspiration for College by Slidesgo.pptx
Design Inspiration for College by Slidesgo.pptxTusharBahuguna2
 
Chapter 19_DDA_TOD Policy_First Draft 2012.pdf
Chapter 19_DDA_TOD Policy_First Draft 2012.pdfChapter 19_DDA_TOD Policy_First Draft 2012.pdf
Chapter 19_DDA_TOD Policy_First Draft 2012.pdfParomita Roy
 
Verified Trusted Call Girls Adugodi💘 9352852248 Good Looking standard Profil...
Verified Trusted Call Girls Adugodi💘 9352852248  Good Looking standard Profil...Verified Trusted Call Girls Adugodi💘 9352852248  Good Looking standard Profil...
Verified Trusted Call Girls Adugodi💘 9352852248 Good Looking standard Profil...kumaririma588
 
Case Study of Hotel Taj Vivanta, Pune
Case Study of Hotel Taj Vivanta, PuneCase Study of Hotel Taj Vivanta, Pune
Case Study of Hotel Taj Vivanta, PuneLukeKholes
 
Kala jadu for love marriage | Real amil baba | Famous amil baba | kala jadu n...
Kala jadu for love marriage | Real amil baba | Famous amil baba | kala jadu n...Kala jadu for love marriage | Real amil baba | Famous amil baba | kala jadu n...
Kala jadu for love marriage | Real amil baba | Famous amil baba | kala jadu n...babafaisel
 
Call Girls in Kalkaji Delhi 8264348440 call girls ❤️
Call Girls in Kalkaji Delhi 8264348440 call girls ❤️Call Girls in Kalkaji Delhi 8264348440 call girls ❤️
Call Girls in Kalkaji Delhi 8264348440 call girls ❤️soniya singh
 
2-tool presenthdbdbdbdbddhdhddation.pptx
2-tool presenthdbdbdbdbddhdhddation.pptx2-tool presenthdbdbdbdbddhdhddation.pptx
2-tool presenthdbdbdbdbddhdhddation.pptxsuhanimunjal27
 
Top Rated Pune Call Girls Koregaon Park ⟟ 6297143586 ⟟ Call Me For Genuine S...
Top Rated  Pune Call Girls Koregaon Park ⟟ 6297143586 ⟟ Call Me For Genuine S...Top Rated  Pune Call Girls Koregaon Park ⟟ 6297143586 ⟟ Call Me For Genuine S...
Top Rated Pune Call Girls Koregaon Park ⟟ 6297143586 ⟟ Call Me For Genuine S...Call Girls in Nagpur High Profile
 
Peaches App development presentation deck
Peaches App development presentation deckPeaches App development presentation deck
Peaches App development presentation decktbatkhuu1
 
call girls in Vasundhra (Ghaziabad) 🔝 >༒8448380779 🔝 genuine Escort Service 🔝...
call girls in Vasundhra (Ghaziabad) 🔝 >༒8448380779 🔝 genuine Escort Service 🔝...call girls in Vasundhra (Ghaziabad) 🔝 >༒8448380779 🔝 genuine Escort Service 🔝...
call girls in Vasundhra (Ghaziabad) 🔝 >༒8448380779 🔝 genuine Escort Service 🔝...Delhi Call girls
 
Booking open Available Pune Call Girls Kirkatwadi 6297143586 Call Hot Indian...
Booking open Available Pune Call Girls Kirkatwadi  6297143586 Call Hot Indian...Booking open Available Pune Call Girls Kirkatwadi  6297143586 Call Hot Indian...
Booking open Available Pune Call Girls Kirkatwadi 6297143586 Call Hot Indian...Call Girls in Nagpur High Profile
 
VVIP Pune Call Girls Hadapsar (7001035870) Pune Escorts Nearby with Complete ...
VVIP Pune Call Girls Hadapsar (7001035870) Pune Escorts Nearby with Complete ...VVIP Pune Call Girls Hadapsar (7001035870) Pune Escorts Nearby with Complete ...
VVIP Pune Call Girls Hadapsar (7001035870) Pune Escorts Nearby with Complete ...Call Girls in Nagpur High Profile
 
Brookefield Call Girls: 🍓 7737669865 🍓 High Profile Model Escorts | Bangalore...
Brookefield Call Girls: 🍓 7737669865 🍓 High Profile Model Escorts | Bangalore...Brookefield Call Girls: 🍓 7737669865 🍓 High Profile Model Escorts | Bangalore...
Brookefield Call Girls: 🍓 7737669865 🍓 High Profile Model Escorts | Bangalore...amitlee9823
 
VVIP CALL GIRLS Lucknow 💓 Lucknow < Renuka Sharma > 7877925207 Escorts Service
VVIP CALL GIRLS Lucknow 💓 Lucknow < Renuka Sharma > 7877925207 Escorts ServiceVVIP CALL GIRLS Lucknow 💓 Lucknow < Renuka Sharma > 7877925207 Escorts Service
VVIP CALL GIRLS Lucknow 💓 Lucknow < Renuka Sharma > 7877925207 Escorts Servicearoranaina404
 
DragonBall PowerPoint Template for demo.pptx
DragonBall PowerPoint Template for demo.pptxDragonBall PowerPoint Template for demo.pptx
DragonBall PowerPoint Template for demo.pptxmirandajeremy200221
 

Recently uploaded (20)

Call Girls Basavanagudi Just Call 👗 7737669865 👗 Top Class Call Girl Service ...
Call Girls Basavanagudi Just Call 👗 7737669865 👗 Top Class Call Girl Service ...Call Girls Basavanagudi Just Call 👗 7737669865 👗 Top Class Call Girl Service ...
Call Girls Basavanagudi Just Call 👗 7737669865 👗 Top Class Call Girl Service ...
 
Best VIP Call Girls Noida Sector 47 Call Me: 8448380779
Best VIP Call Girls Noida Sector 47 Call Me: 8448380779Best VIP Call Girls Noida Sector 47 Call Me: 8448380779
Best VIP Call Girls Noida Sector 47 Call Me: 8448380779
 
Escorts Service Basapura ☎ 7737669865☎ Book Your One night Stand (Bangalore)
Escorts Service Basapura ☎ 7737669865☎ Book Your One night Stand (Bangalore)Escorts Service Basapura ☎ 7737669865☎ Book Your One night Stand (Bangalore)
Escorts Service Basapura ☎ 7737669865☎ Book Your One night Stand (Bangalore)
 
young call girls in Vivek Vihar🔝 9953056974 🔝 Delhi escort Service
young call girls in Vivek Vihar🔝 9953056974 🔝 Delhi escort Serviceyoung call girls in Vivek Vihar🔝 9953056974 🔝 Delhi escort Service
young call girls in Vivek Vihar🔝 9953056974 🔝 Delhi escort Service
 
Design Inspiration for College by Slidesgo.pptx
Design Inspiration for College by Slidesgo.pptxDesign Inspiration for College by Slidesgo.pptx
Design Inspiration for College by Slidesgo.pptx
 
Chapter 19_DDA_TOD Policy_First Draft 2012.pdf
Chapter 19_DDA_TOD Policy_First Draft 2012.pdfChapter 19_DDA_TOD Policy_First Draft 2012.pdf
Chapter 19_DDA_TOD Policy_First Draft 2012.pdf
 
Verified Trusted Call Girls Adugodi💘 9352852248 Good Looking standard Profil...
Verified Trusted Call Girls Adugodi💘 9352852248  Good Looking standard Profil...Verified Trusted Call Girls Adugodi💘 9352852248  Good Looking standard Profil...
Verified Trusted Call Girls Adugodi💘 9352852248 Good Looking standard Profil...
 
young call girls in Pandav nagar 🔝 9953056974 🔝 Delhi escort Service
young call girls in Pandav nagar 🔝 9953056974 🔝 Delhi escort Serviceyoung call girls in Pandav nagar 🔝 9953056974 🔝 Delhi escort Service
young call girls in Pandav nagar 🔝 9953056974 🔝 Delhi escort Service
 
Case Study of Hotel Taj Vivanta, Pune
Case Study of Hotel Taj Vivanta, PuneCase Study of Hotel Taj Vivanta, Pune
Case Study of Hotel Taj Vivanta, Pune
 
Kala jadu for love marriage | Real amil baba | Famous amil baba | kala jadu n...
Kala jadu for love marriage | Real amil baba | Famous amil baba | kala jadu n...Kala jadu for love marriage | Real amil baba | Famous amil baba | kala jadu n...
Kala jadu for love marriage | Real amil baba | Famous amil baba | kala jadu n...
 
Call Girls in Kalkaji Delhi 8264348440 call girls ❤️
Call Girls in Kalkaji Delhi 8264348440 call girls ❤️Call Girls in Kalkaji Delhi 8264348440 call girls ❤️
Call Girls in Kalkaji Delhi 8264348440 call girls ❤️
 
2-tool presenthdbdbdbdbddhdhddation.pptx
2-tool presenthdbdbdbdbddhdhddation.pptx2-tool presenthdbdbdbdbddhdhddation.pptx
2-tool presenthdbdbdbdbddhdhddation.pptx
 
Top Rated Pune Call Girls Koregaon Park ⟟ 6297143586 ⟟ Call Me For Genuine S...
Top Rated  Pune Call Girls Koregaon Park ⟟ 6297143586 ⟟ Call Me For Genuine S...Top Rated  Pune Call Girls Koregaon Park ⟟ 6297143586 ⟟ Call Me For Genuine S...
Top Rated Pune Call Girls Koregaon Park ⟟ 6297143586 ⟟ Call Me For Genuine S...
 
Peaches App development presentation deck
Peaches App development presentation deckPeaches App development presentation deck
Peaches App development presentation deck
 
call girls in Vasundhra (Ghaziabad) 🔝 >༒8448380779 🔝 genuine Escort Service 🔝...
call girls in Vasundhra (Ghaziabad) 🔝 >༒8448380779 🔝 genuine Escort Service 🔝...call girls in Vasundhra (Ghaziabad) 🔝 >༒8448380779 🔝 genuine Escort Service 🔝...
call girls in Vasundhra (Ghaziabad) 🔝 >༒8448380779 🔝 genuine Escort Service 🔝...
 
Booking open Available Pune Call Girls Kirkatwadi 6297143586 Call Hot Indian...
Booking open Available Pune Call Girls Kirkatwadi  6297143586 Call Hot Indian...Booking open Available Pune Call Girls Kirkatwadi  6297143586 Call Hot Indian...
Booking open Available Pune Call Girls Kirkatwadi 6297143586 Call Hot Indian...
 
VVIP Pune Call Girls Hadapsar (7001035870) Pune Escorts Nearby with Complete ...
VVIP Pune Call Girls Hadapsar (7001035870) Pune Escorts Nearby with Complete ...VVIP Pune Call Girls Hadapsar (7001035870) Pune Escorts Nearby with Complete ...
VVIP Pune Call Girls Hadapsar (7001035870) Pune Escorts Nearby with Complete ...
 
Brookefield Call Girls: 🍓 7737669865 🍓 High Profile Model Escorts | Bangalore...
Brookefield Call Girls: 🍓 7737669865 🍓 High Profile Model Escorts | Bangalore...Brookefield Call Girls: 🍓 7737669865 🍓 High Profile Model Escorts | Bangalore...
Brookefield Call Girls: 🍓 7737669865 🍓 High Profile Model Escorts | Bangalore...
 
VVIP CALL GIRLS Lucknow 💓 Lucknow < Renuka Sharma > 7877925207 Escorts Service
VVIP CALL GIRLS Lucknow 💓 Lucknow < Renuka Sharma > 7877925207 Escorts ServiceVVIP CALL GIRLS Lucknow 💓 Lucknow < Renuka Sharma > 7877925207 Escorts Service
VVIP CALL GIRLS Lucknow 💓 Lucknow < Renuka Sharma > 7877925207 Escorts Service
 
DragonBall PowerPoint Template for demo.pptx
DragonBall PowerPoint Template for demo.pptxDragonBall PowerPoint Template for demo.pptx
DragonBall PowerPoint Template for demo.pptx
 

cold extraction cannabis flower using ethanol like solvent

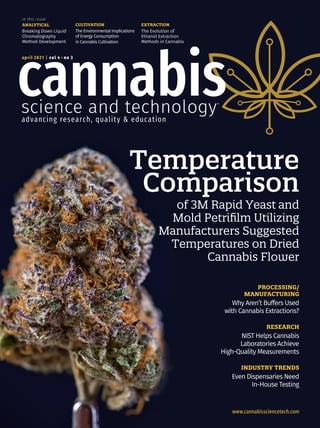
  • 1. www.cannabissciencetech.com april 2021 | vol 4 ● no 3 Temperature Comparison of 3M Rapid Yeast and Mold Petrifilm Utilizing Manufacturers Suggested Temperatures on Dried Cannabis Flower ANALYTICAL Breaking Down Liquid Chromatography Method Development in this issue CULTIVATION The Environmental Implications of Energy Consumption in Cannabis Cultivation EXTRACTION The Evolution of Ethanol Extraction Methods in Cannabis PROCESSING/ MANUFACTURING Why Aren’t Buffers Used with Cannabis Extractions? RESEARCH NIST Helps Cannabis Laboratories Achieve High-Quality Measurements INDUSTRY TRENDS Even Dispensaries Need In-House Testing
  • 2.
  • 3. Flavonoids are found in many colorful fruits, leafy greens, vegetables, and citrus. They are generally associated with the defense system of the plant and protect the plant from hungry herbivores and disease. There are over 5,000 various forms of flavonoids identified throughout the world which are generally found in the leaves, roots, and stems. In cannabis, the highest concentrations are present in the leaves, stems, and pollen. 1 There are approximately twenty flavonoid compounds found in cannabis including two that are wholly unique to the plant, cannflavin A, and cannflavin B. The flavonoids exhibiting the highest concentration in cannabis include kaempferol, quercetin, apigenin, luteolin, vitexin, isovitexin, and orientin. Cannabis research involving flavonoids has indicated activation of both CB1 and CB2 receptors2 in addition to playing a role in the THC metabolism pathway. These discoveries indicate that flavonoids competitively bind to both the CB1 and CB2 receptors3 and provide a more therapeutic experience. Adding to the entourage effect is not the only positive attribute of flavonoids. They also contribute a wide range of overall health benefits including anti-cancer, anti-aging, DNA repair, and anti-inflammatory4 qualities just to name a few. As consumers of cannabis become more aware of the full capacity of the plant, analysis of the entourage compounds associated with the various strains should become commonplace. In an effort to provide the end user with a more complete experience, Hamilton Company has developed a method to confirm the 7 most common flavonoids found in cannabis utilizing the PRP-1 5 µm HPLC column. The polymeric stationary phase used in the PRP-1 column yield good peak shape while adding value to the identification. Sample preparation is kept to a minimum with only a 15 minute sonication extraction using ethanol:water 3:1. After centrifugation, the sample is injected. There is no need to filter the sample, allowing faster analysis with the dilute and shoot sampling protocol while still maintaining consistent results. This method utilizes tetrahydrofuran and formic acid as mobile phases and provides baseline separation for all the components in under twelve minutes. 1 ) Flores-Sanchez, I; Verpoorte, R. Phytochem Rev (2008) 7:615–639. 2 ) Barrett, M; Scutt, A; Evans, F. Experientia. (1986) 15;42(4):452-3. 3 ) Pollastro, F; Minassi, A; Luigia-Grazia, F. Curr Med Chem . 2018;25(10):1160-1185. 4 ) Seelinger G, Merfort I, Schempp CM. Planta Med. 2008 74(14):1667-77. Column Information Packing Material PRP-1, 5 µm P/N 79444 Chromatographic Conditions Gradient 0.0 – 1.0 min 5% B 1.0 – 1.5 min 5 – 30% B 1.5 – 8.0 min 30% B 8.0 – 13.0 min 30 – 65% B Temperature 35 °C Injection Volume 5 µL Detection UV at 360 nm Dimensions 150 x 4.1 mm Eluent A 10 mM Formic Acid Eluent B Tetrahydrofuran Flow Rate 1.0 mL/min. Compounds: 1. Isovitexin 2. Orientin 3. Vitexin 4. Luteolin 5. Apigenin 6. Quercetin 7. Kaempferol 0 2 1 2 4 3 5 6 7 4 6 8 10 12 14 0 2 1 2 4 5 6 7 4 6 8 10 12 14 Hemp Extract Author: Adam L. Moore, PhD Cannabinoid’s Wingman? Determination of Flavonoids in Hemp by Reversed-Phase HPLC ©2020 Hamilton Company. All rights reserved. All other trademarks are owned and/or registered by Hamilton Company in the U.S. and/or other countries. Lit. No. L80114 — 10/2020 For more information on Hamilton HPLC columns and accessories or to order a product, please visit www.hamiltoncompany.com or call (800) 648-5950 in the US or +40-356-635-055 in Europe.
  • 4. cannabis science and technology®   |   vol. 4 no. 3 cannabissciencetech.com 4 4 8 5 F U S Hi g h w a y O n e S o u t h , S ui t e 2 1 0 | I s e l in , NJ 0 8 8 3 0 | 7 3 2 . 5 9 6 . 0 2 76 | Fa x : 7 3 2 . 6 47.1 2 3 5 Michael J. Tessalone Senior Vice President, Industry Sciences MTessalone@ mjhlifesciences.com Stephanie Shaffer Group Publisher SShaffer@mjhlifesciences.com Mark Davis Director of Sales MDavis@mjhlifesciences.com David Gordon Senior Account Manager DGordon@mjhlifesciences.com Edward Fantuzzi Sales Director EFantuzzi@mjhlifesciences.com Brianne Molnar Sales Manager BMolnar@mjhlifesciences.com Oliver Waters Sales Manager OWaters@mjhlifesciences.com Liz McLean Sales Executive LMcLean@mjhlifesciences.com Michael Kushner Senior Director, Digital Media MKushner@mjhlifesciences.com Kristen Moore Webcast Operations Manager KMoore@mjhlifesciences.com Vania Oliveira Project Manager VOliveira@mjhlifesciences.com Sabina Advani Digital Production Manager SAdvani@mjhlifesciences.com Kaylynn Chiarello-Ebner Managing Editor, Special Projects KEbner@mjhlifesciences.com Melissa Stillwell C.A.S.T. Data and List Information MStillwell@mjhlifesciences.com Alexa Rockenstein Permissions ARockenstein@ mjhlifesciences.com Megan L’Heureux Group Editorial Director MLheureux@mjhlifesciences.com Madeline Colli Associate Editor MColli@mjhlifesciences.com Alissa Marrapodi Custom Content Writer AMarrapodi@ mjhlifesciences.com Josh Crossney Contributing Editor josh@jcanna.com Brianne Pangaro Marketing Associate BPangaro@mjhlifesciences.com Ariana Mexquititla Graphic Designer Gwendolyn Salas Senior Art Director Melissa Feinen Creative Director, Publishing corporate Chairman & Founder Mike Hennessy, Sr Vice Chairman Jack Lepping President & CEO Mike Hennessy, Jr Chief Financial Officer Neil Glasser, CPA/CFE Chief Marketing Officer Michael Baer Executive Vice President, Global Medical Affairs & Corporate Development Joe Petroziello Senior Vice President, Content Silas Inman Senior Vice President Operations Michael Ball Senior Vice President, I.T. & Enterprise Systems John Moricone Vice President, Human Resources & Administration Shari Lundenberg Vice President, Mergers & Acquisitions Chris Hennessy Executive Creative Director, Creative Services Jeff Brown MANUSCRIPTS: To discuss possible article topics or obtain man- uscript preparation guidelines, contact the editor-in-chief at: (732) 346-3051, e-mail: MLheureux@mjhlifesciences.com. Cannabis Science and Technology welcomes unsolicited articles, manuscripts, photographs, illustrations, and other materials but cannot be held responsible for their safekeeping or return. Every precaution is taken to ensure accuracy, but Cannabis Science and Technology cannot accept responsibility for the accuracy of information supplied herein or for any opinion expressed. SUBSCRIPTIONS: For subscription and circulation information: Cannabis Science and Technology, PO Box 457, Cranbury, NJ 08512-0457, or e-mail mmhinfo@mmhgroup.com. Delivery of Cannabis Science and Technology outside the United States is 14 days after printing. CHANGE OF ADDRESS: Send change of address to Cannabis Science and Technology, PO Box 457, Cranbury, NJ 08512-0457; alternately, send change via e-mail to fulfill@mjhassoc.com or go to the following URL: http://mmhpubs.mmhgroup.com/Welcome.aspx?pubid=CNST Allow four to six weeks for change. Cannabis Science and Technology (Print ISSN: 2643-8844, Digital ISSN: 2643-8852) is published 9 times/year by MultiMedia Healthcare LLC, 2 Clarke Drive, Suite 100, Cranbury, NJ 08512. POSTMASTER: Please send address changes to CANNABIS Science and Technology, PO Box 457, Cranbury, NJ 08512-0457. Return Undeliverable Canadian Addresses to: IMEX Global Solutions, P. O. Box 25542, London, ON N6C 6B2, CANADA. Canadian G.S.T. number: R-124213133RT001. Printed in the U.S.A. C.A.S.T. DATA AND LIST INFORMATION: Contact Melissa Stillwell, tel. (218) 740-6831, e-mail MStillwell@mjhlifesciences.com. REPRINTS: Reprints of all articles in this issue and past issues of this publication are available (500 minimum). Licensing and Reuse of Content: Contact Stephanie Shaffer about available usages, license fees, and artwork at SShaffer@mjhlifesciences.com for more information. INTERNATIONAL LICENSING: Contact Alexa Rockenstein, e-mail ARockenstein@mjhlifesciences.com. © 2020 MultiMedia Pharma Sciences LLC All rights reserved. No part of this publication may be reproduced or transmitted in any form or by any means, electronic or mechanical including by photocopy, recording, or information storage and retrieval without permission in writing from the publisher. Author- ization to photocopy items for internal/educational or personal use, or the in- ternal/educational or personal use of specific clients is granted by MultiMedia Pharma Sciences LLC for libraries and other users registered with the Copy- right Clearance Center, 222 Rosewood Dr. Danvers, MA 01923, 978-750-8400 fax 978-646-8700 or visit http://www.copyright.com online. For uses beyond those listed above, please direct your written request to Permission Dept. e-mail: ARockenstein@mjhlifesciences.com MultiMedia Pharma Sciences LLC provides certain customer contact data (such as customer’s name, addresses, phone numbers, and e-mail addresses) to third parties who wish to promote relevant products, services, and other opportunities that may be of interest to you. If you do not want MultiMedia Pharma Sciences LLC to make your contact information available to third par- ties for marketing purposes, simply e-mail mmhinfo@mmhgroup.com and a customer service representative will assist you in removing your name from MultiMedia Pharma Sciences LLC lists. Cannabis Science and Technology does not verify any claims or other informa- tion ­ appearing in any of the advertisements contained in the publication, and cannot take responsibility for any losses or other damages incurred by readers in reliance of such content. To subscribe, e-mail mmhinfo@mmhgroup.com. 5 0 % Recycled Pa p e r 1 0 - 2 0 % Post Consume r W a s t e N A T I O N A L C A NNABIS INDUSTRY A S S O C I A T I O N MEMBER MANUSCRIPTS: To discuss possible article topics or obtain man- uscript preparation guidelines, contact the editor-in-chief at: (732) 346-3051, e-mail: MLheureux@mjhlifesciences.com. Cannabis Science and Technology welcomes unsolicited articles, manuscripts, photographs, illustrations, and other materials but cannot be held responsible for their safekeeping or return. Every precaution is taken to ensure accuracy, but Cannabis Science and Technology cannot accept responsibility for the accuracy of information supplied herein or for any opinion expressed. SUBSCRIPTIONS: For subscription and circulation information: Cannabis Science and Technology, PO Box 457, Cranbury, NJ 08512-0457, or e-mail mmhinfo@mmhgroup.com. Delivery of Cannabis Science and Technology outside the United States is 14 days after printing. CHANGE OF ADDRESS: Send change of address to Cannabis Science and Technology, PO Box 457, Cranbury, NJ 08512-0457; alternately, send change via e-mail to fulfill@mjhassoc.com or go to the following URL: http://mmhpubs.mmhgroup.com/Welcome.aspx?pubid=CNST Allow four to six weeks for change. Cannabis Science and Technology (Print ISSN: 2643-8844, Digital ISSN: 2643-8852) is published 9 times/year by MultiMedia Healthcare LLC, 2 Clarke Drive, Suite 100, Cranbury, NJ 08512. POSTMASTER: Please send address changes to CANNABIS Science and Technology, PO Box 457, Cranbury, NJ 08512-0457. Return Undeliverable Canadian Addresses to: IMEX Global Solutions, P. O. Box 25542, London, ON N6C 6B2, CANADA. Canadian G.S.T. number: R-124213133RT001. Printed in the U.S.A. C.A.S.T. DATA AND LIST INFORMATION: Contact Melissa Stillwell, tel. (218) 740-6831, e-mail MStillwell@mjhlifesciences.com. REPRINTS: Reprints of all articles in this issue and past issues of this publication are available (500 minimum). Licensing and Reuse of Content: Contact Stephanie Shaffer about available usages, license fees, and artwork at SShaffer@mjhlifesciences.com for more information. INTERNATIONAL LICENSING: Contact Alexa Rockenstein, e-mail ARockenstein@mjhlifesciences.com. © 2020 MultiMedia Pharma Sciences LLC All rights reserved. No part of this publication may be reproduced or transmitted in any form or by any means, electronic or mechanical including by photocopy, recording, or information storage and retrieval without permission in writing from the publisher. Author- ization to photocopy items for internal/educational or personal use, or the in- ternal/educational or personal use of specific clients is granted by MultiMedia Pharma Sciences LLC for libraries and other users registered with the Copy- right Clearance Center, 222 Rosewood Dr. Danvers, MA 01923, 978-750-8400 fax 978-646-8700 or visit http://www.copyright.com online. For uses beyond those listed above, please direct your written request to Permission Dept. e-mail: ARockenstein@mjhlifesciences.com MultiMedia Pharma Sciences LLC provides certain customer contact data (such as customer’s name, addresses, phone numbers, and e-mail addresses) to third parties who wish to promote relevant products, services, and other opportunities that may be of interest to you. If you do not want MultiMedia Pharma Sciences LLC to make your contact information available to third par- ties for marketing purposes, simply e-mail mmhinfo@mmhgroup.com and a customer service representative will assist you in removing your name from MultiMedia Pharma Sciences LLC lists. Cannabis Science and Technology does not verify any claims or other informa- tion ­ appearing in any of the advertisements contained in the publication, and cannot take responsibility for any losses or other damages incurred by readers in reliance of such content. To subscribe, e-mail mmhinfo@mmhgroup.com. 5 0 % Recycled Pa p e r 1 0 - 2 0 % Post Consume r W a s t e MANUSCRIPTS: To discuss possible article topics or obtain man- uscript preparation guidelines, contact the editor-in-chief at: (732) 346-3051, e-mail: MLheureux@mjhlifesciences.com. Cannabis Science and Technology welcomes unsolicited articles, manuscripts, photographs, illustrations, and other materials but cannot be held responsible for their safekeeping or return. Every precaution is taken to ensure accuracy, but Cannabis Science and Technology cannot accept responsibility for the accuracy of information supplied herein or for any opinion expressed. SUBSCRIPTIONS: For subscription and circulation information: Cannabis Science and Technology, PO Box 457, Cranbury, NJ 08512-0457, or e-mail mmhinfo@mmhgroup.com. Delivery of Cannabis Science and Technology outside the United States is 14 days after printing. CHANGE OF ADDRESS: Send change of address to Cannabis Science and Technology, PO Box 457, Cranbury, NJ 08512-0457; alternately, send change via e-mail to fulfill@mjhassoc.com or go to the following URL: http://mmhpubs.mmhgroup.com/Welcome.aspx?pubid=CNST Allow four to six weeks for change. Cannabis Science and Technology (Print ISSN: 2643-8844, Digital ISSN: 2643-8852) is published 9 times/year by MultiMedia Healthcare LLC, 2 Clarke Drive, Suite 100, Cranbury, NJ 08512. POSTMASTER: Please send address changes to CANNABIS Science and Technology, PO Box 457, Cranbury, NJ 08512-0457. Return Undeliverable Canadian Addresses to: IMEX Global Solutions, P. O. Box 25542, London, ON N6C 6B2, CANADA. Canadian G.S.T. number: R-124213133RT001. Printed in the U.S.A. C.A.S.T. DATA AND LIST INFORMATION: Contact Melissa Stillwell, tel. (218) 740-6831, e-mail MStillwell@mjhlifesciences.com. REPRINTS: Reprints of all articles in this issue and past issues of this publication are available (500 minimum). Licensing and Reuse of Content: Contact Stephanie Shaffer about available usages, license fees, and artwork at SShaffer@mjhlifesciences.com for more information. INTERNATIONAL LICENSING: Contact Alexa Rockenstein, e-mail ARockenstein@mjhlifesciences.com. © 2020 MultiMedia Pharma Sciences LLC All rights reserved. No part of this publication may be reproduced or transmitted in any form or by any means, electronic or mechanical including by photocopy, recording, or information storage and retrieval without permission in writing from the publisher. Author- ization to photocopy items for internal/educational or personal use, or the in- ternal/educational or personal use of specific clients is granted by MultiMedia Pharma Sciences LLC for libraries and other users registered with the Copy- right Clearance Center, 222 Rosewood Dr. Danvers, MA 01923, 978-750-8400 fax 978-646-8700 or visit http://www.copyright.com online. For uses beyond those listed above, please direct your written request to Permission Dept. e-mail: ARockenstein@mjhlifesciences.com MultiMedia Pharma Sciences LLC provides certain customer contact data (such as customer’s name, addresses, phone numbers, and e-mail addresses) to third parties who wish to promote relevant products, services, and other opportunities that may be of interest to you. If you do not want MultiMedia Pharma Sciences LLC to make your contact information available to third par- ties for marketing purposes, simply e-mail mmhinfo@mmhgroup.com and a customer service representative will assist you in removing your name from MultiMedia Pharma Sciences LLC lists. Cannabis Science and Technology does not verify any claims or other informa- tion ­ appearing in any of the advertisements contained in the publication, and cannot take responsibility for any losses or other damages incurred by readers in reliance of such content. To subscribe, e-mail mmhinfo@mmhgroup.com. 5 0 % Recycled Pa p e r 1 0 - 2 0 % Post Consume r W a s t e N A T I O N A L C A NNABIS INDUSTRY A S S O C I A T I O N MEMBER
  • 5. 5 cannabissciencetech.com april 2021   |   cannabis science and technology® editorial advisory board members c a n n a b i s s c i e n ce a n d te c h n o lo g y ® april 2021 | vol 4 • no 3 Cannabis Science and Technology® ’s Editorial Advisory Board is a group of distinguished individuals assembled to help the publication fulfill its editorial mission to educate the legal cannabis industry about the science and technology of analytical testing and quality control. With recognized expertise in a wide range of areas, board members perform various functions, such as suggesting authors and topics for coverage, reviewing manuscripts, and providing the editor with general direction and feedback. We are indebted to these individuals for their contributions to the publication and to the cannabis community as a whole. SUSAN AUDINO S.A.Audino & Associates, LLC BOB CLIFFORD Shimadzu Scientific Instruments DOUGLAS DUNCAN CannaSafe ASHLEE GERARDI Restek Corporation JACKLYN GREEN Agate Biosciences JACK HENION Henion Enterprises ZAC HILDENBRAND Inform Environmental, LLC KARAN KAPOOR KapoorAg Consulting Inc. AUTUMN KARCEY Cultivo, Inc. BENJAMIN A. KATCHMAN PathogenDx Inc. JULIE KOWALSKI JA Kowalski Science Support LLC ALLEGRA LEGHISSA Shimadzu France WILLIAM LEVINE CannRx Technology Inc. ANTHONY MACHERONE Agilent Technologies, Johns Hopkins University School of Medicine SANDY MANGAN SPEX SamplePrep LLC DAVID (DEDI) MEIRI Laboratory of Cancer Biology and Cannabinoid Research, Technion Israel Institute of Technology DAVID L. NATHAN, MD, DFAPA Princeton Psychiatry & Consulting, LLC RICHARD SAMS KCA Laboratories KEVIN SCHUG Department of Chemistry & Biochemistry, The University of Texas at Arlington BRIAN SMITH Big Sur Scientific KATHERINE STENERSON MilliporeSigma
  • 6. cannabis science and technology®   |   vol. 4 no. 3 cannabissciencetech.com 6 contents c a n n a b i s s c i e n ce a n d te c h n o lo g y ® | april 2021 |  vol 4 • no 3 ■ CANNABIS ANALYSIS 10 Why Dispensaries Need In-House Testing BRIAN C. SMITH Mislabeled cannabis medicines are an on-going problem; here we discuss appropriate technologies for cannabis dispensaries to do their own testing. ■ EXTRACTION SCIENCE 13 The Evolution of Ethanol Extraction Methods in Cannabis LO FRIESEN A review of the evolution of the ethanol extraction method within the cannabis industry, where it stands today, and the other alcohols that are being introduced to the cannabis extraction space. ■ NAVIGATING THE LABYRINTH: CHALLENGES IN THE CANNABIS LABORATORY 17 Looking with Light: Breaking Down Liquid Chromatography Method Development PATRICIA L. ATKINS A deeper look into the chemistry, physics, and methodology of HPLC methods. ■ CANNABIS CROSSROADS 29 Is This Cannabis or Hemp—NIST Helps Cannabis Laboratories Achieve High-Quality Measurements JOSHUA CROSSNEY Dr. Walter Wilson discusses NIST's focus on developing cannabis reference materials and a quality assurance program (CannaQAP). ■ PEER-REVIEWED ARTICLE 32 Temperature Comparison of 3M Rapid Yeast and Mold Petrifilm Utilizing Manufacturer’s Suggested Temperatures on Dried Cannabis Flower (Cannabis spp.) ANTHONY J. REPAY In this study, dried cannabis flower found to have yeast and mold during compliance screening were randomly chosen to be plated at two different incubation temperatures to compare total amount of yeast and mold growth. DEPARTMENTS 05  Editorial Advisory Board 08 Cannabis News Focus 45 Product Spotlight features 36 The Environmental Implications of Energy Consumption in Cannabis Cultivation ZACARIAH HILDENBRAND AND ROBERT MANES What are the environmental implications of energy consumption for outdoor, indoor, and greenhouse cultivation? ? 40 The Fields of Science and Technology Would Not Exist Without the Use of Buffers—Why Aren’t They Used with Cannabis Extractions? DANIEL MAIDA HAYDEN Here, we take a closer look at buffers to see what solutions they might offer. 44 Gaining Deep Knowledge About Cannabis Cultivation: How and Why MIA VOLKOVA A review of the changing attitude and knowledge gap in cannabis cultivation and more. 32 on the cover: roxxyphotos / adobestock.com
  • 7. ©2019 Hamilton Company. All rights reserved. All other trademarks are owned and/or registered by Hamilton Company in the U.S. and/or other countries. Lit. No. L80098 — 08/2019 Hamilton Americas Pacific Rim Hamilton Company Inc. 4970 Energy Way Reno, Nevada 89502 USA Tel: +1-775-858-3000 Fax: +1-775-856-7259 sales@hamiltoncompany.com Hamilton Europe, Asia Africa Hamilton Central Europe S.R.L. str. Hamilton no. 2-4 307210 Giarmata, Romania Tel: +40-356-635-055 Fax: +40-356-635-060 contact.lab.ro@hamilton-ce.com To find a representative in your area, please visit hamiltoncompany.com/contacts. Web: www.hamiltoncompany.com USA: 800-648-5950 Europe: +40-356-635-055 With the recent legalization of both medicinal and recreational marijuana in the United States, analysis of individual cannabinoids has captured the public’s interest at a new level. As such, many new cannabis products are now available, i.e., edibles, vaporizers, and extracts to name a few. The increased marketability of the product has incited consumers to take a greater interest in the quality and craft ability of the products being sold. Through the quantification of individual cannabinoids, the consumer can make an informed decision about the possible effects they could expect from the products they purchase. Therefore, the need for accurate, robust, and affordable analysis tools are of the upmost importance. With health, safety, and edibles dosing as the primary motivation, Hamilton Company developed an HPLC method that isolates eight major cannabinoids. The HxSil C18 (3 µm) column provides an accurate, cost effective, and robust solution that can be used in any HPLC system. Column Information Packing Material HxSil, 3 µm Part Number 79641 Chromatographic Conditions Gradient 0–10 min, 78–92% B 10–15 min, 78% B Temperature Ambient Injection Volume 5 μL Detection UV at 230 Dimensions 150 x 4.6 mm Eluent A 20 mM NH4 COOH pH 3.5 Eluent B Acetonitrile Flow Rate 1.0 mL/min Author: Adam L. Moore, PhD, Hamilton Company Compounds: 1: Cannabidivarin (CBDV) 2: Cannabidiol (CBD) 3: Cannabidiolic Acid (CBDA) 4: Cannabigerolic Acid (CBGA) Separation of Eight Cannabinoids 5: Cannabigerol (CBG) 6: Cannabinol (CBN) 7: ∆-9-Tetrahydrocannabinol (∆-9-THC) 8: ∆-9-Tetrahydrocannabinolic Acid (∆-9-THCA) Time (minutes) 1 2 3 4 6 5 2 7 8 3 4 5 6 7 8 9 0 10 20 30 40 mAU Separation of Eight Cannabinoids
  • 8. cannabis science and technology®   |   vol. 4 no. 3 cannabissciencetech.com 8 cannabis news focus Groundbreaking COVID-19 Study Shows CBD May Help Inhibit Infection Madeline Colli RESEARCHERSINTHEUSrecentlyconductedastudywhichdisclosed that a cannabis plant compound inhibited infection with severe acute respiratory syndrome coronavirus 2 (SARS-CoV-2) in human lung cells. SARS-CoV-2 is the virus that causes COVID-19, threaten- ing global health and world economies (1,2). Marsha Rosner, PhD, and other colleagues from the University of Chicago (Chicago, Illinois) dis- covered that cannabidiol (CBD) and its metabolite 7-OH-CBD potently blocked SARS-CoV-2 replication in lung epithelial cells (3). Through the combination of CBD and 7-OH-CBD, the expression of certain genes within the viral cells were inhibited and changes in gene expression within the lung cells that resulted from the pres- ence of COVID-19 were reversed (4). Thus, CBD and 7-OH-CBD serve in both protective and therapeutic roles. CBD was also found to have the ability to block viral ribonucleic acid (RNA), including the cod- ing for the spike protein, which is the tool the virus uses to enter our cells. “This study highlights CBD, and its active metabolite, 7-OH-CBD, as potential preventative agents and therapeutic treatments for SARS-CoV-2 at early stages of infection,” said Rosner and the team (1). Even with recently approved vaccines being rolled out in many countries, the virus continues to spread rapidly, heightened by more transmissible variants, such as the B.1.1.7 variant. Rosner and her col- leagues say that this highlights the need for alternative approaches, especially among populations with limited access to vaccines. Few therapies to date have been identified as being able to block SARS- CoV-2 replication and viral reproduction. Primarily, the SARS-CoV-2 virus enters host cells through the bind- ing of a surface viral protein—called spike protein—to the human host cell receptor angiotensin-converting enzyme 2 (ACE2). From there, the viral genome is then translated into two large polypep- tides that are severed by the viral proteases main protease (MPro) and papain-like protease (PLPro) to produce the proteins necessary for viral replication, assembly, and budding (1). To analyze the effect of CBD on SARS-CoV-2 replication, the re- searchers pretreated A549 human lung carcinoma cells express- ing ACE-2 (A549-ACE2) with 0-10 μM CBD for 2 hours before infect- ing them with SARS-CoV-2. Evaluation of the cells 48 hours later expressed CBD had potently inhibited viral replication in the cells. When CBD was assessed to possibly prevent proteolytic cleavage by MPro and PLPro, it was observed that CBD had no effect on the activity of either protease. This revelation led the team to hypoth- esize that CBD targets host cell processes. Consistent with their hypothesis, RNA sequencing of infected A549-ACE2 cells treat- ed with CBD for 24 hours showed significant suppression of SARS- CoV-2-induced changes in gene expression. CBD was shown to have Richard Sams, PhD, Joins Cannabis Science and Technology®’s EAB Madeline Colli CANNABIS SCIENCE AND TECHNOLOGY® is pleased to announce the addition of Richard Sams to its editorial advisory board (EAB). Dr. Richard Sams earned his Bachelor of Science degree in pharmacy and a Doctor of Philosophy degree in pharmaceu- tics from Ohio State University. After his time working as a research scientist at Ciba-Geigy Pharmaceuticals in Suffern, New York, he served as a faculty member in the Colleges of Veterinary Medicine and Pharmacy at OSU. There, he special- ized in veterinary pharmacology and directed the testing and research activities of the Analytical Toxicology Laboratory, which is the official testing laboratory of the Ohio State Rac- ing Commission. In 2001, Sams became a scientific consult- ant to the Racing Medication and Testing Consortium and be- came a member of its Scientific Advisory Committee. From 2006–2010 Sams served as a professor in the Col- lege of Veterinary Medicine at the University of Florida where he was responsible for teaching veterinary clinical pharmacology and directing the Florida Racing Laborato- ry, the official testing laboratory of the Florida Department of Business Regulation Division of Racing. After his time at the University of Florida, Sams became the director of the HFL Sport Science Laboratory in Lexington, Kentucky. This laboratory was the official testing laboratory for the Ken- tucky Horse Racing Commission, the Indiana Racing Com- mission, the Maine Harness Racing Commission, the Vir- ginia Racing Commission, the Puerto Rico Racing Authority, the Delaware Thoroughbred Racing Commission, and the Trinidad Tobago Racing Authority. Since 2019, Sams has held the role of the scientific director of KCA Laborato- ries, a cannabis testing and research laboratory located in Nicholasville, Kentucky. Currently, Sams is serving on the Scientific Advisory Committee to the Association of Racing Commissioners In- ternational, Inc. In addition, he has authored more than 130 peer-reviewed scientific studies. Frequently, he is re- quested to consult on cannabis-related matters and the disposition of drugs and other substances in animals. SCAN THE QR CODE for a complete list of the Cannabis Science and Technology® Editorial Advisory Board members.
  • 9. cannabis news focus effectively eliminated viral RNA expres- sion, which included RNA coding for the spike protein. It was also found that both SARS-CoV-2 and CBD triggered sig- nificant changes in cellular gene expres- sion, such as the expression of several transcription factors. Further analysis of host cell RNA expressed that the vi- rus-induced changes were almost com- pletely reversed, though rather than the cells returning to a normal cell state, the CBD plus virus-infected cells resembled those treated with CBD alone. Another critical finding researchers discovered was that CBD had “effective- ly reversed” the triggering of a hyperin- flammatory response, also known as a “cytokine storm” which is brought on by the presence of the virus, restoring cells not to a previral level of inflation, but a state as if the cells had been treated with only CBD. A study completed near the end of 2020 by the Dental College of Georgia (DCG) (Augusta, Georgia) and the Medical College of Georgia (Augusta, Georgia) also had similar findings to the team from the University of Chicago (5). Cytokine storms have been one of the principal causes of death resulting from a COVID-19 infection. CBD was identified in reducing damage in the lungs spurred by cytokine storms caused from COVID-19 by normalizing lev- els of apelin, a peptide known to reduce inflammation, decreasing physical lung damage associated with adult respiratory distress syndrome (ARDS), and improving oxygen levels. During a COVID-19 infection, these apelin levels were seen to be at very low levels. Rosner and her team stat- ed that “CBD has the potential not only to act as an antiviral agent at early stages of infection but also to protect the host against an overactive immune system at later stages,” (1). During the University of Chicago’s study, a range if other cannabinoids were also tested, but by the end of the trial, CBD was the only cannabinoid found to have any effect at all on COVID-19-infected cells. Limited-to-no antiviral activity was exhib- ited by the other cannabinoids investi- gated. CBD is often consumed as part of a Cannabis Sativa extract, which is also what led the team to consider investigating oth- er cannabinoids with closely related struc- tures to see if they would reveal similar or stronger results. The team hopes that CBD will continue to be investigated as a po- tential COVID-19 treatment following the research from their article about the study, which is currently under peer-review. “We advocate carefully designed placebo-con- trolled clinical trials with known concen- trations and highly-characterized for- mulations in order to define CBD’s role in preventing and treating early SARS-CoV-2 infection,” the authors stated (4). SCAN THE QR CODE for a full list of references cited in this piece.
  • 10. cannabis science and technology®   |   vol. 4 no. 3 cannabissciencetech.com 10 cannabis analysis Why Dispensaries Need In-House Testing By Brian C. Smith T hinkaboutyourlasttriptoaphar- macy.Whatdidyousee?Everything imaginableonsalefromaspirin togroceriestoofficesuppliesper- haps.Andwhatdidyouseebehindthecoun- terasyouwerewaitingtogetyourprescrip- tionfilled?Probablyrowsofshelveswith bottlesofpillsinthem,andpharmacistsand theirassistantscladinnicewhitelaborato- rycoats,lookingforalltheworldlikeanalyt- icalchemists.Butwhatwasmissingbehind thatcounter?Thefumehoods,chromato- graphs,andspectrometersyouwouldnor- mallyseeinananalyticalchemistrylabora- tory.Whyisthis?BecausethankstotheUS FoodandDrugAdministration(FDA)every bottlebehindthatpharmacycountercon- tainsaknownamountofactivepharmaceu- ticalingredients,alistofinactiveingredients (excipients),andanexpirationdate. For example, a bottle of pain reliever I bought recently from my local pharmacy clearly states each tablet contains 200 mg ibuprofen, and there is a list of inactive in- gredients in descending order of concentra- tion. The label also says, “Store at 20 °C to 25 °C . . . avoid excessive heat above 40 °C.” The label also has a batch number on it, in- structions for use, warnings, indications, contra-indications, and a sell by date. How do we know what is in each tab- let? How do we know the best storage conditions? How was the sell by date de- termined? Because the FDA compels pharmaceutical companies to perform in- house testing to make sure every bottle produced contains what is advertised. Ad- ditionally, each label will have a clear sell by date on it because chemistry tells us medi- cines degrade over time, and again thanks to the FDA stability studies were per- formed so we know how long it is safe take a specific medicine. Contrast this with your last trip to your local cannabis dispensary, assuming they are legal where you live and you actually vis- it them. The lack of analytical equipment is similar to a normal pharmacy, but that is where the similarity ends. Pick up a can- nabidiol (CBD) tincture bottle. It may list a few ingredients such as CBD extract, medi- um chain triglycerides (MCT) oil, and “fla- voring” but that is probably it. A list of excip- ients is typically not there, nor should you expect to see a sell by date. Cannabis medicines contain more than CBD and tetrahydrocannabinol (THC), they contain other cannabinoids, terpenes, and who knows what else. An extractor may for- mulate their tinctures with a distillate that is 90% cannabinoids, but what is in that oth- er 10%? Fats? Waxes? Chlorophyll? Pesti- cides and heavy metals? Is any of what is in that 10% harmful to human health? We have no idea since there is little scientific work on the analysis of the noncannabinoid compo- nents of cannabis extracts and distillates. This means we are formulating cannabis medicines with poorly characterized ingre- dients, putting our patient’s health at risk. The Dose Makes the Poison . . . and the Cure The old adage “the dose makes the poison” (1) translated into chemical terms means that concentration matters. A little of something may be benign or even beneficial, whereas in large doses it can be fatal. For example, acetaminophen is an effective pain reliever and fever reducer, but in high doses is a liver poison (2). At minimum then, the label for any medicine needs to have an accurate statement of the amount of active pharmaceutical ingredient (API) present in each dose. And yet in the cannabis industry mislabeled medicines are an ongoing prob- lem (3–5). In a recent paper, 62% of commer- cially available samples had incorrect CBD amounts on their labels (5). This same paper found that CBD degrades measurably over the course of 30 days, and that light and heat accelerate the degradation (5). This means the common sell by date of one year on cannabis products is probably wrong. To supplement the data on CBD prod- ucts, I performed a study on the labeling of marijuana buds. This involved purchasing 1/8 oz of buds of different strains at local dis- pensaries, noting the total THC value on the label, and then having the potency test- ed by high performance liquid chromatog- raphy (HPLC) at a California state licensed, If cannabis were regulated like other medicines, the product you obtain at a dispensary would contain a label with an accurate statement of the amount of active pharmaceutical ingredient, a list of the inactive ingredients, and an expiration date. I present data below that shows up to 77% of dispensary products are mislabeled. This is alarming since it means cannabis patients are receiving the wrong dose of medicine, and cannabis consumers are being ripped off. To solve this problem, cannabis dispensaries need to do their own testing. I discuss appropriate technologies for this.
  • 11. cannabissciencetech.com april 2021   |   cannabis science and technology® 11 industry trends / cannabis analysis International Organization for Standardiza- tion (ISO) certified laboratory (6). The re- sults for the 14 different marijuana strains are shown in Table I. The relative difference for each strain was calculated by subtracting the label val- ue from the laboratory value and dividing by the laboratory value. The state of Cali- fornia considers a cannabis product misla- beled if the laboratory value is more than 10% relative different than the label claim. Other workers have used this same stand- ard (5). Using this criterion, 10 out of 13 or 77% of the samples examined here were mislabeled. Note that for all strains the third party laboratory value is lower than the label claim. On average, the laborato- ry value is lower than the label value by 4.55 wt.% total THC, and on average the relative percent difference was 25.2%. The fact that all strains studied are signif- icantly lower than advertised is distressing. This means cannabis patients are receiving the wrong dose of medicine, and that can- nabis consumers are not getting what they are paying for. All the samples had been har- vested and packaged at least two months be- fore this study. A possible explanation for these results is that the marijuana lost po- tency over time under the storage condi- tions used. Cannabis potency decrease over time has been observed before (7-10). An- other possible explanation for these results is inter-laboratory error, where different cannabis laboratories obtain different num- bers on the same samples. I have written on this problem extensively in previous col- umns and papers (11). If the vendor's in this study used a different third party laboratory than I did, it makes sense that we might get different results. Ultimately though these results are a condemnation of the state of California's laboratory testing certifica- tion program. This obviously needs to be re- formed to prevent cannabis patients from receiving incorrect doses and cannabis con- sumers from being ripped off. Imagine the uproar if 77% of the bottles in a batch of ibuprofen were mislabeled? There would be a hue and cry, gnashing of teeth, reams of bad publicity, calls for in- vestigations, sanctions, and possible crim- inal prosecution. And yet this same exact scenario takes place regularly in the canna- bis industry. Why do we tolerate this? Why Do Dispensaries Need In-House Testing? To prevent these problems dispensaries need to do their own in-house testing for these reasons. 1. Insure Customer Safety: Dispensaries are clearly selling mislabeled products. Medicines need to be labeled properly so patients get the proper dose. Dispensa- ries should test their stock before sale to make sure it is labeled properly. 2.LowerLiability:Anincorrectlylabeled productcouldcauseharmtoaconsum- er.Ifadispensarytesteditsstockitself,it canmakesureonlycorrectlylabeledmed- icinesaresold,reducingliability. 3. Prevent Customers from Being Ripped Off: Cannabis consumers are en- titled to get what they are paying for. If Table I: Comparison of label total THC value, third party laboratory total THC value, weight % (wt.%) difference, and relative % difference for 14 marijuana strains Marijuana Strain WT. % Total THC on Label WT. % Total THC by HPLC Measured at Third Party Laboratory WT. % Difference Laboratory-Label Relative % Difference Yolo Berry 12.4 11.9 -0.5 4.20 Sour Fizz 19.08 12.4 -6.68 53.87 Orangutang 17.8 15.2 -2.6 17.11 Illemonati 20.12 16.4 -3.72 22.68 GMO Cookies 30.6 29.54 -1.06 3.59 Durban Poison 34.61 24.22 -10.39 42.90 Chem Dog 26.6 23.07 -3.53 15.30 Mint Chocolate Chip 30.51 28.14 -2.37 8.42 Chocolate Marshmallow 29.87 26.4 -3.47 13.14 Candyman 31.15 23.06 -8.09 35.08 Kings Cake 26.69 25.6 -1.09 4.26 Royal Flush 25.73 13.19 -12.54 95.07 Golden Lemons 25.55 21.17 -4.38 20.69 Macaroon 22.66 19.35 -3.31 17.11
  • 12. cannabis science and technology®   |   vol. 4 no. 3 cannabissciencetech.com 12 a jar of buds says it is 25 wt.% total THC, that is what the consumer should get. Based on the data above this is clearly not the case. If dispensaries tested their prod- ucts before sale they could insure that only properly labeled products are sold, in- suring consumers get what they pay for. 4. Prevent Dispensaries from Being Ripped Off: Dispensaries set the price they pay suppliers based in part on potency. In many cases suppliers will pro- vide certificates of analysis (COAs) from licensed laboratories to help determine price. However, there is nothing prevent- ing suppliers from accidentally or inten- tionally giving the wrong COA to a poten- tial buyer—and yes, I know this happens. Dispensaries need to protect themselves from being ripped off by doing on the spot potency tests of products before they buy them so they know what they are getting. 5.ToMonitorTheirStock:Sincewe knowthatcannabinoidsdegradeovertime (7–10), itmakessensefordispensariesto monitorwhatisontheirshelves.Thiswill preventthemfromsellingmislabeledor taintedproductstotheircustomers. 6. Reassure the Public: By doing their own analyses, dispensaries can assure the public they are getting what they pay for and the products being purchased are safe. Our industry will not realize its full potential until the public can have full confidence that cannabis medicines are safe and effective. Should Dispensaries Set Up Their Own Testing Laboratories? Setting up a cannabis analysis laboratory with all the equipment needed to test for pesticides, heavy metals, terpenes, and potency is a million dollar plus propo- sition. This is probably not practical for most dispensaries. However, given that in most instances the API is THC or CBD, having the ability to measure these analytes would be the best way to insure correct dosages and accurate label claims. Many third party laboratories use HPLC or gas chromatography (GC)to measure potency (11–14). I have pointed out in previous columns that amongst the criteria to use when judg- ing an analytical method are speed, accura- cy, and cost (11). I have also pointed out that chromatography is accurate, but can be slow and expensive (11). Infrared (IR) spec- troscopy on the other hand can offer equiv- alent accuracy but will always be faster, cheaper, and easier than chromatography (11). There exist IR spectroscopy-based can- nabis analyzers that work on flower (15,16), extracts (17), distillates (18), and tinctures (19) that cost around $30k (20). This is not cheap, but probably much more within the budget of a typical cannabis dispensary than the cost of a chromatograph. Conclusions Mislabeled cannabis medicines are an ongoing problem in this industry. We found 77% of the products purchased at dispensaries are mislabeled. Mislabeled medicines mean patients are receiving incorrect doses, consumers are being ripped off, and dispensaries are exposed to significant litigation. For these reasons, dispensaries need to test their products before they sell them. Suggested potency testing technologies were discussed. References (1) https://en.wikipedia.org/wiki/ The_dose_makes_the_poison. (2) https://en.wikipedia.org/wiki/Paracetamol. (3) https://mjbizdaily.com/nearly-a-fifth-of-california- marijuana-products-failing-testing-standards/. (4) M.O. Bonn-Miller, M.J.E. Loflin, B.F. Thomas, J.P. Marcu, T. Hyke, and V. Ryan, Journal of the American Medical Association 318, 1708 (2017). (5) C. Mazzetti, E. Ferri, M. Pozzi, and M. Labra, Scientific Reports 10, 3697 (2020). (6) www.sclabs.com. (7) J. Fairbairn, J. Liebmann, and M. Rowan, Journal of Pharmacy and Pharmcacology 28, 1 (1976). (8) I. Trofin, G. Dabija, D. Vaireanu, and L. Filipescu, Revista de Chimie (Bucharest) 63, 293 (2012). (9) C. Lindholst, Australian Journal of Forensic Sciences 42, 181 (2010). (10) B.C. Smith, Terpenes Testing Magazine, Nov./Dec.(6), 48–51 (2017). (11) B.C. Smith, Cannabis Science and Technology 2(2), 12-17 (2019). (12) M.W. Giese, M.A. Lewis, L. Giese, and K.M. Smith, Journal of AOAC International 98(6), 1503 (2015). (13) C. Giroud, CHIMIA Intl. Journal of Chemistry 56, 80 (2002). (14) T. Ruppel and M. Kuffel, Cannabis Analysis: Potency Testing Identification and Quantification of THC and CBD by GC/FID and GC/MS, PerkinElmer Application Note (2013). (15) B.C. Smith, M. Lewis, and J. Mendez, “Optimization of Cannabis Grows Using Fourier Transform Mid-Infrared Spectroscopy,” PerkinElmer Application Note (2016). (16) B.C. Smith, Cannabis Science and Technology 2(6), 10-14 (2019). (17) B.C. Smith, Terpenes and Testing Jan.-Feb. 2018., Pg. 32. (18) B.C. Smith, P. Lessard, and R. Pearson, Cannabis Science and Technology 2(1), 48–53 (2019). (19) B.C. Smith, C.A. Fucetola, K. Ehrmantraut, and T. Hagan, Terpenes Testing Sept./Oct. 2020, Pages 19-24. (20) www.bigsurscientific.com. ABOUT THE COLUMNIST BRIAN C. SMITH, PHD, is Founder, CEO, and Chief Technical Officer of Big Sur Scientific. He is the inventor of the BSS series of patented mid-infrared based cannabis analyzers. Dr. Smith has done pioneering research and published numerous peer-reviewed papers on the application of mid-infrared spectroscopy to cannabis analysis, and sits on the editorial board of Cannabis Science and Technology. He has worked as a laboratory director for a cannabis extractor, as an analytical chemist for Waters Associates and PerkinElmer, and as an analytical instrument salesperson. He has more than 30 years of experience in chemical analysis and has written three books on the subject. Dr. Smith earned his PhD on physical chemistry from Dartmouth College. Direct correspondence to: brian@bigsurscientific.com cannabis analysis / industry trends
  • 13. 13 cannabissciencetech.com april 2021   |   cannabis science and technology® E thanol has been used for cen- turies as an extraction meth- od and an ingredient to pro- duce perfumes, food colorings and flavorings, medicinal bases, and essential oils. The US Food and Drug Administration (FDA) has found pro- duction of consumer goods using food- grade ethanol to be safe for human use and consumption, which cannot be said of other alcohols. It is the sec- ond most popular solvent behind wa- ter. It is also the least toxic of all alco- hols, making it one of the most widely used solvents in consumer goods. Be- cause of all the aforementioned char- acteristics, it is no surprise that eth- anol has also maintained its position in the cannabis industry as one of the most widely used solvents for extrac- tion of cannabinoids. Ethanol is a polar solvent, but can have both polar and nonpolar proper- ties. It attracts polar and ionic mole- cules, through its hydroxyl group, and can attract nonpolar molecules be- cause of the nonpolar nature of the ethyl group. Hydrogen bonding of ethanol and water with the hydroxyl group can be seen in Figure 1. Tetrahydrocannabinolic acid (THCA) and cannabidiolic acid (CBDA) are both polar compounds due to their acidic hydroxyl group. Therefore, they are both easily ex- tracted with ethanol at room temper- ature. Chlorophyll is an undesired polar compound that easily coex- tracts with the cannabinoids during most methods of ethanol extraction. This is why crude ethanol extracts, such as modern products listed as Rick Simpson oil (RSO), have a dark green color and concentrations in the 40–60% range. Advancements have been made in methodology to opti- mize for the extraction of cannab- inoids and exclude chlorophyll and waxes. Methods of the Early Years Maceration This method has been used for centu- ries and is considered a “traditional” medicinal preparation method for phytochemicals (2). Method 1. Plant material, like cannabis, is soaked in ethanol. 2. The plant material is then filtered to separate the solid from the liq- uid solvent-solute solution. 3. The solution is processed using rotary evaporation or falling film evaporation to remove the solvent. This results in a crude botanical extract. 4. Products, such as alcohol-based tinctures, can be produced direct- ly from the extraction using the solute-solvent solution. Pros 1. Ease of method 2. Fast extraction time 3. Low cost 4. Can be used at a small and large scale Cons 1. Highly variable 2. Minimal control over extracted target compounds 3. Can be a long extraction time de- pending on the input material, proof of ethanol, and temperature at which the extraction occurs. 4. With respect to cannabis extrac- tion, the inability to control the temperature of the extraction and therefore the polarity of the sol- vent, results in an extract contain- ing chlorophyll, water, and other compounds. If the goal of the ex- traction is to purely extract can- nabinoids, this method produces an extract that is not. The Evolution of Ethanol Extraction Methods in Cannabis By Lo Friesen Ethanol has maintained its position as one of the most scalable extraction methods because of its simple methodology and solvent properties. Over time, the technology used in ethanol extraction has increased the selectivity of the method and resulted in shortened post-processing times and increased purity. In this article, we will walk through the evolution of the extraction method within the cannabis industry, where it stands today, and the other alcohols that are being introduced to the cannabis extraction space. extraction science
  • 14. cannabis science and technology®   |   vol 4. no. 3 cannabissciencetech.com 14 Soxhlet Extraction This method has been used for decades and is considered a “traditional” medic- inal preparation method for botanicals. Method 1. Plant material, like cannabis, is packed into a column that is po- sitioned between the boiling flask containing ethanol and a condensing column. 2. The ethanol is heated to produce a vapor, which will then inter- act with the plant material such that an extraction occurs. The re- sulting solution is a mixture of solvent and compounds that are soluble in ethanol at the vapor temperature of ethanol. 3. The ethanol-extract solution then collects in the boiling flask. Pros 1. Ease of method 2. Plant material is contained sepa- rately from ethanol-extract solution, eliminating the need to filter the plant material from the solution. 3. Fast extraction time 4. Low cost Cons 1. Low selectivity 2. Not scalable 3. As with the maceration method, the result is a cannabis extract that is far from pure. Recent Advancements Cold Ethanol Extraction This method has developed over the past decade to improve the selectivity of ethanol and optimize extraction of cannabinoids. Method (5) 1. Plant material is loaded into a mesh bag or basket and placed in the extraction chamber. 2. Ethanol is chilled to -40 °C then introduced to the extraction chamber soaking the plant materi- al and the solute is extracted with the ethanol that flows through the plant material. 3. The ethanol-extract solution is then pumped out of the extraction chamber to a collection vessel to be processed further. 4. The solvent is evaporated using rotary evaporation or falling film evaporation. 5. The extract can then be used to formulate final products or dis- tilled further for higher purity of cannabinoids. Pros 1. Increased solvent selectivity, re- sulting in a more pure-cannabi- noid extract 2. Scalability Cons 1. Increased extraction time 2. Reduced solvent solubility and yield 3. High equipment cost 4. High electricity usage to chill the solvent Liquid-Solid Mix and Separation Centrifuge Extraction with Cold Ethanol This is the most common method used in cannabis and hemp ethanol extraction today. Method 1. Plant material is ground to a uni- form size. 2. Plant material is added to a mesh bag and placed inside a centrifuge basket. 3. Ethanol is chilled to -40 °C then introduced to the centrifuge chamber where the ethanol soaks the cannabis. 4. The centrifuge is powered on and churns like a washing machine to mix the solvent and plant material while the solute is extracted. 5. After the extraction, the extract- ed solution is pumped out of the centrifuge basket into a collection vessel. 6. The solution is then introduced to a solvent removal process, like falling film evaporation, which leaves the final extract complete and ready to formulate. Pros 1. Fast extraction time 2. Increased solvent selectivity 3. Separation of liquid and solid occurs simultaneously with the extraction, eliminating a filtration step 4. Ease of use Cons 1. Reduced solvent solubility and yield 2. High equipment cost 3. High electricity usage to chill the solvent 4. Equipment maintenance—etha- nol can easily cause fast wear on bearings that are integral to high speed centrifuges Figure 1: Hydrogen bonding of ethanol and water with the hydroxyl group (1). ethanol H H H H H H H H H H O O O C C extraction science / ethanol extraction
  • 15. 15 ethanol extraction / extraction science cannabissciencetech.com april 2021   |   cannabis science and technology® 5. Highly laborious to continuous- ly remove and refill the centri- fuge with plant material 6. Note: As the process scales up, a noticeable decrease in yield has been acknowledged as a re- sult of more ethanol being used and remaining within the plant material. This reduces the yield and increases processing time in the evaporation stage. Other Alcohols Other alcohols, like isopropyl or meth- anol, have been utilized in botanical extraction for many years. Isopropyl alcohol and methanol are significantly lower in cost than ethanol, but have their own pros and cons including being toxic to inhale or ingest at far lower con- centrations than ethanol (6). Methanol has a lower boiling point, which also in- dicates a lower polarity. Being less polar than ethanol, methanol is less efficient at extracting THCA and CBDA. Isopropyl alcohol has a higher boiling point and higher polarity, this results in higher yields of cannabinoids in a shorter amount of time, but also extracts higher quantities of chlorophyll. The evaluation of solvents is heavily focused around the cost of a solvent, a company’s ability to remove all of the residual solvent to min- imize consumer risk, and post-process- ing time and methods. These alternative alcohols are strong candidates for any business that further refines the extract using distillation. Wiped or thin-film distillation can produce a pure cannab- inoid distillate, reducing the need for purity in the crude form. The Future As hemp and cannabis processors continue to scale up, technology must keep up with rapid improvements and development to address the bottle- necks in processing massive amounts of biomass. These bottlenecks are in the grinding process, loading and unloading inputs, and solvent evaporation. Leading manufacturers, such as Eden Labs, are introducing continuous-feed centrifuge technology to the cannabis industry. This methodology involves a continuous stream of ground plant material and ethanol flowing through a centrifuge which creates a solid-liquid slurry where the extraction occurs. The slurry is then continuously pumped into a separation centrifuge where the solid and liquid materials are separated. The liquid ethanol-extract solution is then continu- ously pumped into a solvent evaporation step. While falling film evaporators have become the chosen evaporation method, the continuous feed technology has forced an even better method to be utilized called membrane filtration. Using scalable membrane technology, the extract and solvent are easily separat- ed and can accommodate continuous feed. Ethanol extraction is primed for continuous feed and complete automa- tion, reducing costs and bottlenecks in scalability. Through advancements in technolo- gy, such as the coldfinger or cold-eth- anol extraction of cannabis and hemp, Figure 2: The soxhlet extraction methoed (2). Figure 3: The cold ethanol extraction method (4).
  • 16. cannabis science and technology®   |   vol 4. no. 3 cannabissciencetech.com 16 efficiency and selectivity of the sol- vent has dramatically increased and im- proved the extraction of desired com- pounds. After the solvent evaporation process, the cannabinoid concentrate is ready to be formulated for end products. With the right temperature, extraction time, and equipment, ethanol extracted cannabis and hemp can produce relative- ly high purity (60–70%), golden cannab- inoid extract, with extraction efficien- cies of +90%. Ethanol continues to be the solvent of choice for high-throughput cannabis processors aiming to extract hundreds to thousands of pounds of can- nabis and hemp biomass daily. Ethanol extraction is a prime candidate for auto- mation, which will translate to improved efficiency, lower costs, higher through- put, and much more. It will be interest- ing to watch as automation is integrated into ethanol extraction and refinement processes in the coming years. References (1) N.E. Schore and K.P.C. Vollhardt, Organic Chemistry: Structure and Function (Bleyer, Brennan, New York, New York, 2007). (2) B.A. Weggler, B. Gruber, P. Teehan, R. Jaramillo, and F.L. Dorman, in Separation Science and Technology (Academic Press, Volume 12, 2020, Chapter 5 - Inlets and sampling) pp. 141–203, https://doi. org/10.1016/B978-0-12-813745-1.00005-2. (3) New Directions Aromatics, 2017, “Untapping the Power of Nature: Essential Oil Extraction Methods” https://www. newdirectionsaromatics.com/blog/articles/ how-essential-oils-are-made.html. (4) Eden Labs, 2021, “Coldfinger Ethanol Extraction” https://www.edenlabs.com/ coldfinger/ethanol-extraction-process/. (5) R. Anton, et al., European Food and Feed Law Review 9(6), 391–398 (2014). www.jstor.org/stable/24326136. (6) Q.W. Zhang, L.G. Lin, and W.C. Ye, Chin. Med. 13(20), doi:10.1186/s13020-018-0177-x (2018). ABOUT THE COLUMNIST LO FRIESEN is the founder, CEO, and Chief Extractor of Heylo. With a background in chemistry and clinical research, Lo was inspired to explore cannabis as a medicine and to enter the emerging industry. She joined Eden Labs, a leading CO2 extraction equipment manufacturer to support and expand a Research and Development department. There she managed the development of their latest and greatest CO2 extraction system. In 2017, after working with Eden Labs and another cannabis processor, Lo launched Heylo with a mission to help people get more out of life with cannabis. extraction science / ethanol extraction Endocannabinoid Educational Certification Courses In partnership with Havas ECS, Cannabis Science and Technology® , Cannabis Patient Care™ are offering this comprehensive training curriculum for all levels of students—from healthcare professionals to patients, parents, caregivers, and budtenders. With three different course offerings, you can choose to learn the basics of the endocannabinoid system or earn continuing medical education (CME) credits in either a 3-CME course or 12-CME course. Learn more at cannabissciencetech.com/courses In Partnership with
  • 17. 17 cannabissciencetech.com april 2021   |   cannabis science and technology® Looking with Light: Breaking Down Liquid Chromatography Method Development By Patricia Atkins T he start of method develop- ment is identifying and un- derstanding the physical and chemical nature of the analyti- cal targets and the scope of analytical instruments. Methods are a complete package of the chemistries, modali- ties, and functionality of all the tar- gets, sample preparation, instrumen- tation, chromatographic phases, and parameters that allow for the separa- tion, identification, and quantitation of the analytes of interest. Often, ambitious analysts try to create a single method for all their analytes under one process and one instrument and end up with lots of mediocre data. Equally frustrating is setting up a method with stand- ard conditions and settings without fine tuning it to the samples and an- alytes then becoming disappointed when the method “doesn’t work.” It is important to recognize that there will be instances where the sample preparation or the analysis meth- od will require separate processes or “tweaking” to report all the target analytes efficiently and accurately. There is no one size fits all or straight out of the box solution. Instrument Selection and Dynamic Range I am sorry to say there is no one piece of instrumentation that will fill all needs. Some technologies have a wider range of targets, such as liquid chromatography–mass spectrometry (LC–MS) versus gas chromatography (GC)–MS, but each technique has its limitations and uses. Instrument choice is often dependent on the chemistry of target analytes and their potential analytical concentration. For instance, in cannabis there are several classes of organic analytes that are routinely examined including canna- binoids for potency; terpenes and fla- vonoids for identity, flavor, fragrance, and chemical fingerprinting; and pesticide residues or mycotoxins as potential contaminants. By their very nature all of these compounds occur in vastly different concentrations. Trace analysis (low parts-per-million [ppm] or parts-per-billion [ppb]) is the range for any method created to quantify potentially dangerous contaminants such as pesticides or mycotoxins and requires systems such as GC–MS, LC–MS and LC–tandem MS (MS/MS), which have sensitivity in those low ranges. Cannabinoids and terpenes on the other hand can occur in the high ppm level up to the percent level and re- quire a different range of analysis such as what is found in high per- formance liquid chromatography (HPLC) coupled with ultraviolet-vis- ible (UV-vis) detection and GC cou- pled with flame ionization detection (FID). These two ranges of analy- sis often cannot be produced and The analytical scientist is often tasked with a difficult job of being accurate, efficient, and expedient in their work. Often these focused goals do not allow a lot of time for research and fine tuning of their workflow. Many chromatographers use methods they find from manufacturers or technical sources and adapt them to their situations and analyses. Sometimes the methods get adjusted or “tweaked” to improve the fit or increase the output but, unless the scientist is doing research or creating a totally new method approach, they build upon the backs of other methods. In this column, we take a deeper look into the chemistry, physics, and methodology of high performance liquid chromatography (HPLC) methods. We will look at how columns function and what changes can be made to increase resolution, efficiency, and separation to reach a laboratory’s chromatographic goals. navigating the lab
  • 18. cannabis science and technology®   |   vol. 4 no. 3 cannabissciencetech.com 18 navigating the lab / analytical quantitated by a single method of an instrument without significant changes to the samples. The accuracy and ability to quan- tify analyte concentrations depends on the instrument's analytical spec- ification levels and dynamic range often bracketed by the level of de- tection (LOD) and level of lineari- ty (LOL)(Figure 1). The lowest lim- it of an analytical system is the limit of detection (LOD), this is the point where a target can be differentiated from a blank or noise with a high de- gree of confidence (usually over three standard deviations from the noise or blank response). The highest level of accurate quantitation ends with the LOL, where the linearity of the sys- tem starts to skew often due to detec- tor saturation. Peaks that reach LOL appear broad, flatten at their apex, or are cut off before their apex. The range of the most accuracy (dynamic range) is between the LOD and LOL starting at the limit of quan- titation (LOQ). The limit of quanti- tation (LOQ) is the lower limit of a method or system, which the target analyte can be reasonably calculated (over 10 standard deviations from the blank or baseline response). A simple method to determine if a response peak reaches the cutoff for LOD or LOQ is to look at the ra- tio of signal-to-noise (S/N). A blank baseline in chromatographic systems is rarely flat and straight. The low- est points of the chromatogram are a combination of the true baseline and system noise. Baseline noise is the sum of all the random variations (electri- cal, temperature, and so on) and con- tamination or interference from the chemical components. To determine if a peak can be quan- tified, one can either compare relative heights or relative areas. In compar- ing relative height, the analyst aver- ages the mean height of the noise and compares it to the height of the target peak from the noise mean height. To compare areas, one or more “peaks” in the noise are integrated with sim- ilar width to the target peak and the areas are compared. If the ratio is greater than three then it qualifies as within LOD and if the ratio is greater than 10, then that peak can be used for quantitation (LOQ). The best practice is to integrate the noise at the baseline at several points and average the baseline noise responses then compare to the inte- grated peak of interest (Figure 2). Figure 1: Dynamic range and limits. Figure 2: Example of peaks meeting LOD (peak B), LOQ (peak C), baseline, and noise levels.
  • 19. 19 cannabissciencetech.com april 2021   |   cannabis science and technology® For example, if the chromatographer is interested in peak A, they should integrate areas of baseline near the peak of similar peak widths to the target or measure its height com- pared to the average range of peak heights found in the noise. If the av- erage of those baseline noise peaks is 100 units (height or area) then peak A must be at least 300 units to meet the LOD criteria of 3X. If peak A is only 200 units then it fails and cannot be used for either identification or quan- tification. If peak B is the peak of in- terest and has a S/N 3 but 10, then it can be used for detection (LOD) and possibly identification but should not be used for quantification (LOQ). Finally, a peak such as C can be used for both identification and quantifi- cation because its S/N value is high- er than 10. Instrument sensitivity (represent- ed as S/N) can be increased by decreas- ing baseline noise without increasing the target response. Noise in a system can be created by matrix from the ex- tracted sample, contamination of the sample, and contamination of either the stationary phase or mobile phase. Prop- er sample clean-up and processing can sometimes reduce baseline noise, so the target peak is not “lost in the weeds” of the baseline. Often it is believed that one can get a better response by inject- ing a larger sample aliquot, but if the sample matrix is a contributor to the noise, then a larger sample means more matrix as well and will not necessarily help with the issues of S/N. As for the mobile phases, impuri- ties in mobile phase can directly af- fect baseline noise. The wrong grade of gases in GC can create high baselines while HPLC mobile phases can accu- mulate contamination by exposure to the laboratory environment. Replac- ing old solvents with fresh solvent can dramatically lower HPLC baseline noise. In some cases, especially in LC– MS and ppb analysis, the use of highly filtered LC–MS solvents can also play a role in reducing baseline noise. Solid phase contamination and build up can play a role in baseline noise. As columns age, the backbone materials—silanes, siloxanes, and so forth—can break down or lose pro- tective end capping, which increas- es noise. Harsh or acidic HPLC mo- bile phases can strip column phases and promote column breakdown. By examining the chromatographic base- line and cleaning up the contributing factors it can ensure that more target peaks fall into the LOQ needed for many analyses. Figure 3: Reversed-phase column selection. Figure4:Example initial chromatogram: t0 = dwell time (void volume) sometimes also referred to as tD , tF = end time of method. A: unretained peaks and co- elution; B: early eluting peaks and co-elution; C: baseline resolved peak; and D: late eluting peak cut off by end of method. analytical / navigating the lab
  • 20. cannabis science and technology®   |   vol. 4 no. 3 cannabissciencetech.com 20 navigating the lab / analytical Understanding the Targets HPLC is a powerful analytical tool that needs extensive adjustments to maximize its accuracy and efficiency. All the adjustments and fine tuning of parameters ultimately are based on the targets of interest. Generally, chromatographers group targets as either polar or nonpolar analytes, with some fluctuating between the two classifications. Nonpolar analytes such as alkanes and alike often are targets for normal phase chromato- graphic methods while polar analytes such as carboxylic acids, will be examined with reversed-phase chro- matographic methods. The majority of modern HPLC analysis falls under the classification of reversed- phase LC. The parameters of reversed-phase LC dictate that the mobile phas- es used with be polar solvents while the stationary phase (column) will be nonpolar. Target analytes that dis- solve in polar solvents and water will then use either ion-exchange columns or reversed-phases columns depend- ing on their chemistry (Figure 3). The most common reversed-phase LC columns are the C18 or C8 columns since they service a wide variety of chemistries. Column manufacturers may change or supplement the chem- istries of their standard C18 columns with different modifiers, which can assist with particular issues such as resistance to highly aqueous methods or better retention of highly polar compounds. The chemical properties (in addi- tion to the concentration) of your tar- gets will dictate—to a degree—the type of instrumentation that will be needed for analysis. As was stated previously, the concentration of an- alytes can dictate instrumentation such as UV over MS. But the chemical nature of the compounds will play an important role not only in selecting the right column but the right detec- tor. Compounds that are easily ion- ized can be detected using electros- pray ionization (ESI) with LC–MS. But, if your compounds are not as easily ionized then other atmospheric pressure ionization sources, such as chemical and photoionization (APCI and APPI) need to be considered if LC–MS is the method of detection. Learn more: www.acdlabs.com/MSWorkbookSuite Easily Deconvolute GC/MS LC/MS Data 3 simple steps from data to answers Separate Identify Store Share Automatically extract and separate components Search libraries to identify structures Store interpreted results with live data
  • 21. 21 cannabissciencetech.com april 2021   |   cannabis science and technology® analytical / navigating the lab Molecules with chromophores can utilize UV-vis detectors, while fluo- rescent molecules can utilize other chemiluminescent detectors. Once the chromatographer under- stands their target analyte’s range re- quirements, selected instruments, de- tectors, and targeted possible column chemistries it is time to start building or refining an analysis method. Initial Method Considerations One of the first questions asked when researching a new method is: Has any- one already created a method for my analysis? The good news is that most of the time someone, somewhere, has performed a similar analysis on a similar class of compounds or a sim- ilar type of material. The bad news is that the methods you find usually are a starting point and not an out-of-the box solution. Methods that are found in journals and websites are not nec- essarily a perfect fit for your labora- tory’s instrument configurations nor are they all validated for the purpose you might need (if they are validated at all). In some cases where there are dif- ferent size columns, tubing, parti- cle, or pore size, it is helpful to use an HPLC method translation tool to help alter flow rates and gauge retention time. One free method translator tool can be found at: https://www.acd- labs.com/resources/freeware/transla- tor. A downloadable excel calculator can be found at: https://ispso.uni- ge.ch/labs/fanal/hplc_calculator:en. Method translation tools do not al- ways take into consideration what may be practical for your system. They are usually just sophisticated calculators. The resulting parameters may exceed the capacity for your sys- tem (that is, the back pressure creat- ed will be too high, or the injection volume cannot be achieved with the system). Again, these parameters are meant to be a starting point for opti- mization and must be examined with a critical eye. In initial method development, it is best to start by separating targets from either a standard or a well-char- acterized sample to achieve separa- tion, then use various concentrations and matrices to improve sensitivi- ty and response. An initial chromato- gram may have multiple unretained or overlapping (coeluting) analytes. It is also possible to have peaks re- tained on the column past the meth- od run time (Figure 4). It is also pos- sible that “negative peaks” (peaks or dips below the baseline) can be seen in the chromatogram, usually appear- ing right before the unresolved peaks. Negative peaks are a visual rep- resentation of the difference or change in detector response that re- sult in response below the baseline or set point. These peaks can be caused by a number of issues including the movement of internal values such as when the injector values switch back and forth from injection to normal flow path. Another way negative peaks can be observed is when the solvent used to dilute your sample differs from the solvent composition of the HPLC system. For example, if your extracted sample of cannabis is in 100% ethanol, but the HPLC mo- bile phase starts as 50:50 water–ace- tonitrile; then you may have a signifi- cant negative peak as the ethanol hits the detector due to changes in ab- sorbance, refractive index, or conductivity. In any method development it is best to remember the old adage: “Slow and steady wins the race.” Change one parameter at a time and then move on. It is very tempting to change multiple parameters (mo- bile phase, additives, flow rate, tem- perature) all at once to save time and effort. Unfortunately, often it di- lutes the effort, and you cannot track which changes give you the best resolution. Achieving Resolution There will be times that there are only general methods available that are remotely similar to your intended Figure 5: Examples of peak resolution (R) from unresolved peaks at 0.5 to baseline resolved peaks at greater than 1.5.
  • 22. cannabis science and technology®   |   vol. 4 no. 3 cannabissciencetech.com 22 navigating the lab / analytical analysis; in that case basic param- eters become the starting point on which to build a method that provides resolution of target analytes. Peak resolution—the ability of a column to separate peaks in a chromatogram—is a complex interaction of forces and factors observed as adjacent peaks merging (coeluting) to a single peak or separating (resolving) into two or more peaks. Resolution is the rela- tionship between the differences in retention times of two adjacent peaks divided by the sum of the peak widths of the two target peaks at the baseline. Retention time or Rt is the time be- tween injection and the appearance of the peak maximum or apex. The first step in evaluating another ana- lysts’ method is to try and duplicate all the conditions, instrumentation, columns, mobile phase, and settings described then run a known test sample or standard to obtain a starting chromatogram. Peak width or band width (w) is the width of the peak or chromatograph- ic band measured at the baseline by drawing tangent lines from the inflection points of the curve that represents the peak. The resolution between two adjacent peaks of similar heights can be calculated using the resolution equation (Equation 1): [1] For example, if an analyst is separat- ing cannabis terpenoids and there are two terpenes that resolve at 7.5 min and 8.0 min with peak widths of 0.5 min and 0.75 min would have R = 2(8.0 – 7.5)/(0.5+0.75) = 0.8 Peak resolution needs to have R 0.6 to be able to discern sepa- ration between two peaks of equal height. Two peaks with values of R 1.5 are considered to have good res- olution and peaks of R 2 are fully or baseline resolved. In our example, the two terpenes would be coeluting with some minimal separation at the apexes (Figure 5). For a cannabis analyst who needed to separate all the terpenes, cannab- inoids, pesticides, and so on, effort to increase resolution would have to begin. According to the first resolu- tion equation, resolution is affected by peak width and retention time. To improve resolution the analyst would have to either increase the retention time of one of the peaks (meaning that they would have to find a way to keep the peak partitioned in the stationary phase for a longer time) or decrease the peak width. There are three basic HPLC parameters that the chromatographer can use to change conditions of their meth- od: mobile phase composition, sol- id phase chemistry, and flow rate. The usual first step to increase the amount of time an analyte spends in either phase is to change the compo- sition of the mobile phase, usually by changing the gradient program. Peaks that elute early in the chro- matogram and spend too much time in the mobile phase and are not being retained well by the stationary phase. These compounds are more polar or are hydrophilic. Most reversed-phase LC gradient methods start with a high concentration of water (50– 80%) and a lower concentration of organic mobile phase. The gener- al rule of thumb for reversed-phase gradient methods is to start or- ganic solvents low and increase to high. If you have early eluting com- pounds it means you either have to start with slightly less water mobile phase or change the stationary phase chemistry (column). Changes to the flow will not help unretained peaks and very early eluting compounds. Peaks that elute late in the chroma- togram spend too much time with the stationary phase and only elute when the organic mobile phase concen- tration is high enough to force them from the column. These compounds are less polar and more hydrophobic. To speed up late eluting compounds the organic phase can be increased more rapidly by increasing the gra- dient slope. Changes in the station- ary phase chemistry can also be used to resolve late eluters. Sometimes in- creasing flow rate can help stop late eluting peaks from being lost if they are retained on the column until after the program ends. Some instruments allow for changes in flow rate over the method run and increasing flow rate may assist with late eluting peaks in this approach. Generally, flow rate is not the first choice for peak resolution. Resolution is a function of peak width and time, which we observed in equation 1, so Table I: Eluotropic values for reversed-phase mobile phase solvents Reversed-Phase LC Mobile Phase Eluotropic value (ε0 ) Al2 O3 Water 1 Methanol 0.95 Ethanol 0.88 Isopropanol 0.82 Acetonitrile 0.65 Ethyl Acetate 0.58 Acetone 0.56 Tetrahydrofuran 0.45
  • 23. 23 cannabissciencetech.com april 2021   |   cannabis science and technology® analytical / navigating the lab by increasing flow you do decrease the peak width, but you also decrease the difference in retention times, which has a bigger impact on resolu- tion. But resolution is also a function of three other factors: retention (or capacity), separation (or selectivity), and efficiency characterized in Equation 2 for isocratic methods: [2] Retention or capacity factor (k) is the time that a sample analyte resides in the stationary phase relative to the time it spends in the mobile phase. It is calculated from time difference be- tween the analyte peak (tR ) and the unretained peak divided by the time of the unretained peak (t0 ) (Equation 3). [3] Capacity factors or retention val- ues less than five have the biggest ef- fect on resolution. For example, if k = 10 then in the resolution equation 2 – the factor for retention is 10/(1+10) which is close to 1; but if the k = 1, then the retention factor is 1/(1+1) or ½ and will have a larger impact on retention. Separation or selectivity factor (α) is the ability of a chromatography sys- tem to distinguish the chemical dif- ferences between compounds. It is measured as a ratio capacity factors (k) of the two peaks being examined (Equation 4). [4] Efficiency (N or H) is a measure of theoretical plates in a chromato- graphic system. Theoretical plates are a concept described by the Nobel prize winners Martin and Synge in which they related the theories of dis- tillation to chromatography. In dis- tillation columns for crude petrole- um, there are actual separator plates to help separate and isolate petrole- um fractions. Early petroleum distil- lation used different length columns that related to its efficiency. Chroma- tography columns do not have phys- ical plates that can be measured, so the plates are theoretical to describe the efficiency of the column. In this regard, the length of the column is called a height equivalent to a theo- retical plate (HETP) and is measured as column length (L) divided by theo- retical plates (N). Efficiency or theo- retical plates are calculated as by the relationship between peak retention Figure 6: Graphical representations of resolution factors: retention, selectivity, and efficiency. Table II: Common HPLC and LC–MS buffer additives and their corresponding pKa and pH values Buffer pKa pH Range UV Cutoff (nm) (10 mM) LC–MS TFA 0.5 1.5 210 (0.05%) Y Phosphate (pk1) 2.1 1.1–1.3 200 N Citrate (pk1) 3.1 2.1–4.1 230 N Formate 3.8 2.8–4.8 210 Y Acetate 4.8 3.8–5.8 210 Y Ammonia 9.2 8.2–10.2 200 Y
  • 24. cannabis science and technology®   |   vol. 4 no. 3 cannabissciencetech.com 24 navigating the lab / analytical time (tR ) and the peak width at base- line (wb ) (Equation 5). [5] If peak width is taken at the half height point in the peak it is called width at half height (w1/2 ) and is mul- tiplied by 5.54 instead of 16. Efficien- cy (N) can also be calculated as a re- lationship of retention time (tR ), peak height (hp ), and peak area (A) (Equation 6). Finally, efficiency can be measured as a relationship be- tween separation factor (α), col- umn length (L), and particle size (dp ) (Equations 7 and 8). [6] [7] [8] Starting with Mobile Phase Chemistry If the chromatographer wants to increase resolution, then they must find a way to increase one of the three factors: retention, selectivity, or efficiency (Figure 6). In many cases, the first place to start is altering the mobile phase instead of changing columns (stationary phase). The goal is to increase the time the peaks spend in the mobile phase. Increasing retention will result in peaks spending more time in the solid phase, mov- ing the peaks apart but it can result in band broadening (increased peak width over time of analysis) and this approach only works best on early eluting peaks (which the retention factor is less than five). One way to increase retention (k) is to use weaker solvents or ones with lower elution strengths. In my previous column, the con- cept of eluotropic value (ε0 ) was intro- duced. Eluotropic value (also known as elution strength) describes the ability of a solvent to pull an analyte from the solid phase. The larger the ε0 of the solvents of the mobile phase relates to less retention (Table I). Water has a high ε0 , so using a low- er concentration in the mobile phase can increase retention. Switching sol- vents for lower ε0 solvents such as changing methanol (ε0 =0.95) for ace- tonitrile (ε0 =0.65) is the best way to increase retention, but will increase in method analysis time. The custom- ary approach for developing methods for a sample with many types of ana- lytes is to increase k for early eluting compounds and decrease k for late eluting compounds. Since selectivity is related to re- tention, many of the same approach- es such as changing solvents is effec- tive as a method to change selectivity. Selectivity can also be changed by chemical effects to solvent through additives and pH modifiers. The chemical nature of the target ana- lytes become important, especial- ly in the understanding of pH, pKa, and pKb which are the basis for all acid-base interactions. The letter p means that value or measurement is based on a logarithmic (-log) value or measurement. Then pH is the meas- urement of hydrogen ion concentra- tion of a compound in an aqueous solution, where pH = -log [H+] and equates to relative acidity or alkalin- ity of a compound. The scale ranges from 0 to 14, where low values equate to acidic compounds and high val- ues are alkaline. Neutral for the scale is pH of 7. The pH of a solution indi- cates an acid or base, but not neces- sarily the true strength of that acid or base. To measure the strength of an acid or base, one needs to look at the pKa or pKb. The terms pKa and pKb are the -log of Ka and Kb (acid and base disso- ciation constants) that predict if a compound will donate or accept pro- tons at a specific pH. These values are true indicators for the strength of an acid or base since they are un- affected by the amount of water add- ed to the solution. For acids, small- er pKa values indicate stronger acids while in bases smaller pKb indicate stronger bases. By adding buffers to mobile phase, the chromatographer can change resolution (Table II). As methods are being developed, always start with weaker acids at the lowest functional concentration possible (~ 0.01 M) and increase in acid strength and concentration until the desired results are achieved. High lev- els of buffer (0.1 M) since extreme pH (very acidic or very basic) can damage columns and increase they viscosity of the mobile phase there- by increasing pressure in the sys- tem. Most columns are safe in the range between pH 2 to 7.5 (but con- sult column specifications). For basic or mixed sample types, mobile phase pH near neutral increases retention, while acidic sample are aided by acid- ic mobile phase. If an acid analyte is in a mobile phase whose pH is similar to the tar- get analyte’s pKa, then there is lower degree of ionization and an increase of retention can be observed. When mobile phase pH is significantly over or under an analytes pKa or pKb then the degree of ionization increases and reduces retention. So, protonated ba- sic analytes may have low retention at acidic pH while acidic analytes will have increased retention. The reverse can also be true that basic analytes in a high pH mobile phase will increase retention where acid acids will decrease in retention.
  • 25. 25 cannabissciencetech.com april 2021   |   cannabis science and technology® analytical / navigating the lab Differences between target pKa (or pKb) and mobile phase pH and pKa are of even more importance in LC– MS where ionization is critical to de- tection. Keeping mobile phase (and buffers) pH and pKa similar to the target improves resolution because it moves the ionizable target to a more neutral state, but for LC–MS to be effective the compound needs ion- ic character or to have the ability to be easily ionized. Therefore, the rule of thumb for pH, pKa, and mo- bile phase is to aim for mobile phase pH 1–2 units from the target analytes pKa within the specification range of the column. It is important to remember that not all buffers are appropriate for all ap- plications. Salts can precipitate out of solution as mobile phase composition changes. Salts are also problematic for LC–MS analysis since they can inhib- it ionization. If solids are dissolved into mobile phase it is important to re- member to filter the mobile phase and, in some cases, the mobile phase may need to be heated to dissolve solids completely. Changes in column com- partment temperature may aid in keep- ing buffers in solution. In some cases, temperature of the column compartment can be used as a tool to alter the retention and selection of a method. Keeping a constant tem- perature can often help with fine tuning a retention time by eliminating external temperature changes. Some reduction in retention (k) can be achieved by increas- ing temperature allowing for peaks to elute earlier. Many changes to resolution (retention, selectivity, and efficiency) can be made by the manipulation of the mobile phase chemistry (Figure 7). Changing Columns There will be times when all the changes to mobile phase have not resulted in the desired resolution (re- tention, selectivity, and efficiency) so then it is time to consider a different column chemistry or different physi- cal column parameters. In reversed-phase LC, the most re- tention is usually found in C18 col- umns followed in descending order to C8, C2, and so forth. The lowest retention is found in phenyl and cy- ano columns. Most reversed-phase LC systems have some form of C18 column as part of their standard ma- terials package from a manufactur- er upon set up and is often the most used or tested column to start meth- od development. The specifications for the column should designate its internal diameter (mm), length (mm), particle size (µm), and pore size in Angstroms (Å ). A fairly standard size for a starting column is 4.6 mm x 100–150 mm, 5 µm and 80–100 Å. The physical column characteris- tic can have a large effect on the res- olution, system pressure and analy- sis time. First, let us look at column length. Increasing the length of the column has a direct effect on effi- ciency from Equation 7. Doubling the length of the column does give you a resolution increase of about 1.4x, but it also doubles the pressure and anal- ysis time. Resolution is increased at the expense of time and pressure. So conversely, if you want to decrease Figure 7: Steps to change resolution by changing mobile phase parameters.
  • 26. cannabis science and technology®   |   vol. 4 no. 3 cannabissciencetech.com 26 navigating the lab / analytical back pressure and decrease analysis time then a shorter column is needed, but that will reduce resolution. The second parameter of the reso- lution from equations 7 and 8 is par- ticle size. As the particle size increas- es (without any change in column length), resolution, and efficien- cy (theoretical plates) will decrease. Smaller particles increase resolution, efficiency, and retention but they also will exponentially increase pressure of the system: P α (1/dp )2 . Modern HPLC systems have increased their ability to handle higher pressures and often can handle increased pressure from smaller particles. If smaller par- ticles are needed to maximize resolu- tion, then the chromatographer can reduce column length to reduce pres- sure and not effect efficiency dramat- ically since efficiency is inversely pro- portional to particle size and directly proportional to length. The bene- fits of this approach are shorter run times, less solvent use since column volume is reduced, and less backpres- sure with increased resolution. The diameter of a column becomes important in the discussion of pres- sure, flow, and column volume. Col- umns of diameters between 3.9– 4.6 mm range are considered to be standard bore. Diameters in the range of 2.0–3.2 mm are called narrow bore. Columns with diameters of 1.0 or less are considered microbore or capillary columns. The diameter of the column effects peak height, which can also affect efficiency as seen in Equation 6. Changes in column diameter must also consider changes in flow rate (which is the volume of mobile phase divided by time) and linear veloci- ty (µ), which is the distance mobile phase travels over time. By adjusting flow rate to maintain linear veloci- ty, peak height is increased, and band broadening is decreased allowing for improved retention. One of the final dimensions of a column is pore size. The stationary phase is composed of particles that are riddled with spaces and open- ings. The spaces allow for increased surface area and interaction between the target analytes and the stationary phase. Typical pore sizes can range from 50 Å to over one million Å. The choice of pore size is dictated by the approximate range of the molecu- lar weights of the various target ana- lytes. Most small to mid-range molec- ular weight analysis (1000 mw) can utilize 50–100 Å pores. Some special- ty molecules with stereochemistry considerations could require larger pore sizes to accommodate steric in- teractions with the stationary phase. Pure Chromatography ADVANTAGE See What It Can Do for You and Your Lab Sign up today to access Restek’s years of chromatography knowledge at www.restek.com/advantage
  • 27. 27 cannabissciencetech.com april 2021   |   cannabis science and technology® analytical / navigating the lab Small pores have larger amounts of surface area than larger pores and al- low for much more interaction be- tween molecules and the stationary phase. Band Broadening and Peak Shape A final consideration on the resolution of a method is the appearance of the peaks. Most of the calculations for peak height and peak width are made for Gaussian peaks with equal symme- try. However, as has been discussed the chemistry of the mobile phase, station- ary phase and column conditions can contribute to distortions to the peak symmetry and band broadening. Sym- metry (T) of a peak is measured by di- viding a peak down the from the apex and comparing at 10% peak height the ratio of the tailing side (B) to the ear- lier fronting side (A) in the equation T = B/A. For Gaussian peaks (Figure 8a) the sides are equal, so the ratio is 1. In fronting peaks (Figure 8b), the wider side appears first so the ratio is less than one, while tailing peaks (Figure 8c) have ratios greater than one. In most cases, peaks that fall with- in 0.9 to 1.3 are considered within ac- ceptable range. Peak fronting can be a result of not enough retention (k) on the column (that is, peak capaci- ty), or an effect of the matrix of the sample having stronger elution pow- er than the mobile phase. Fronting can happen when the analyte is overloaded on the column or in the detector and may need dilution or a smaller injec- tion volume to avoid saturation. Peak tailing can be cause by many issues in- cluding oversaturation of column or detector, or diffusion in the flow path by connectors, column voids and fit- tings. Tailing can occur from pH ef- fects if the pH of the mobile phase is close to the pKa of the sample or an- alytes. Increasing or decreasing the pH two units from the target pKa will reduce tailing. Peaks can be seen to tail as columns age and more silanols are exposed or if using columns with- out end capping. The interaction with these open silanols or the silica can create the bleeding of peaks seen in tailing. Asymmetrical peaks can reduce res- olution by decreasing efficiency and re- tention. If the chromatogram shows consistently asymmetrical peaks then take care to examine all fittings, col- umns, junctures for excess flow paths, dead volume, and air incursions. If the asymmetry persists examine the sample dilution composition and try to match the mobile phase composi- tion. Mobile phase should measure 2 pH units above or below the sample or target pKa. The chromatographer can also check the age and condition of the column and replace older columns or change to columns with end capping to increase symmetry. Final Thoughts The goal of method development is resolution of all the target compounds of interest in a sample. Sometimes targets will have to be prioritized so that maximum resolution is gained for the analytes of interest. Those analytes should be ideally near the middle of your chromatogram away from the solvent front and before any chances of band broadening can occur. Resolution is dependent on the key factors of efficiency (N), retention (k), and selectivity (α). Efficiency can be increased by increasing column length (L) or in some cases modifying or con- trolling column temperature. Other factors that can increase efficiency in- clude reducing dead volume, peak tail- ing and finally particle size. Selectivity (α) and retention are linked together and can be changed by changing sim- ilar parameters such as the elution power of the mobile phases, chang- ing the pH of the mobile phase by the use of additives or buffers, or by final- ly changing the stationary phase chemistry. The first changes during method de- velop often revolve around changes to the chemistry and composition of the mobile phase. If those changes fail to produce adequate resolution, then the analyst should start to examine chang- es to physical system parameters and finally the column or stationary phase chemistry and dimensions. There are often no shortcuts or out-of-the-box solutions to method development. One should always try to find references as a starting point, but ultimately those methods will have to be adjusted to the particular parameters and idiosyn- crasies of the individual system and the target samples. The best approach is to take changes one at a time and work in a slow, steady pace to optimize all the parameters of the mobile phase, stationary phase, and system to achieve the best method for your analysis. Figure 8: Gaussian peaks: (a) equal; (b) fronting peaks; (c) tailing peaks.