Climatograma temp vs humedad 2
•Download as XLSX, PDF•
0 likes•151 views
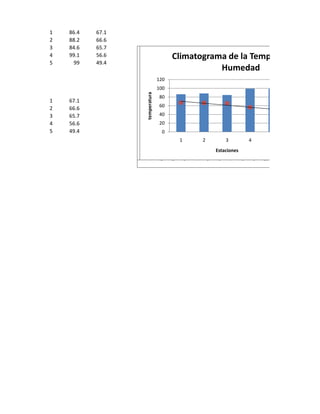
The document contains a table with 5 rows showing temperature and humidity values for different stations across time. It also includes two line graphs, one plotting temperature against humidity with 5 data points, and another plotting temperature over 11 time periods, with varying values between 40-120 on the y-axes.
Report
Share
Report
Share

Recommended
Comparativo Temperatura Friccion Castrol 15w40 Vs Lubriquem 20w50 Am
The document reports on an evaluation of motor oil temperatures. It shows that Castrol 15W40 oil resulted in lower friction temperatures than Lubriquem 20W50 AM oil over 10 minutes of testing at 32 pounds/feet of torque. The temperature difference increased over time, with a maximum difference of 13.3 degrees Celsius. Adding a 1% additive reduced friction temperatures for both oils.
Metals And Non Metals – Physical And Chemical Properties
The document discusses materials science and engineering concepts. It lists companies in Beaver County that work with metals and provides examples of metal melting processes like vacuum induction melting and induction skull melting. It also outlines a procedure for calculating alloy compositions and lists elements and their aimed percentages for an alloy. The remainder of the document describes a lesson plan that involves demonstrating materials properties and applications through experiments with density, reactivity, shape memory alloys and more.
Fotos familiares
El documento contiene varias fotos de una familia durante sus vacaciones en el Decameron de Punta Sal en Colombia. Las fotos muestran a los miembros de la familia nadando en la piscina, cenando en un restaurante elegante, jugando baloncesto en la piscina, contando historias mientras toman el sol y jugando un juego en una canoa, con una foto final de su último almuerzo allí. En general, parecen haber disfrutado de actividades recreativas y culinarias durante su estadía en el resort.
Mariana Classic - 3 quartos - Botafogo
A empresa de tecnologia anunciou um novo smartphone com câmera avançada, bateria de longa duração e processador rápido. O dispositivo também possui tela grande e armazenamento expandível. O lançamento está programado para o próximo mês com preço inicial sugerido abaixo dos principais concorrentes.
Global snapshot
Grant Thornton is one of the world's leading professional services networks, with over 40,000 people working in 130 countries. They provide assurance, tax, and advisory services to privately owned businesses, public companies, and public sector entities. While one of the largest networks, Grant Thornton prides itself on providing more partner attention and a personal client experience compared to the "Big 4" accounting firms. They have experienced strong global growth in recent years and aim to understand each client's unique needs and challenges.
Virus
Este documento habla sobre los virus informáticos, sus características y daños. Explica que los virus son programas maliciosos que infectan otros archivos e incrustan su código dañino. También menciona ejemplos de virus y antivirus comunes. Finalmente, detalla los síntomas de una computadora infectada y asigna a los estudiantes la tarea de crear un video de 3 minutos sobre virus e antivirus.
Cuestionario de exel
Este documento contiene una lista de 15 estudiantes de un colegio de bachilleres con su número de control, nombres, género y tipo de música favorita. También incluye una tabla con información sobre artistas musicales como canciones destacadas, año de lanzamiento y número de discos publicados. Al final hay preguntas sobre si se conoce la biografía y en persona de uno de los estudiantes llamado Merino Martínez Jorge Luis.
Twitter smart card
This document provides guidelines for safely using Twitter. It recommends only connecting with people you know, assuming anything you post is public, and ensuring family also practices privacy. It advises avoiding posting photos that clearly show your face. The document also outlines how to configure privacy settings to limit visibility of tweets, followers, and profile information to approved accounts only. It provides tips like avoiding hashtags and location data, changing usernames periodically, and using nicknames instead of real names or photos.
Classicfurniture document sharing
Choose classic furniture to decorate your home. Classic furniture has unique designs that are durable and resistant to dirt and damage. There are many outdoor furniture options like lounge chairs, dining sets, and sofas that can enhance the look of your home. These classic pieces come in various styles, materials, and are low maintenance. Visit classicfurniture4u.com to browse their selection of classic and modern furniture to beautify your home.
Giuliano's certifications
The document discusses the benefits of exercise for mental health. Regular physical activity can help reduce anxiety and depression and improve mood and cognitive functioning. Exercise causes chemical changes in the brain that may help protect against mental illness and improve symptoms.
Nilai Kelas Iii Sd Merak
This document contains the test scores of 31 third grade students from SD Merak in three subjects: science, social studies, and math. Based on an ANOVA analysis, there were no statistically significant differences in average scores between the three subjects. Post hoc tests confirmed that all subject pairs were homogeneous subsets.
States of matter boiling point & freezing point (enhance)
This document summarizes an experiment on the states of matter involving boiling point and freezing point. It includes the names of three students, an introduction to changes in states of matter through heating and cooling, and descriptions of the procedures, results, and discussion sections of the experiment. The procedures involved using a temperature sensor to collect data on the heating and cooling of water and producing graphs of temperature over time. The results showed the melting point of ice at 0°C and the boiling point of water remaining at 100°C as heat was applied. The discussion analyzed the experiment results and particle behavior in the solid, liquid, and gas phases of water.
Avance de Crédito Infonavit al 08 julio 2012
The document provides credit program indicators and progress as of July 8, 2012 compared to annual targets for 2012. It shows the targets and credits formalized for different credit ranges (less than 2 years, 2-3.99 years, 4-10.99 years, and over 10.99 years) for each Mexican state and nationally. Overall, credit formalizations were at 59.08% of the national target as of that date, with higher percentages achieved for shorter loan durations and lower percentages for longer durations.
Avance de crédito infonavit al 29 jul-12
The document provides statistics on Infonavit's credit program in Mexico as of July 29, 2012 compared to annual targets for 2012. It shows the number and percentage of loans formalized for different price ranges of homes in each Mexican state. Overall, 84,202 loans valued under $2 vsm were formalized nationally, reaching 76.55% of the target. The top performing states were Durango at 151.54% of its target and Tlaxcala at 97.58% of its target. The document also breaks down the data by zones within Mexico.
Notas Fs111
The document appears to be a table containing student grades across multiple subjects and evaluation periods. It includes the student identification number, name, surname, and grades in various subjects labeled L1 through L9, with accompanying probabilities labeled Prb1 through Prb9. There are 20 students listed with their various subject grades and an overall final grade labeled NF.
Varianza ecologia
This document contains data on the diameter at breast height (Dbh) in centimeters and meters of several trees. It also includes the average Dbh, variance, standard deviation, and standard error of the sample. The Dbh measurements range from 19.4 cm to 74.4 cm, with an average of 0.457 meters and a standard deviation of 0.3482.
Nattaly jimenez cruz bosque yunque
Este documento proporciona información sobre el Bosque Nacional del Caribe (El Yunque) en Puerto Rico. Explica que se encuentra a 49 km de San Juan y describe cómo llegar desde la capital. Además, detalla que el bosque cubre 11,500 hectáreas y contiene picos de hasta 3,533 pies. Finalmente, brinda datos sobre la temperatura, humedad y vientos en diferentes partes del bosque.
Graficas de caobas
This document contains numerical data showing 8 measurements of some variable at given time points, with most values close to zero but some more negative. The data ranges from 7.1 to 21.85 and includes both positive and negative values, suggesting it represents fluctuations of something over time.
Grafica de humedad vs estacione 1
Nattaly Jimenez Cruz es una estudiante que asiste a un laboratorio de ecología los jueves a la 1:30 pm. El número de identificación de Nattaly es 7366055943500.
More Related Content
Viewers also liked
Cuestionario de exel
Este documento contiene una lista de 15 estudiantes de un colegio de bachilleres con su número de control, nombres, género y tipo de música favorita. También incluye una tabla con información sobre artistas musicales como canciones destacadas, año de lanzamiento y número de discos publicados. Al final hay preguntas sobre si se conoce la biografía y en persona de uno de los estudiantes llamado Merino Martínez Jorge Luis.
Twitter smart card
This document provides guidelines for safely using Twitter. It recommends only connecting with people you know, assuming anything you post is public, and ensuring family also practices privacy. It advises avoiding posting photos that clearly show your face. The document also outlines how to configure privacy settings to limit visibility of tweets, followers, and profile information to approved accounts only. It provides tips like avoiding hashtags and location data, changing usernames periodically, and using nicknames instead of real names or photos.
Classicfurniture document sharing
Choose classic furniture to decorate your home. Classic furniture has unique designs that are durable and resistant to dirt and damage. There are many outdoor furniture options like lounge chairs, dining sets, and sofas that can enhance the look of your home. These classic pieces come in various styles, materials, and are low maintenance. Visit classicfurniture4u.com to browse their selection of classic and modern furniture to beautify your home.
Giuliano's certifications
The document discusses the benefits of exercise for mental health. Regular physical activity can help reduce anxiety and depression and improve mood and cognitive functioning. Exercise causes chemical changes in the brain that may help protect against mental illness and improve symptoms.
Viewers also liked (8)
Similar to Climatograma temp vs humedad 2
Nilai Kelas Iii Sd Merak
This document contains the test scores of 31 third grade students from SD Merak in three subjects: science, social studies, and math. Based on an ANOVA analysis, there were no statistically significant differences in average scores between the three subjects. Post hoc tests confirmed that all subject pairs were homogeneous subsets.
States of matter boiling point & freezing point (enhance)
This document summarizes an experiment on the states of matter involving boiling point and freezing point. It includes the names of three students, an introduction to changes in states of matter through heating and cooling, and descriptions of the procedures, results, and discussion sections of the experiment. The procedures involved using a temperature sensor to collect data on the heating and cooling of water and producing graphs of temperature over time. The results showed the melting point of ice at 0°C and the boiling point of water remaining at 100°C as heat was applied. The discussion analyzed the experiment results and particle behavior in the solid, liquid, and gas phases of water.
Avance de Crédito Infonavit al 08 julio 2012
The document provides credit program indicators and progress as of July 8, 2012 compared to annual targets for 2012. It shows the targets and credits formalized for different credit ranges (less than 2 years, 2-3.99 years, 4-10.99 years, and over 10.99 years) for each Mexican state and nationally. Overall, credit formalizations were at 59.08% of the national target as of that date, with higher percentages achieved for shorter loan durations and lower percentages for longer durations.
Avance de crédito infonavit al 29 jul-12
The document provides statistics on Infonavit's credit program in Mexico as of July 29, 2012 compared to annual targets for 2012. It shows the number and percentage of loans formalized for different price ranges of homes in each Mexican state. Overall, 84,202 loans valued under $2 vsm were formalized nationally, reaching 76.55% of the target. The top performing states were Durango at 151.54% of its target and Tlaxcala at 97.58% of its target. The document also breaks down the data by zones within Mexico.
Notas Fs111
The document appears to be a table containing student grades across multiple subjects and evaluation periods. It includes the student identification number, name, surname, and grades in various subjects labeled L1 through L9, with accompanying probabilities labeled Prb1 through Prb9. There are 20 students listed with their various subject grades and an overall final grade labeled NF.
Similar to Climatograma temp vs humedad 2 (6)
States of matter boiling point & freezing point (enhance)
States of matter boiling point & freezing point (enhance)
More from princesanattaly
Varianza ecologia
This document contains data on the diameter at breast height (Dbh) in centimeters and meters of several trees. It also includes the average Dbh, variance, standard deviation, and standard error of the sample. The Dbh measurements range from 19.4 cm to 74.4 cm, with an average of 0.457 meters and a standard deviation of 0.3482.
Nattaly jimenez cruz bosque yunque
Este documento proporciona información sobre el Bosque Nacional del Caribe (El Yunque) en Puerto Rico. Explica que se encuentra a 49 km de San Juan y describe cómo llegar desde la capital. Además, detalla que el bosque cubre 11,500 hectáreas y contiene picos de hasta 3,533 pies. Finalmente, brinda datos sobre la temperatura, humedad y vientos en diferentes partes del bosque.
Graficas de caobas
This document contains numerical data showing 8 measurements of some variable at given time points, with most values close to zero but some more negative. The data ranges from 7.1 to 21.85 and includes both positive and negative values, suggesting it represents fluctuations of something over time.
Grafica de humedad vs estacione 1
Nattaly Jimenez Cruz es una estudiante que asiste a un laboratorio de ecología los jueves a la 1:30 pm. El número de identificación de Nattaly es 7366055943500.
Grafica de datos de estadistica 2 1
El documento presenta datos estadísticos que muestran el diámetro de tronco (DBH) de árboles en función de su edad. Los datos se ajustan a una función lineal con una pendiente de 1.23 y una ordenada al origen de 0.24.
Grafica de datos de estadistica 2
El documento presenta datos estadísticos que muestran el diámetro de tronco (DBH) de árboles en función de su edad. Los datos se ajustan a una función lineal con una pendiente de 1.23 y una ordenada al origen de 0.24.
Debh todos
Este documento presenta los resultados de un estudio de mapeo de vegetación de caoba hondureña en 4 cuadrantes. En cada cuadrante se midió la dirección, distancia y diámetro de los árboles encontrados. Los datos incluyen el número de árbol, dirección, distancia y diámetro a la altura del pecho para cada especimen.
Climatograma de temp vs humedad
This document contains a climatogram chart showing temperature and humidity data for a dry forest over 4 time periods. The temperature readings ranged from 84.6 to 88.2 and the humidity readings ranged from 65.7 to 67.1. The chart plots the temperature and humidity values against each other with temperature on the vertical axis and humidity on the horizontal axis.
Grafica de datos de estadistica 2
El documento presenta datos estadísticos que muestran el diámetro de tronco (DBH) de árboles en función de su edad. Los datos se ajustan a una función lineal con una pendiente de 1.23 y una ordenada al origen de 0.24.
Informe de bosque seco de guanica 1
Este documento presenta las instrucciones para un proyecto de investigación en el Bosque Seco de Guánica. Se deben recopilar y organizar datos como diámetro, altura y distancia de árboles en 4 estaciones. También se requiere un mapa de la ubicación, gráficas de clima, y descripciones de las estaciones de estudio. Finalmente, se analizarán los datos sobre temperatura, humedad y diámetro de los árboles para establecer relaciones e hipótesis.
More from princesanattaly (15)
Recently uploaded
Barbie Movie Review - The Astras.pdfffff
Barbie Movie Review has gotten brilliant surveys for its fun and creative story. Coordinated by Greta Gerwig, it stars Margot Robbie as Barbie and Ryan Gosling as Insight. Critics adore its perky humor, dynamic visuals, and intelligent take on the notorious doll's world. It's lauded for being engaging for both kids and grown-ups. The Astras profoundly prescribes observing the Barbie Review for a delightful and colorful cinematic involvement.https://theastras.com/hca-member-gradebooks/hca-gradebook-barbie/
定制(uow毕业证书)卧龙岗大学毕业证文凭学位证书原版一模一样
原版一模一样【微信:741003700 】【(uow毕业证书)卧龙岗大学毕业证文凭学位证书】【微信:741003700 】学位证,留信认证(真实可查,永久存档)offer、雅思、外壳等材料/诚信可靠,可直接看成品样本,帮您解决无法毕业带来的各种难题!外壳,原版制作,诚信可靠,可直接看成品样本。行业标杆!精益求精,诚心合作,真诚制作!多年品质 ,按需精细制作,24小时接单,全套进口原装设备。十五年致力于帮助留学生解决难题,包您满意。
本公司拥有海外各大学样板无数,能完美还原海外各大学 Bachelor Diploma degree, Master Degree Diploma
1:1完美还原海外各大学毕业材料上的工艺:水印,阴影底纹,钢印LOGO烫金烫银,LOGO烫金烫银复合重叠。文字图案浮雕、激光镭射、紫外荧光、温感、复印防伪等防伪工艺。材料咨询办理、认证咨询办理请加学历顾问Q/微741003700
留信网认证的作用:
1:该专业认证可证明留学生真实身份
2:同时对留学生所学专业登记给予评定
3:国家专业人才认证中心颁发入库证书
4:这个认证书并且可以归档倒地方
5:凡事获得留信网入网的信息将会逐步更新到个人身份内,将在公安局网内查询个人身份证信息后,同步读取人才网入库信息
6:个人职称评审加20分
7:个人信誉贷款加10分
8:在国家人才网主办的国家网络招聘大会中纳入资料,供国家高端企业选择人才
DIGIDEVTV A New area of OTT Distribution
At Digidev, we are working to be the leader in interactive streaming platforms of choice by smart device users worldwide.
Our goal is to become the ultimate distribution service of entertainment content. The Digidev application will offer the next generation television highway for users to discover and engage in a variety of content. While also providing a fresh and
innovative approach towards advertainment with vast revenue opportunities. Designed and developed by Joe Q. Bretz
Modern Radio Frequency Access Control Systems: The Key to Efficiency and Safety
Today's fast-paced environment worries companies of all sizes about efficiency and security. Businesses are constantly looking for new and better solutions to solve their problems, whether it's data security or facility access. RFID for access control technologies have revolutionized this.
Orpah Winfrey Dwayne Johnson: Titans of Influence and Inspiration
Introduction
In the realm of entertainment, few names resonate as Orpah Winfrey Dwayne Johnson. Both figures have carved unique paths in the industry. achieving unparalleled success and becoming iconic symbols of perseverance, resilience, and inspiration. This article delves into the lives, careers. and enduring legacies of Orpah Winfrey Dwayne Johnson. exploring how their journeys intersect and what we can learn from their remarkable stories.
Follow us on: Pinterest
Early Life and Backgrounds
Orpah Winfrey: From Humble Beginnings to Media Mogul
Orpah Winfrey, often known as Oprah due to a misspelling on her birth certificate. was born on January 29, 1954, in Kosciusko, Mississippi. Raised in poverty by her grandmother, Winfrey's early life was marked by hardship and adversity. Despite these challenges. she demonstrated a keen intellect and an early talent for public speaking.
Winfrey's journey to success began with a scholarship to Tennessee State University. where she studied communication. Her first job in media was as a co-anchor for the local evening news in Nashville. This role paved the way for her eventual transition to talk show hosting. where she found her true calling.
Dwayne Johnson: From Wrestling Royalty to Hollywood Superstar
Dwayne Johnson, also known by his ring name "The Rock," was born on May 2, 1972, in Hayward, California. He comes from a family of professional wrestlers, with both his father, Rocky Johnson. and his grandfather, Peter Maivia, being notable figures in the wrestling world. Johnson's early life was spent moving between New Zealand and the United States. experiencing a variety of cultural influences.
Before entering the world of professional wrestling. Johnson had aspirations of becoming a professional football player. He played college football at the University of Miami. where he was part of a national championship team. But, injuries curtailed his football career, leading him to follow in his family's footsteps and enter the wrestling ring.
Career Milestones
Orpah Winfrey: The Queen of All Media
Winfrey's career breakthrough came in 1986 when she launched "The Oprah Winfrey Show." The show became a cultural phenomenon. drawing millions of viewers daily and earning many awards. Winfrey's empathetic and candid interviewing style resonated with audiences. helping her tackle diverse and often challenging topics.
Beyond her talk show, Winfrey expanded her empire to include the creation of Harpo Productions. a multimedia production company. She also launched "O, The Oprah Magazine" and OWN: Oprah Winfrey Network, further solidifying her status as a media mogul.
Dwayne Johnson: From The Ring to The Big Screen
Dwayne Johnson's wrestling career took off in the late 1990s. when he became one of the most charismatic and popular figures in WWE. His larger-than-life persona and catchphrases endeared him to fans. making him a household name. But, Johnson had ambitions beyond the wrestling ring.
In the early 20
Top IPTV UK Providers of A Comprehensive Review.pdf
The television landscape in the UK has evolved significantly with the rise of Internet Protocol Television (IPTV). IPTV offers a modern alternative to traditional cable and satellite TV, allowing viewers to stream live TV, on-demand videos, and other multimedia content directly to their devices over the internet. This review provides an in-depth look at the top IPTV UK providers, their features, pricing, and what sets them apart.
高仿(nyu毕业证书)美国纽约大学毕业证文凭毕业证原版一模一样
原版纸张【微信:741003700 】【(nyu毕业证书)美国纽约大学毕业证、文凭毕业证】【微信:741003700 】学位证,留信认证(真实可查,永久存档)offer、雅思、外壳等材料/诚信可靠,可直接看成品样本,帮您解决无法毕业带来的各种难题!外壳,原版制作,诚信可靠,可直接看成品样本。行业标杆!精益求精,诚心合作,真诚制作!多年品质 ,按需精细制作,24小时接单,全套进口原装设备。十五年致力于帮助留学生解决难题,包您满意。
本公司拥有海外各大学样板无数,能完美还原海外各大学 Bachelor Diploma degree, Master Degree Diploma
1:1完美还原海外各大学毕业材料上的工艺:水印,阴影底纹,钢印LOGO烫金烫银,LOGO烫金烫银复合重叠。文字图案浮雕、激光镭射、紫外荧光、温感、复印防伪等防伪工艺。材料咨询办理、认证咨询办理请加学历顾问Q/微741003700
留信网认证的作用:
1:该专业认证可证明留学生真实身份
2:同时对留学生所学专业登记给予评定
3:国家专业人才认证中心颁发入库证书
4:这个认证书并且可以归档倒地方
5:凡事获得留信网入网的信息将会逐步更新到个人身份内,将在公安局网内查询个人身份证信息后,同步读取人才网入库信息
6:个人职称评审加20分
7:个人信誉贷款加10分
8:在国家人才网主办的国家网络招聘大会中纳入资料,供国家高端企业选择人才
_7 OTT App Builders to Support the Development of Your Video Applications_.pdf
Due to their ability to produce engaging content more quickly, over-the-top (OTT) app builders have made the process of creating video applications more accessible. The invitation to explore these platforms emphasizes how over-the-top (OTT) applications hold the potential to transform digital entertainment.
哪里买(osu毕业证书)美国俄勒冈州立大学毕业证双学位证书原版一模一样
原版纸张【微信:741003700 】【(osu毕业证书)美国俄勒冈州立大学毕业证,双学位证书】【微信:741003700 】学位证,留信认证(真实可查,永久存档)offer、雅思、外壳等材料/诚信可靠,可直接看成品样本,帮您解决无法毕业带来的各种难题!外壳,原版制作,诚信可靠,可直接看成品样本。行业标杆!精益求精,诚心合作,真诚制作!多年品质 ,按需精细制作,24小时接单,全套进口原装设备。十五年致力于帮助留学生解决难题,包您满意。
本公司拥有海外各大学样板无数,能完美还原海外各大学 Bachelor Diploma degree, Master Degree Diploma
1:1完美还原海外各大学毕业材料上的工艺:水印,阴影底纹,钢印LOGO烫金烫银,LOGO烫金烫银复合重叠。文字图案浮雕、激光镭射、紫外荧光、温感、复印防伪等防伪工艺。材料咨询办理、认证咨询办理请加学历顾问Q/微741003700
留信网认证的作用:
1:该专业认证可证明留学生真实身份
2:同时对留学生所学专业登记给予评定
3:国家专业人才认证中心颁发入库证书
4:这个认证书并且可以归档倒地方
5:凡事获得留信网入网的信息将会逐步更新到个人身份内,将在公安局网内查询个人身份证信息后,同步读取人才网入库信息
6:个人职称评审加20分
7:个人信誉贷款加10分
8:在国家人才网主办的国家网络招聘大会中纳入资料,供国家高端企业选择人才
The Evolution of the Leonardo DiCaprio Haircut: A Journey Through Style and C...
Leonardo DiCaprio, a name synonymous with Hollywood stardom and acting excellence. has captivated audiences for decades with his talent and charisma. But, the Leonardo DiCaprio haircut is one aspect of his public persona that has garnered attention. From his early days as a teenage heartthrob to his current status as a seasoned actor and environmental activist. DiCaprio's hairstyles have evolved. reflecting both his personal growth and the changing trends in fashion. This article delves into the many phases of the Leonardo DiCaprio haircut. exploring its significance and impact on pop culture.
Authenticity in Motion Pictures: How Steve Greisen Retains Real Stories
Learn about Steve Greisen's dedication to capture the spirit of his subjects in his documentaries with honesty and integrity.
The Unbelievable Tale of Dwayne Johnson Kidnapping: A Riveting Saga
Introduction
The notion of Dwayne Johnson kidnapping seems straight out of a Hollywood thriller. Dwayne "The Rock" Johnson, known for his larger-than-life persona, immense popularity. and action-packed filmography, is the last person anyone would envision being a victim of kidnapping. Yet, the bizarre and riveting tale of such an incident, filled with twists and turns. has captured the imagination of many. In this article, we delve into the intricate details of this astonishing event. exploring every aspect, from the dramatic rescue operation to the aftermath and the lessons learned.
Follow us on: Pinterest
The Origins of the Dwayne Johnson Kidnapping Saga
Dwayne Johnson: A Brief Background
Before discussing the specifics of the kidnapping. it is crucial to understand who Dwayne Johnson is and why his kidnapping would be so significant. Born May 2, 1972, Dwayne Douglas Johnson is an American actor, producer, businessman. and former professional wrestler. Known by his ring name, "The Rock," he gained fame in the World Wrestling Federation (WWF, now WWE) before transitioning to a successful career in Hollywood.
Johnson's filmography includes blockbuster hits such as "The Fast and the Furious" series, "Jumanji," "Moana," and "San Andreas." His charismatic personality, impressive physique. and action-star status have made him a beloved figure worldwide. Thus, the news of his kidnapping would send shockwaves across the globe.
Setting the Scene: The Day of the Kidnapping
The incident of Dwayne Johnson's kidnapping began on an ordinary day. Johnson was filming his latest high-octane action film set to break box office records. The location was a remote yet scenic area. chosen for its rugged terrain and breathtaking vistas. perfect for the film's climactic scenes.
But, beneath the veneer of normalcy, a sinister plot was unfolding. Unbeknownst to Johnson and his team, a group of criminals had planned his abduction. hoping to leverage his celebrity status for a hefty ransom. The stage was set for an event that would soon dominate worldwide headlines and social media feeds.
The Abduction: Unfolding the Dwayne Johnson Kidnapping
The Moment of Capture
On the day of the kidnapping, everything seemed to be proceeding as usual on set. Johnson and his co-stars and crew were engrossed in shooting a particularly demanding scene. As the day wore on, the production team took a short break. providing the kidnappers with the perfect opportunity to strike.
The abduction was executed with military precision. A group of masked men, armed and organized, infiltrated the set. They created chaos, taking advantage of the confusion to isolate Johnson. Johnson was outnumbered and caught off guard despite his formidable strength and fighting skills. The kidnappers overpowered him, bundled him into a waiting vehicle. and sped away, leaving everyone on set in a state of shock and disbelief.
The Immediate Aftermath
The immediate aftermath of the Dwayne Johnson kidnappin
Meet Dinah Mattingly – Larry Bird’s Partner in Life and Love
Get an intimate look at Dinah Mattingly’s life alongside NBA icon Larry Bird. From their humble beginnings to their life today, discover the love and partnership that have defined their relationship.
Divertidamente SLIDE muito lindo e criativo, pptx
Slide criativo e muito lindo, apenas editar, muito simples
原版制作(Mercer毕业证书)摩斯大学毕业证在读证明一模一样
学校原件一模一样【微信:741003700 】《(Mercer毕业证书)摩斯大学毕业证》【微信:741003700 】学位证,留信认证(真实可查,永久存档)原件一模一样纸张工艺/offer、雅思、外壳等材料/诚信可靠,可直接看成品样本,帮您解决无法毕业带来的各种难题!外壳,原版制作,诚信可靠,可直接看成品样本。行业标杆!精益求精,诚心合作,真诚制作!多年品质 ,按需精细制作,24小时接单,全套进口原装设备。十五年致力于帮助留学生解决难题,包您满意。
本公司拥有海外各大学样板无数,能完美还原。
1:1完美还原海外各大学毕业材料上的工艺:水印,阴影底纹,钢印LOGO烫金烫银,LOGO烫金烫银复合重叠。文字图案浮雕、激光镭射、紫外荧光、温感、复印防伪等防伪工艺。材料咨询办理、认证咨询办理请加学历顾问Q/微741003700
【主营项目】
一.毕业证【q微741003700】成绩单、使馆认证、教育部认证、雅思托福成绩单、学生卡等!
二.真实使馆公证(即留学回国人员证明,不成功不收费)
三.真实教育部学历学位认证(教育部存档!教育部留服网站永久可查)
四.办理各国各大学文凭(一对一专业服务,可全程监控跟踪进度)
如果您处于以下几种情况:
◇在校期间,因各种原因未能顺利毕业……拿不到官方毕业证【q/微741003700】
◇面对父母的压力,希望尽快拿到;
◇不清楚认证流程以及材料该如何准备;
◇回国时间很长,忘记办理;
◇回国马上就要找工作,办给用人单位看;
◇企事业单位必须要求办理的
◇需要报考公务员、购买免税车、落转户口
◇申请留学生创业基金
留信网认证的作用:
1:该专业认证可证明留学生真实身份
2:同时对留学生所学专业登记给予评定
3:国家专业人才认证中心颁发入库证书
4:这个认证书并且可以归档倒地方
5:凡事获得留信网入网的信息将会逐步更新到个人身份内,将在公安局网内查询个人身份证信息后,同步读取人才网入库信息
6:个人职称评审加20分
7:个人信誉贷款加10分
8:在国家人才网主办的国家网络招聘大会中纳入资料,供国家高端企业选择人才
240529_Teleprotection Global Market Report 2024.pdf
The teleprotection market size has grown
exponentially in recent years. It will grow from
$21.92 billion in 2023 to $28.11 billion in 2024 at a
compound annual growth rate (CAGR) of 28.2%. The
teleprotection market size is expected to see
exponential growth in the next few years. It will grow
to $70.77 billion in 2028 at a compound annual
growth rate (CAGR) of 26.0%.
Everything You Need to Know About IPTV Ireland.pdf
The way we consume television has evolved dramatically over the past decade. Internet Protocol Television (IPTV) has emerged as a popular alternative to traditional cable and satellite TV, offering a wide range of channels and on-demand content via the internet. In Ireland, IPTV is rapidly gaining traction, with Xtreame HDTV being one of the prominent providers in the market. This comprehensive guide will delve into everything you need to know about IPTV Ireland, focusing on Xtreame HDTV, its features, benefits, and how it is revolutionizing TV viewing for Irish audiences.
Recently uploaded (20)
Modern Radio Frequency Access Control Systems: The Key to Efficiency and Safety
Modern Radio Frequency Access Control Systems: The Key to Efficiency and Safety
Orpah Winfrey Dwayne Johnson: Titans of Influence and Inspiration
Orpah Winfrey Dwayne Johnson: Titans of Influence and Inspiration
Top IPTV UK Providers of A Comprehensive Review.pdf
Top IPTV UK Providers of A Comprehensive Review.pdf
_7 OTT App Builders to Support the Development of Your Video Applications_.pdf
_7 OTT App Builders to Support the Development of Your Video Applications_.pdf
The Evolution of the Leonardo DiCaprio Haircut: A Journey Through Style and C...
The Evolution of the Leonardo DiCaprio Haircut: A Journey Through Style and C...
Authenticity in Motion Pictures: How Steve Greisen Retains Real Stories
Authenticity in Motion Pictures: How Steve Greisen Retains Real Stories
The Unbelievable Tale of Dwayne Johnson Kidnapping: A Riveting Saga
The Unbelievable Tale of Dwayne Johnson Kidnapping: A Riveting Saga
Meet Dinah Mattingly – Larry Bird’s Partner in Life and Love
Meet Dinah Mattingly – Larry Bird’s Partner in Life and Love
240529_Teleprotection Global Market Report 2024.pdf
240529_Teleprotection Global Market Report 2024.pdf
I Know Dino Trivia: Part 3. Test your dino knowledge
I Know Dino Trivia: Part 3. Test your dino knowledge
Everything You Need to Know About IPTV Ireland.pdf
Everything You Need to Know About IPTV Ireland.pdf
Climatograma temp vs humedad 2
- 1. 1 86.4 67.1 2 88.2 66.6 3 84.6 65.7 120 4 99.1 56.6 120 Climatograma de la Temperatura vs 5 99 49.4 100 Humedad 100 120 80 80 100 temperatura 60 80 1 67.1 60 60 2 66.6 40 40 3 65.7 40 4 56.6 20 20 5 49.4 0 20 1 2 3 4 5 0 0 1 2 3 4 5 6Estaciones 9 10 11 7 8 1 2 3 4 5 6 7 8 9 10
- 2. la Temperatura vs edad 120 100 H 80 u m Series1 60 ed ad Series1 Series1 40 Series2 20 0 5 11 12 13 14 10 11 12 13