Download to read offline
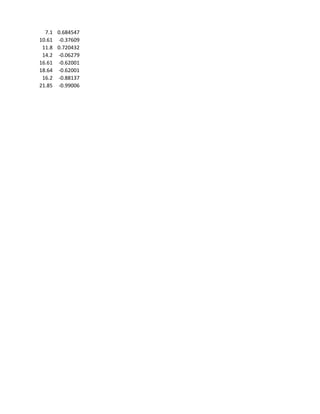
This document contains numerical data showing 8 measurements of some variable at given time points, with most values close to zero but some more negative. The data ranges from 7.1 to 21.85 and includes both positive and negative values, suggesting it represents fluctuations of something over time.


