Climate Graph
•Download as PPT, PDF•
0 likes•258 views

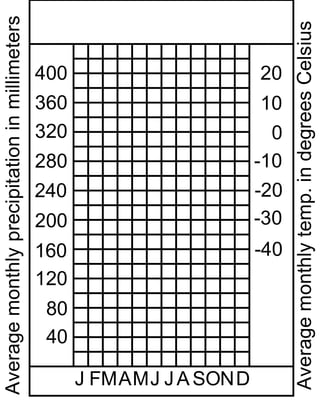
The document shows a line graph with average monthly temperature in degrees Celsius on the y-axis ranging from -40 to 40, and average monthly precipitation in millimeters on the x-axis ranging from 0 to 400. The x-axis is labeled with the months of the year from January to December. The graph appears to show the relationship between average temperature and precipitation amounts over the course of a year.

Recommended
More Related Content
Viewers also liked
Viewers also liked (19)
More from Keith Webster
More from Keith Webster (20)
Recently uploaded
Recently uploaded (20)
Climate Graph
- 1. 20 10 0 -10 -20 -30 -40 40 80 120 160 200 240 280 320 360 400 Average monthly temp. in degrees Celsius Average monthly precipitation in millimeters J F M A M J J A S O N D