Download to read offline
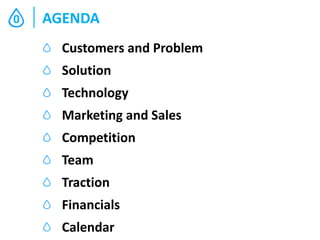


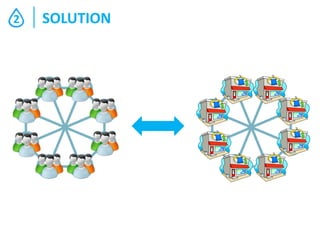
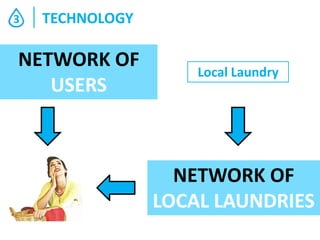
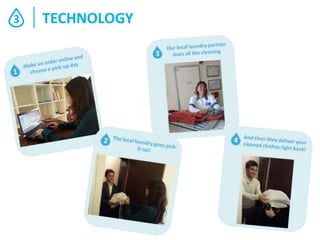

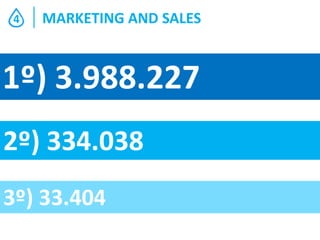

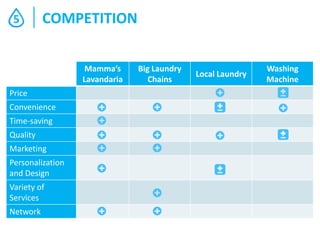
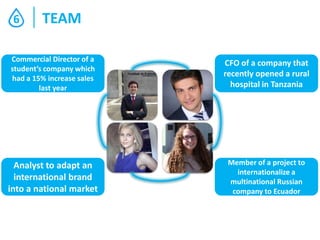
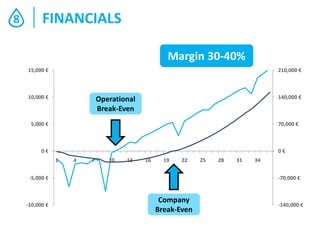


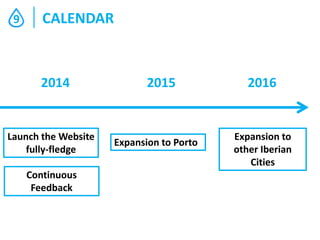

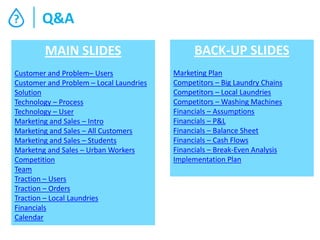
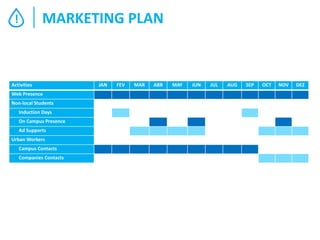
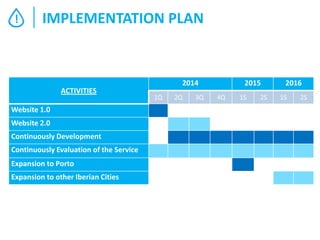
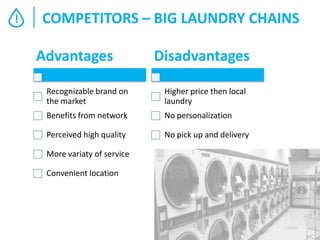
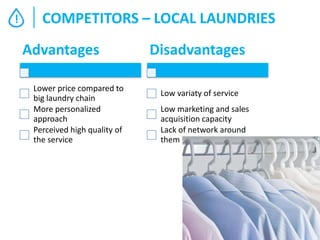
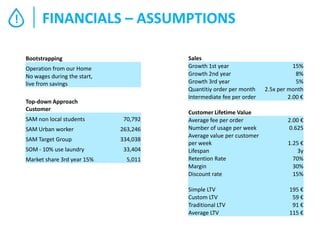
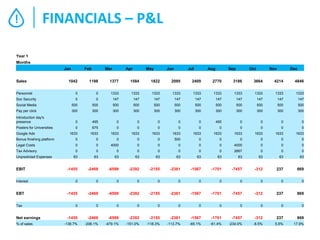
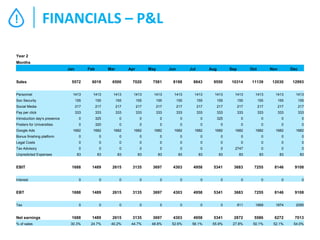

This document provides an overview of a proposed laundry service business called Mamma's Lavandaria. The presentation covers key aspects of the business including customers and problems addressed, the proposed solution, technology platform, marketing and sales strategy, competition, team, traction to date, and financial projections. Specifically, the business aims to provide a time-saving laundry service for students and urban workers by connecting them with a network of local laundries. The technology enables users to order pickup and delivery of laundry through a mobile app or website. An aggressive marketing plan targets students directly with an emphasis on campus marketing. Financial projections estimate profitability within 3 years as the business expands across cities in Portugal and other parts of Iberia.