Circle graph apartheid project
•Download as DOC, PDF•
1 like•340 views


Recommended
More Related Content
More from North Carolina Association for Middle Level Education
More from North Carolina Association for Middle Level Education (20)
Circle graph apartheid project
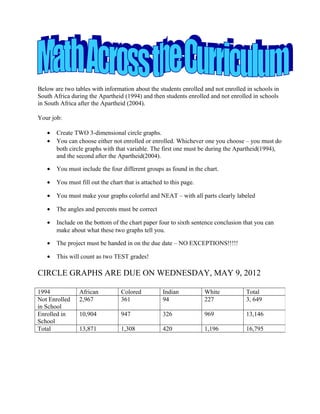
- 1. Below are two tables with information about the students enrolled and not enrolled in schools in South Africa during the Apartheid (1994) and then students enrolled and not enrolled in schools in South Africa after the Apartheid (2004). Your job: • Create TWO 3-dimensional circle graphs. • You can choose either not enrolled or enrolled. Whichever one you choose – you must do both circle graphs with that variable. The first one must be during the Apartheid(1994), and the second after the Apartheid(2004). • You must include the four different groups as found in the chart. • You must fill out the chart that is attached to this page. • You must make your graphs colorful and NEAT – with all parts clearly labeled • The angles and percents must be correct • Include on the bottom of the chart paper four to sixth sentence conclusion that you can make about what these two graphs tell you. • The project must be handed in on the due date – NO EXCEPTIONS!!!!! • This will count as two TEST grades! CIRCLE GRAPHS ARE DUE ON WEDNESDAY, MAY 9, 2012 1994 African Colored Indian White Total Not Enrolled 2,967 361 94 227 3, 649 in School Enrolled in 10,904 947 326 969 13,146 School Total 13,871 1,308 420 1,196 16,795
- 2. 2004 African Colored Indian White Total Not Enrolled 4,376 891 40 120 5,427 in School Enrolled in 24,456 2,820 391 1,396 29,063 School Total 28,832 3,711 431 1,516 34,490 The information in these tables was taken directly from the internet – with the given labels. Name:____________________________________________ I have chosen the students ___________________ in school. 1994 Number Fraction Decimal Percent Degrees of the Circle Data Graph African Colored Indian White 2004 Number Fraction Decimal Percent Degrees of the Circle Data Graph African Colored Indian White