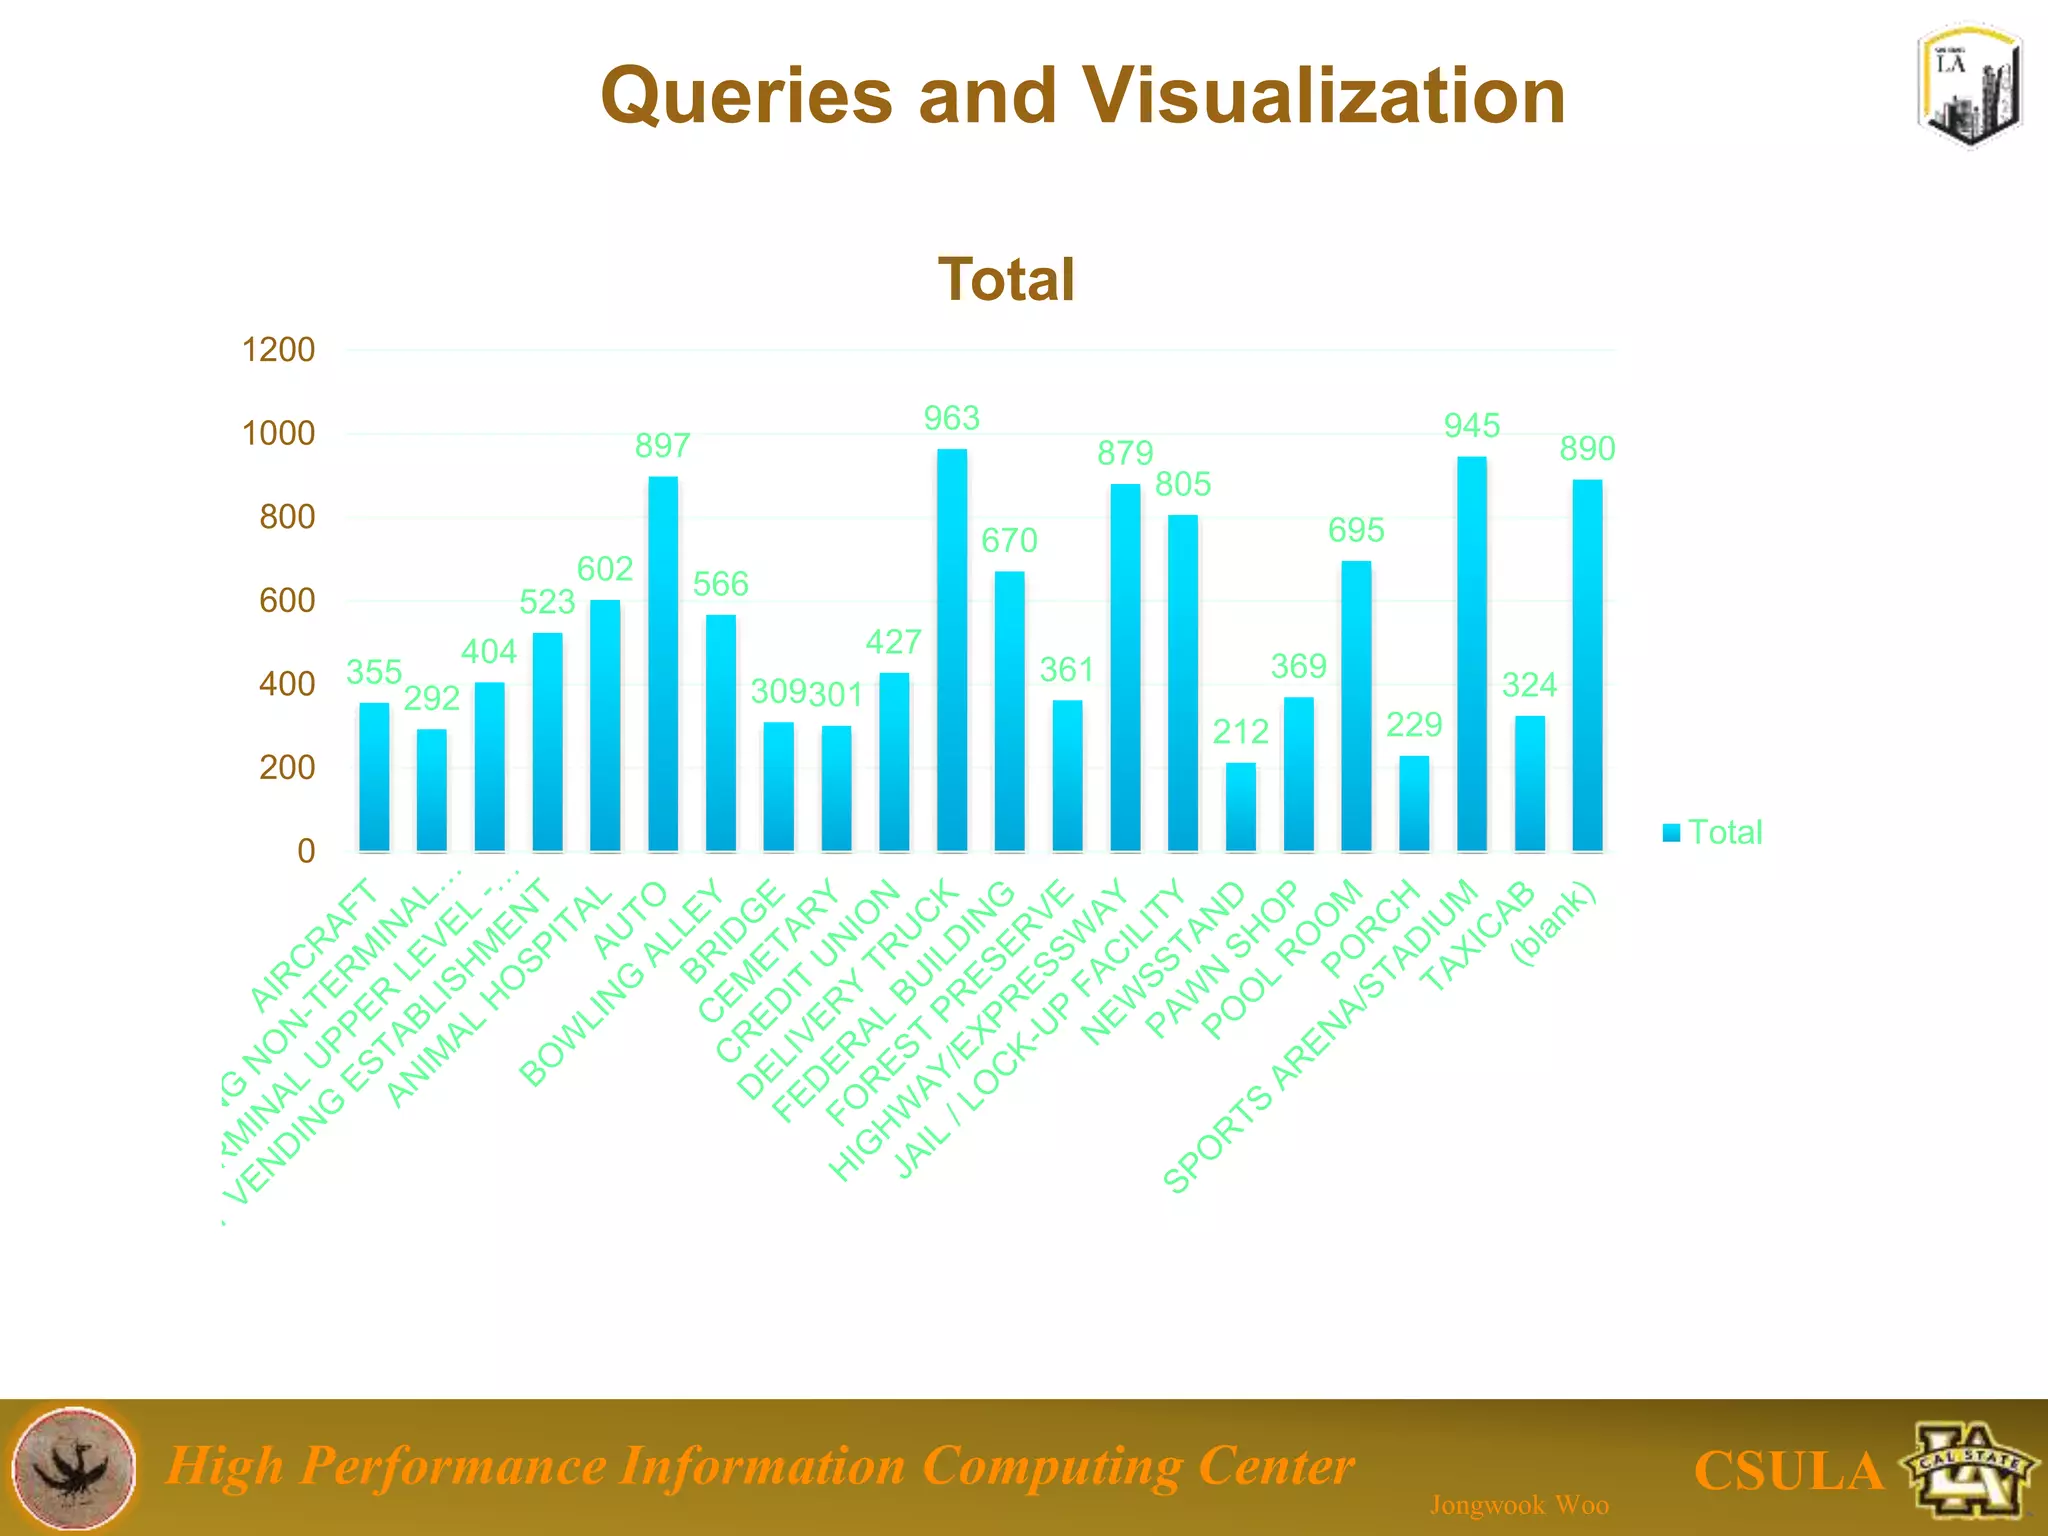
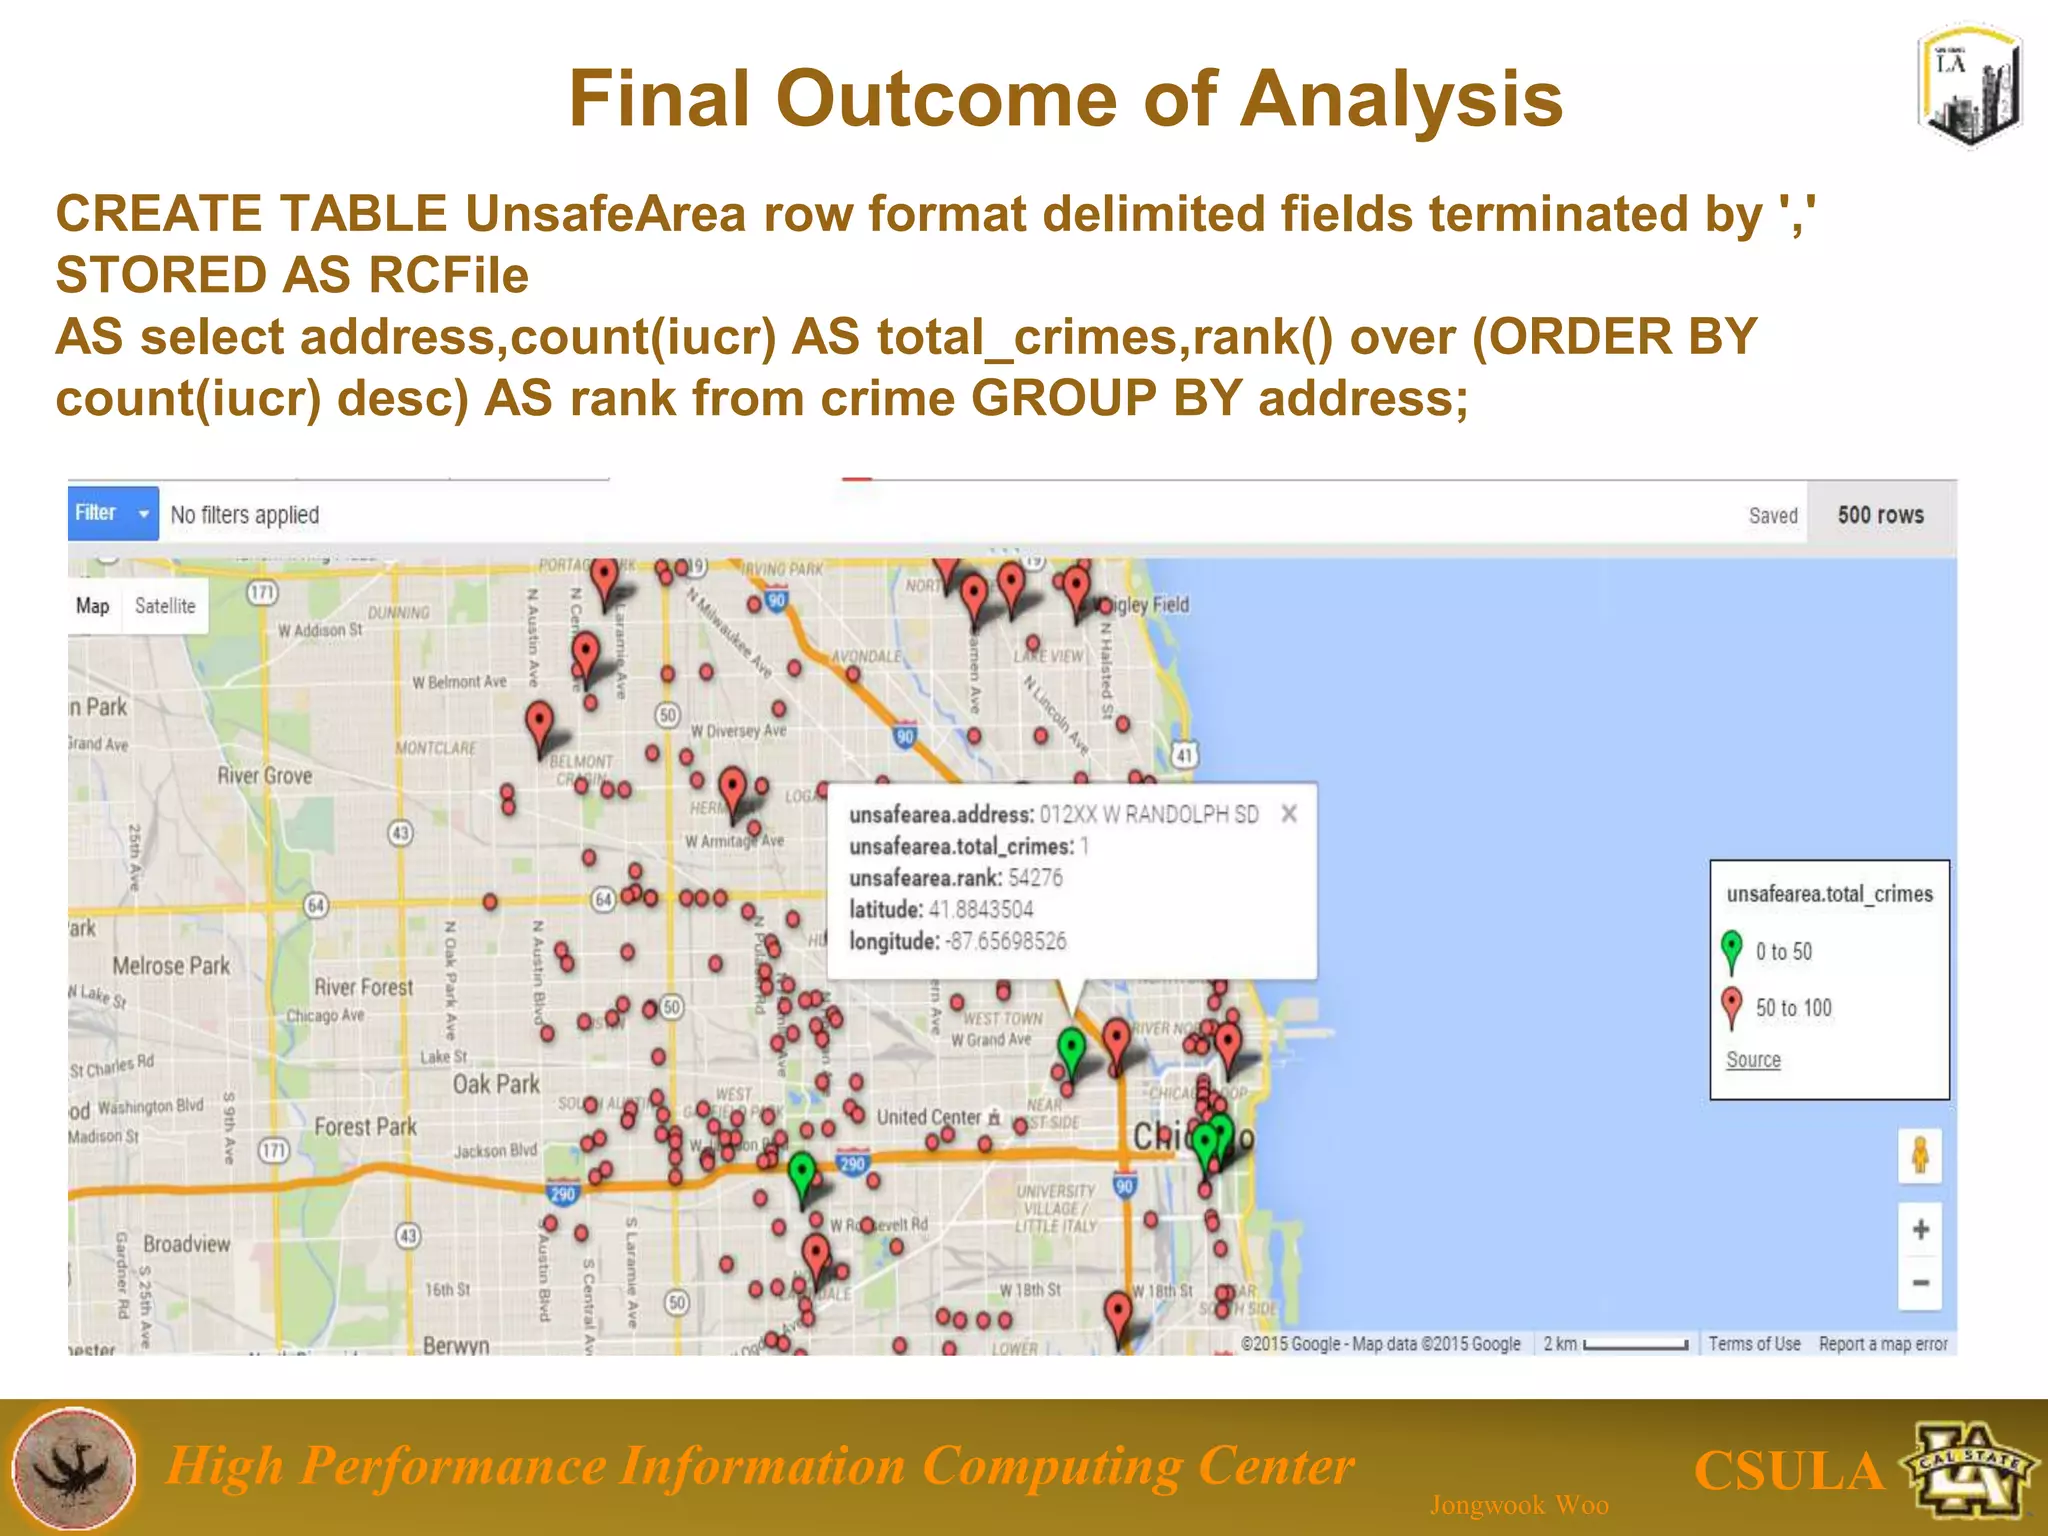
VIP Call Girls Service Charbagh { Lucknow Call Girls Service 9548273370 } Boo...
Geolocation Analyzer Finds Safe Chicago Neighborhoods
1. Jongwook Woo
HiPIC
CSULA
CheckMate: Geolocation
Analyzer for Safe Residence
College of Business & Economics
Faculty Research Colloquium
Priyanka Kale, Priyal Mistry, Hitesh Jagtap, Jongwook Woo
California State University Los Angeles
December 1st , 2016
High-Performance Information Computing Center (HiPIC)
California State University Los Angeles
2. High Performance Information Computing Center
Jongwook Woo
CSULA
Table of Contents
Introduction to Big Data
Implementation
Visualization
Conclusion
References
3. High Performance Information Computing Center
Jongwook Woo
CSULA
Data Issues
Large-Scale data
Tera-Byte (1012), Peta-byte (1015)
– Because of web
– Sensor Data (IoT), Bioinformatics, Social Computing,
Streaming data, smart phone, online game…
Cannot handle with the legacy approach
Too big
Non-/Semi-structured data
Too expensive
Need new systems
Non-expensive
5. High Performance Information Computing Center
Jongwook Woo
CSULA
Two Cores in Big Data
How to store Big Data
How to compute Big Data
Google
How to store Big Data
– GFS
– Distributed Systems on non-expensive commodity
computers
How to compute Big Data
– Map-Reduce
– Parallel Computing with non-expensive computers
Data Intensive Super Computers
Published papers in 2003, 2004
6. High Performance Information Computing Center
Jongwook Woo
CSULA
Definition: Big Data
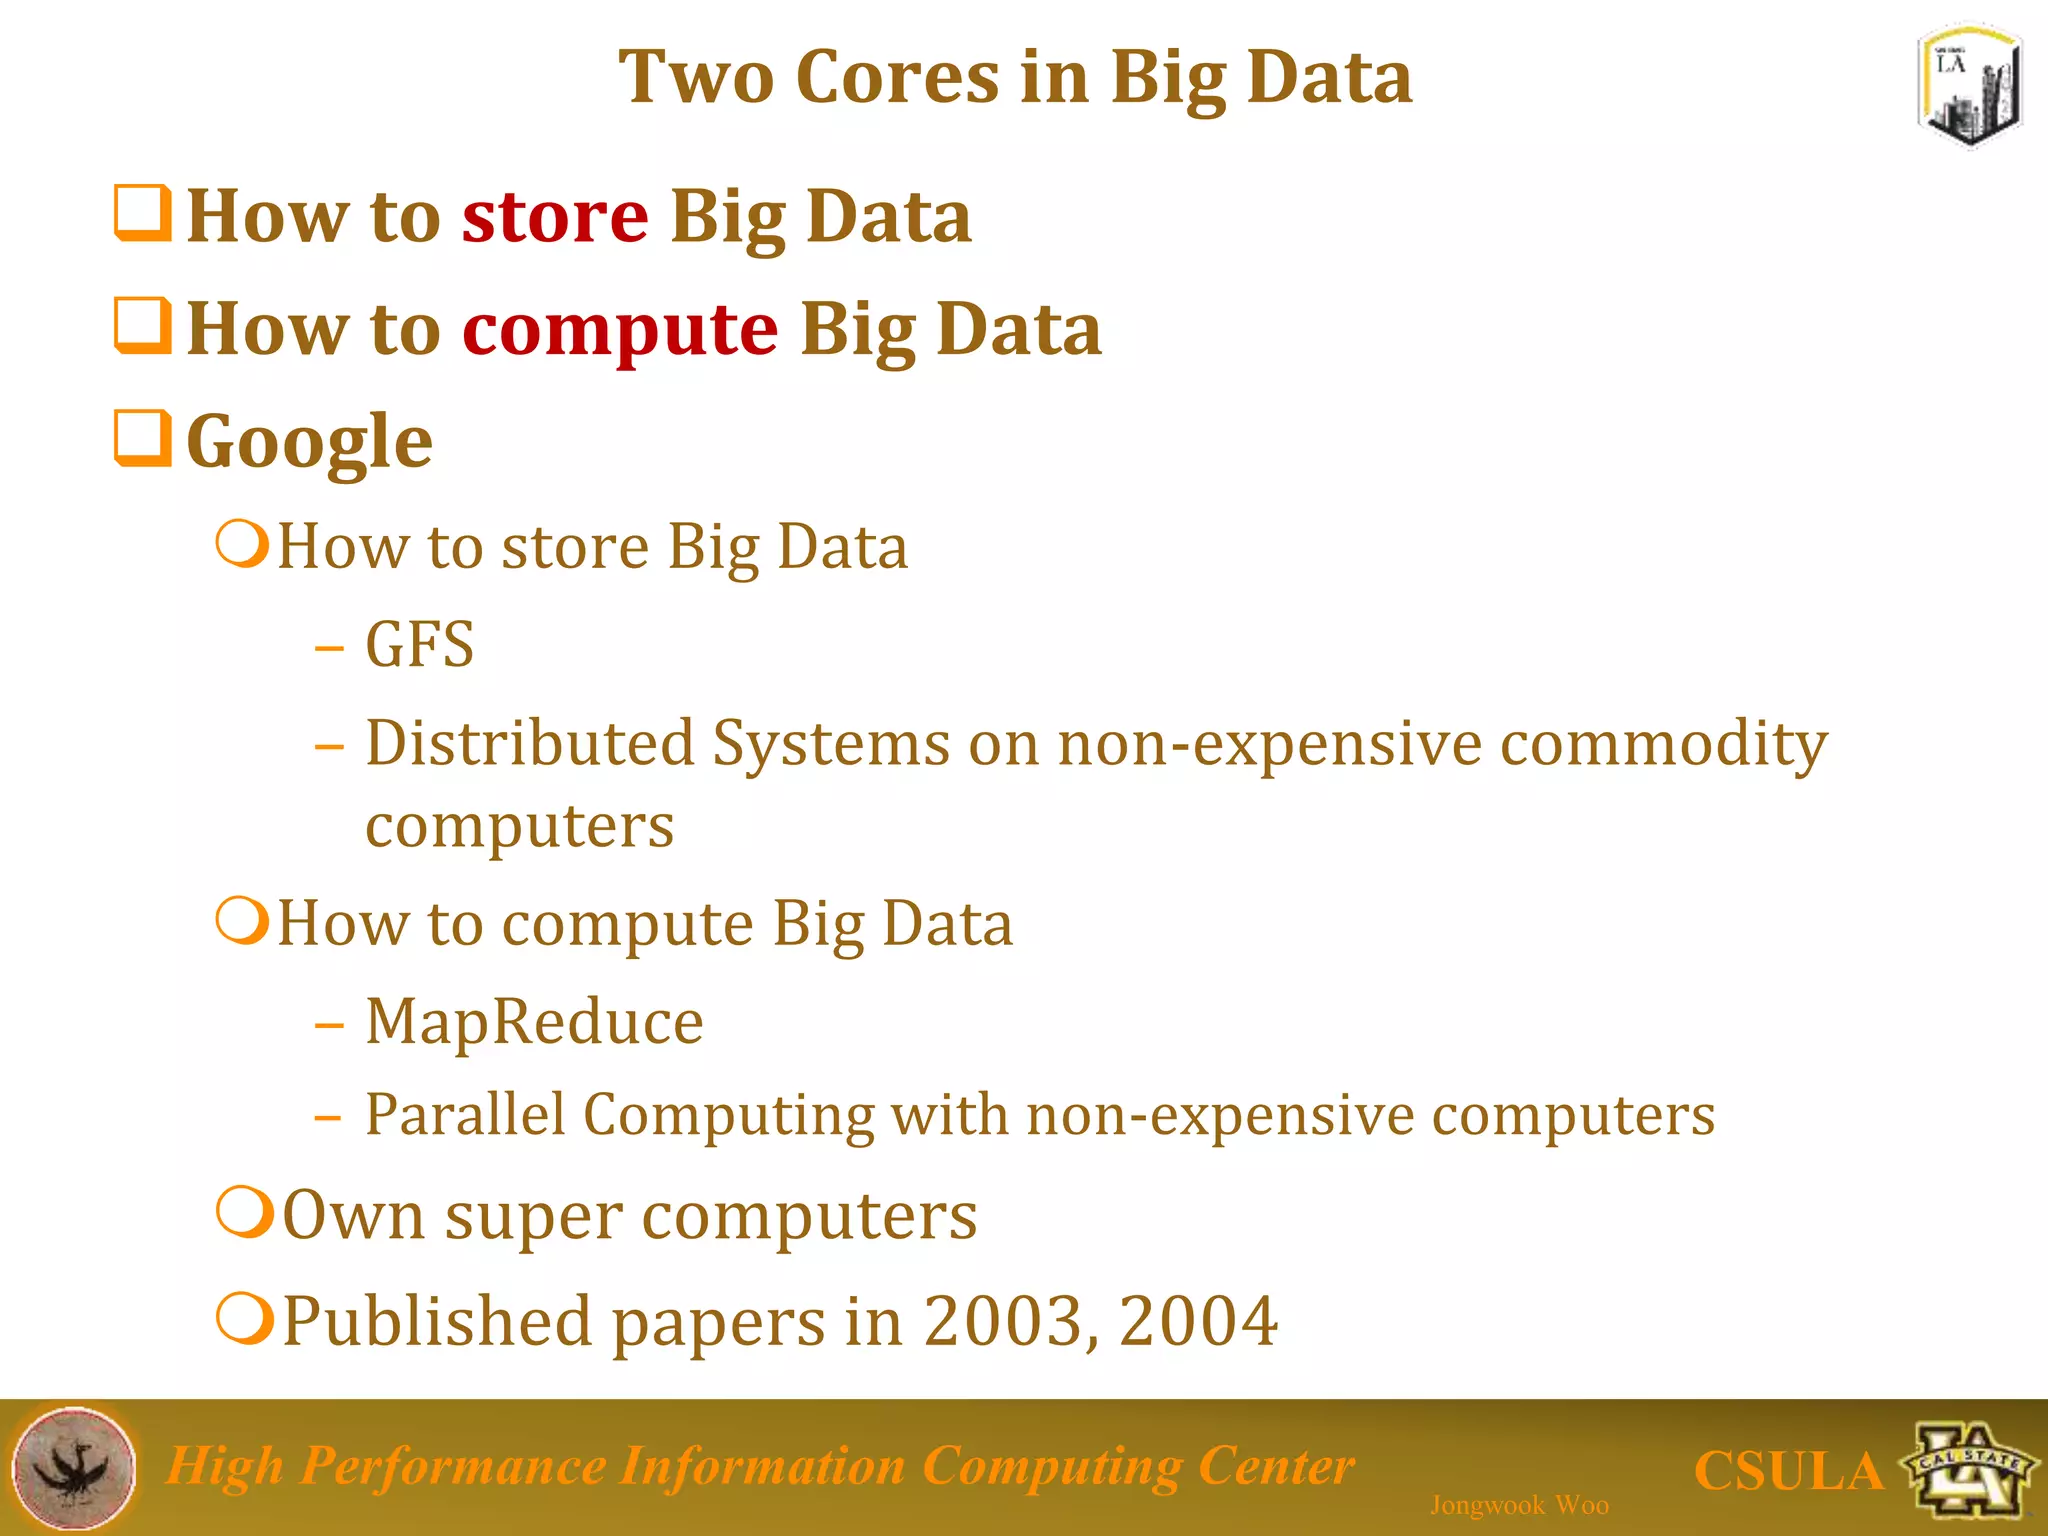
Non-expensive frameworks that can
store a large scale data and process it
faster in parallel [5, 6]
Hadoop
– Non-expensive Super Computer
– More public than the traditional super computers
• You can store and process your applications
– In your university labs, small companies, research
centers
NoSQL DB
– Cassandra, Hbase, Couchbase, MongoDB
7. High Performance Information Computing Center
Jongwook Woo
CSULA
Table of Contents
Introduction to Big Data
Implementation
Visualization
Conclusion
References
8. High Performance Information Computing Center
Jongwook Woo
CSULA
Motivation
Issues
Person looking for place of residence may find it
difficult to get real details about the place from safety
point of view.
Person can be confused to select location for residence.
Solutions
Analyzing open data to find the location for safety
perspective.
Our Approach
System Design with the flow chart
Big Data
– Hadoop Hive using MS Azure Cloud Computing
9. High Performance Information Computing Center
Jongwook Woo
CSULA
Flowchart
Download Public
Dataset
Upload data into Big Data HDFS
Trigger Hadoop Hive Queries
Result Data Tables
Output Visualization
10. High Performance Information Computing Center
Jongwook Woo
CSULA
Specifications in Big Data cluster
10
Cloud Computing: Microsoft Azure with Hortonworks sandbox
1. Linux OS system
2. Number of nodes: 4
3. CPU: 8 cores
4. Memory Size: 14 GB
11. High Performance Information Computing Center
Jongwook Woo
CSULA
Implementation : Hadoop Hive
Hortonworks HDP
Hadoop Big Data Platform
Ambari: a web GUI in Hadoop
Explore HDFS file systems
Process data with Hive and Tez queries as MapReduce jobs
12. High Performance Information Computing Center
Jongwook Woo
CSULA
Table of Contents
Introduction to Big Data
Implementation
Visualization
Conclusion
References
13. High Performance Information Computing Center
Jongwook Woo
CSULA
Analysis Result
Detailed analysis made it easy to understand
which part of Chicago City is having safe
place of residence and which areas are
unsafe.
This analysis can play vital role in any house
finding website if added as module, it can
help people know more about the crime
history of the place.
Subsequent slides shows us some of the
important outcomes of the analysis.
14. High Performance Information Computing Center
Jongwook Woo
CSULA
Queries and Visualization
Rank of Crime type as per occurrences
17. High Performance Information Computing Center
Jongwook Woo
CSULA
Final Outcome of Analysis
Using similar approach
we find out which area of Chicago city is safer than
the other.
Geo Spatial Analysis
Outcome file is plotted against the map of Chicago
city
Visualized using green and red mark points.
– Green indicated safe areas
– Red indicates unsafe areas
Top 50 results are highlighted.
19. High Performance Information Computing Center
Jongwook Woo
CSULA
Table of Contents
Introduction to Big Data
Implementation
Visualization
Conclusion
References
20. High Performance Information Computing Center
Jongwook Woo
CSULA
Conclusion
An exhaustive analysis of geolocation data
for Chicago City is done
a user searching a place for residence can
easily select better neighborhood depending
on its crime history
Future work
Further Analysis of individual area can be done based
on other factors affecting the residence
Integrate this analysis with the rental or lease
companies
Analyze more data at different locations
21. High Performance Information Computing Center
Jongwook Woo
CSULA
Table of Contents
Introduction to Big Data
Implementation
Visualization
Conclusion
References
22. High Performance Information Computing Center
Jongwook Woo
CSULA
1. https://catalog.data.gov
2. https://cwiki.apache.org/confluence/display/Hive/Tutorial
3. https://hortonworks.com/tutorials
4. GitHub Link: https://github.com/priya708/Project-520
5. “Market Basket Analysis Algorithm with Map/Reduce of Cloud
Computing”, Jongwook Woo and Yuhang Xu, The 2011 international
Conference on Parallel and Distributed Processing Techniques and
Applications (PDPTA 2011), Las Vegas (July 18-21, 2011)
6. Jongwook Woo, DMKD-00150, “Market Basket Analysis Algorithms with
MapReduce”, Wiley Interdisciplinary Reviews Data Mining and
Knowledge Discovery, Oct 28 2013, Volume 3, Issue 6, pp445-452
7. Jongwook Woo, “Big Data Trend and Open Data”, UKC 2016, Dallas, TX
Aug 12 2016
References