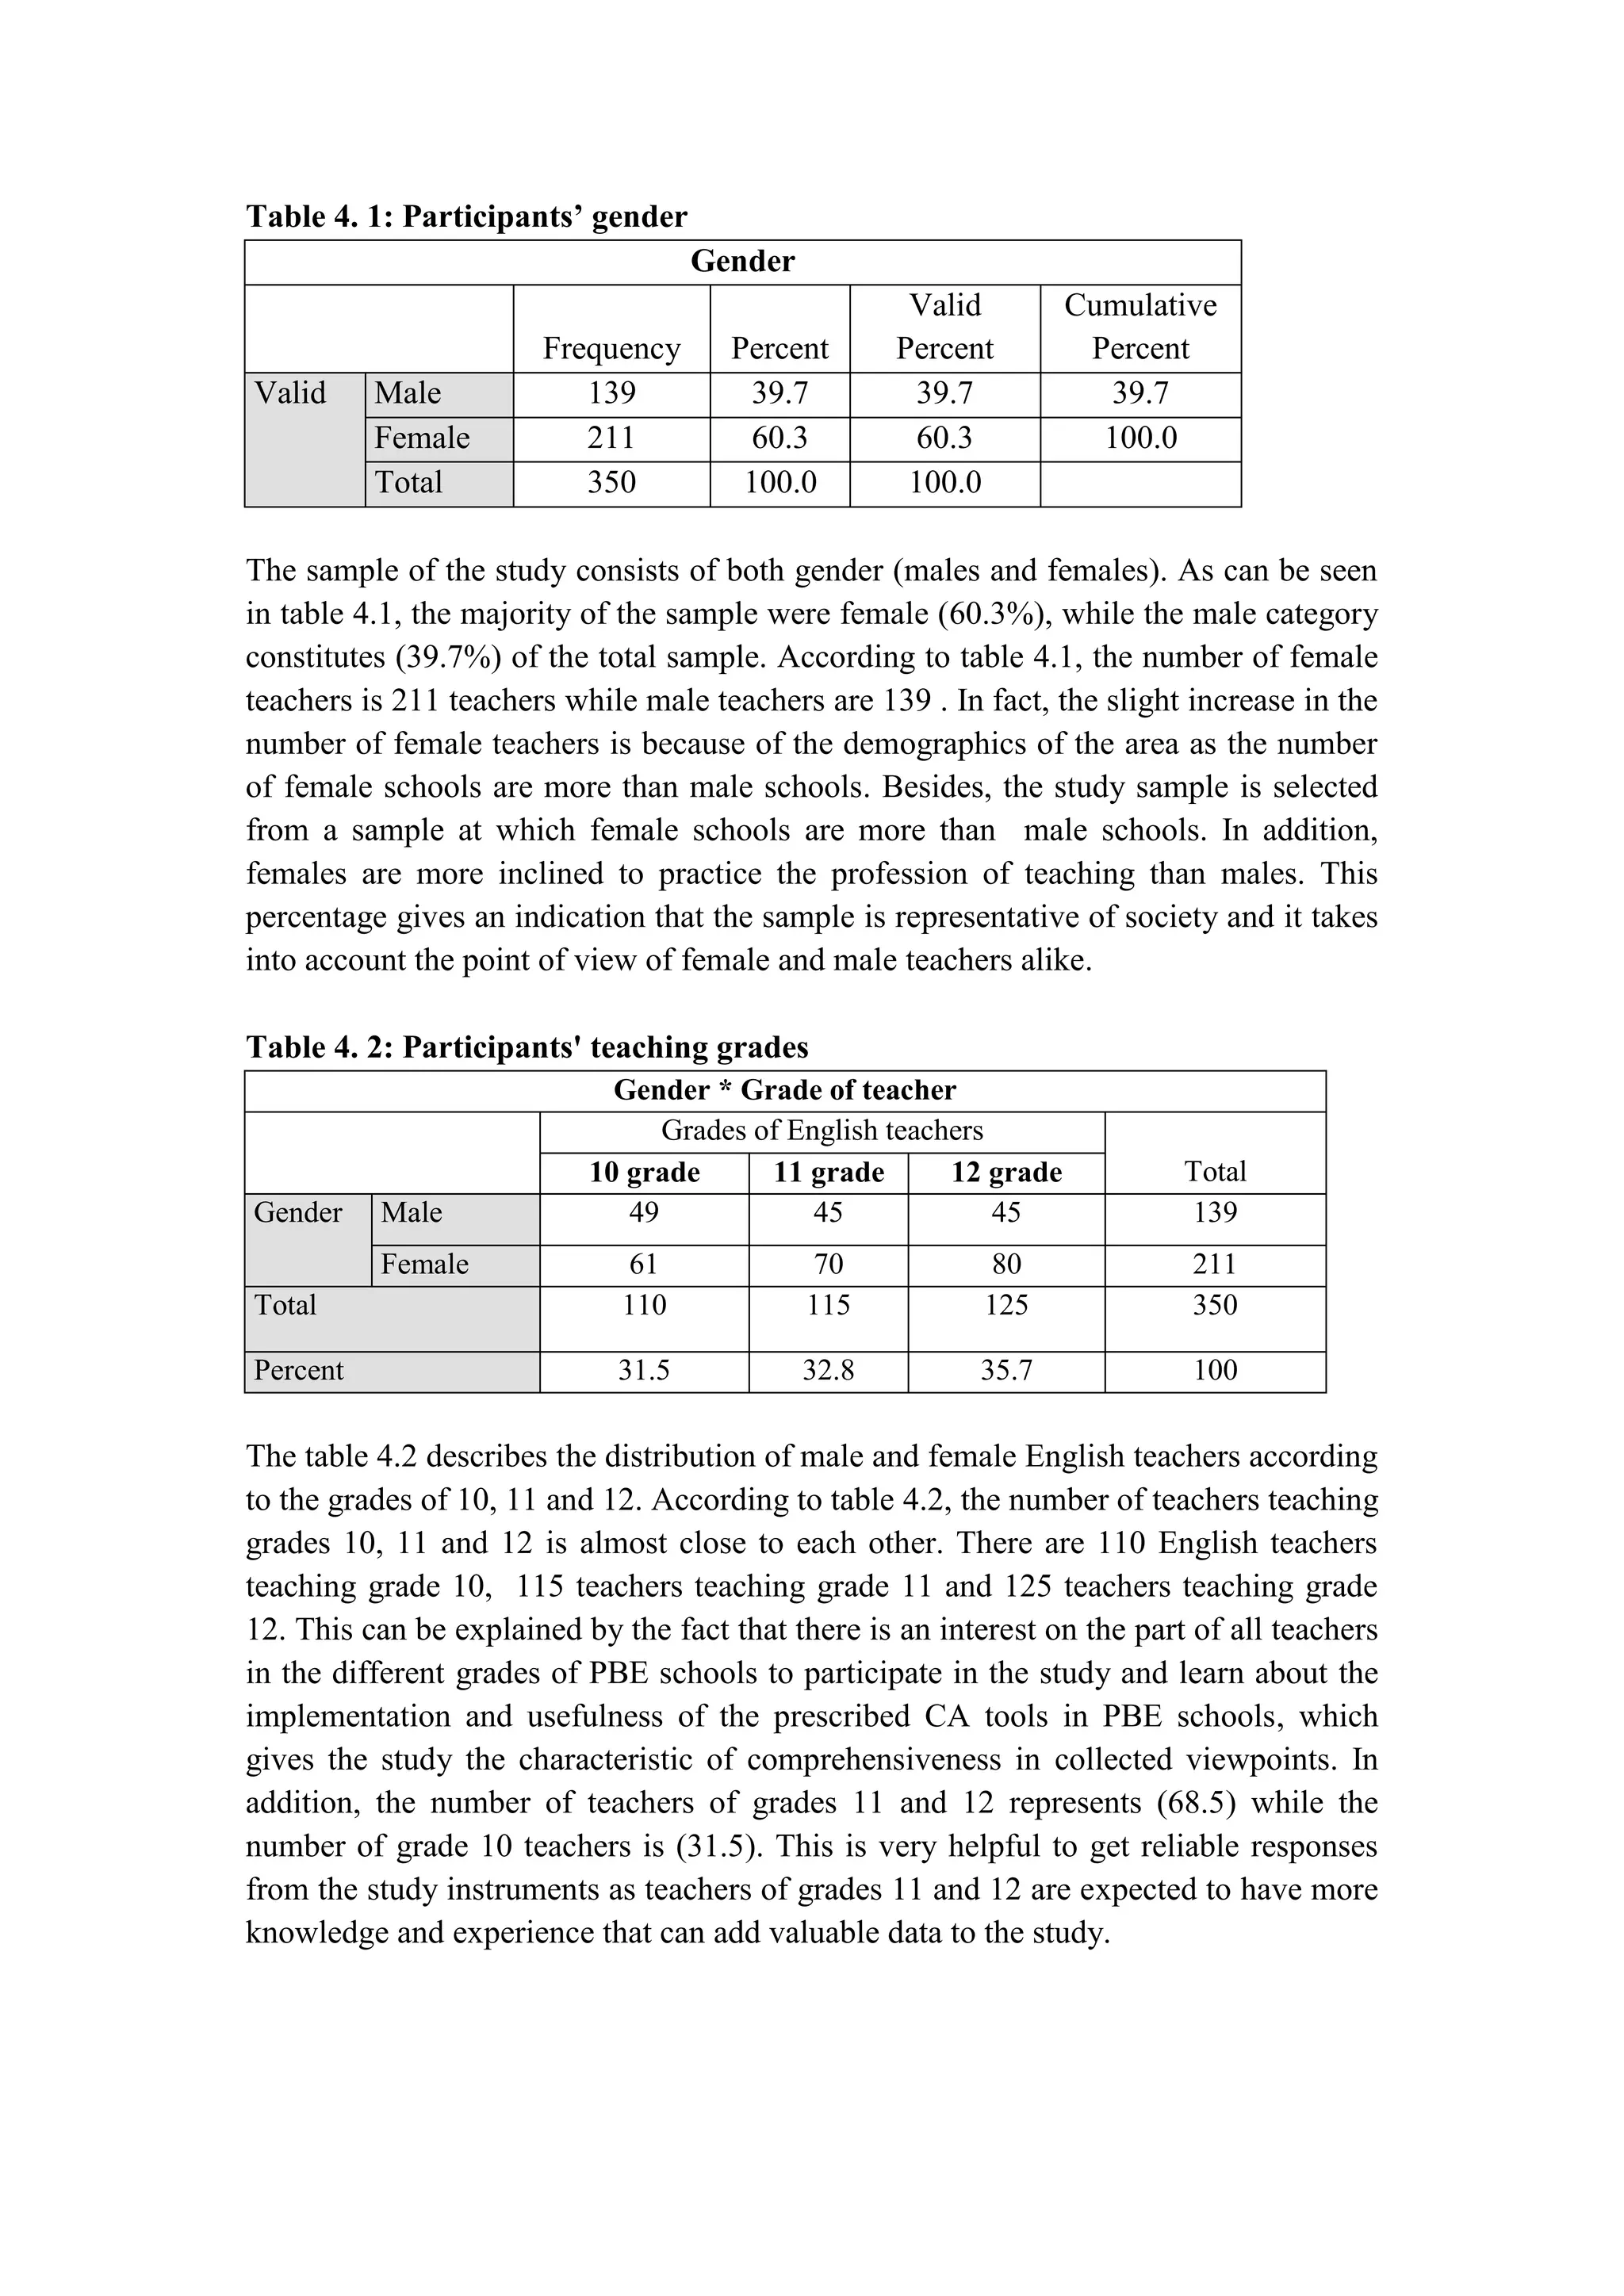
SlideShare a Scribd company logo
CHAPTER FOUR: DATA ANALYSIS AND RESULTS
4.1 Introduction
4.2 Demographic Characteristics of study participants
4.2.1 Demographic characteristics of quantitative sample
4.2.2 Demographic characteristics of qualitative sample
4.3. Quantitative Data Analysis from Questionnaire
4.3.1. Quantitative Data Analysis of Theme 1. Implementation of CA tools
4.3.1.1.Results Regarding First Research Question: Teachers' perceptions
4.3.1.2. Results Regarding Second Research Question: Challenges of
implementing CA tools
4.3.1.3. Results Regarding Third Research Question: Teachers' practice of CA
tools
4.3.1.4. Results Regarding Forth Research Question: Factors of adopting CA
tools (acceptance /rejection factors)
4.3.2 Qualitative Data Analysis of Theme 2. Usefulness of CA tools
4.3.2.1. Results Regarding Fifth Research Question: Teachers' perceptions
4.3.2.2. Results Regarding Sixth Research Question: Frequently used CA tools
4.3.2.3. Results s Regarding Seventh Research Question: Usefulness of CA
tools
4.4. Qualitative Data Analysis form Open-ended Questions and Observations
4.4.1.Qualitative Data Analysis of Theme 1. Implementation of CA tools
4.4.1.1. Findings Regarding First Research Question: Teachers' perceptions
4.4.1.2. Findings Regarding Second Research Question: Challenges of
implementing CA tools
4.4.1.3. Findings Regarding Third Research Question: Teachers' practice of
CA tools
4.4.1.4. Findings Regarding Forth Research Question: Factors of adopting CA
tools (acceptance /rejection factors)
4.4.2.Qualitative Data Analysis of Theme 2. Usefulness of CA tools
4.4.2.1. Findings Regarding Fifth Research Question: Teachers' perceptions
4.4.2.2. Findings Regarding Sixth Research Question: Frequently used CA
tools
4.4.2.3. Findings Regarding Seventh Research Question: Usefulness of CA
tools
CHAPTER FOUR DATA ANALYISS OF FINDINGS AND RESULTS
4.1 Introduction
In the previous chapter, the researcher discussed and explained the mixed approach
used in this study to collect and analyze data. Accordingly, the current chapter
presents the analysis of the quantitative data collected from the questionnaire applied
to a sample of 350 English teachers in Post Basic Education (PBE) schools. In this
chapter, the researcher also analyzed the qualitative data collected from the same 350
participants after responding to 8 open-ended questions and conducting 21 classroom
observations. This analysis can lead to extract the required statistical and generate
comprehensive and influential conclusions regarding English teachers' perception
towards the implementation and usefulness of the prescribed CA tools in PBE schools
in Batinah North Governorate in Oman.
The chapter begins by describing the socio-demographic characteristics of the sample
which responded to the questionnaire and discussing the results and findings
regarding teachers' perception towards the implementation and usefulness of the
prescribed CA tools, the challenges that teachers encounter in implementing the
prescribed CA tools, the factors influencing English teachers' adoption
(acceptance/rejection) of the prescribed CA tools and the major CA tools that teachers
use more frequently to assess students’ learning in their classrooms.
4.2 Demographic characteristics of the study participants
After the questionnaires were distributed and filled out by the 350 English teachers in
Post Basic Education schools, a descriptive statistical analysis was performed by
SPSS to determine the social and demographic characteristics of the sample members.
The analysis of the demographic characteristics of the sample is important, because it
helps in knowing the characteristics of the sample community and the nature of the
characteristics of the people participating in the completion of the questionnaire, the
extent of their experience and their connection with the subject, as well as identifying
the personal differences between them and whether they affect the nature of the
answers submitted by them or not (Dobronte, 2013).
In this section, the researcher describes the socio-demographic characteristics of the
quantitative and qualitative study participants.
4.2.1 Demographic characteristics of quantitative sample
Having collected data from the instrument of the questionnaire, the researcher begins
the analysis by categorizing the participants of the study and are presented in
organized tables.
Table 4. 1: Participants’ gender
Gender
Frequency Percent
Valid
Percent
Cumulative
Percent
Valid Male 139 39.7 39.7 39.7
Female 211 60.3 60.3 100.0
Total 350 100.0 100.0
The sample of the study consists of both gender (males and females). As can be seen
in table 4.1, the majority of the sample were female (60.3%), while the male category
constitutes (39.7%) of the total sample. According to table 4.1, the number of female
teachers is 211 teachers while male teachers are 139 . In fact, the slight increase in the
number of female teachers is because of the demographics of the area as the number
of female schools are more than male schools. Besides, the study sample is selected
from a sample at which female schools are more than male schools. In addition,
females are more inclined to practice the profession of teaching than males. This
percentage gives an indication that the sample is representative of society and it takes
into account the point of view of female and male teachers alike.
Table 4. 2: Participants' teaching grades
Gender * Grade of teacher
Grades of English teachers
Total
10 grade 11 grade 12 grade
Gender Male 49 45 45 139
Female 61 70 80 211
Total 110 115 125 350
Percent 31.5 32.8 35.7 100
The table 4.2 describes the distribution of male and female English teachers according
to the grades of 10, 11 and 12. According to table 4.2, the number of teachers teaching
grades 10, 11 and 12 is almost close to each other. There are 110 English teachers
teaching grade 10, 115 teachers teaching grade 11 and 125 teachers teaching grade
12. This can be explained by the fact that there is an interest on the part of all teachers
in the different grades of PBE schools to participate in the study and learn about the
implementation and usefulness of the prescribed CA tools in PBE schools, which
gives the study the characteristic of comprehensiveness in collected viewpoints. In
addition, the number of teachers of grades 11 and 12 represents (68.5) while the
number of grade 10 teachers is (31.5). This is very helpful to get reliable responses
from the study instruments as teachers of grades 11 and 12 are expected to have more
knowledge and experience that can add valuable data to the study.
Table 4.3: Participants’ job positions
Gender * Job position
Job position
Total
Teacher Senior Teacher
Gender Male 111 28 139
Female 180 31 211
Total 291 59 350
Percent 83.1 16.9 100
In addition, with regard to job position, table 4.3 shows that the individuals
participating in this questionnaire are distributed among two job titles, the largest
percentage of them are teachers, who constituted (83.1%) of the sample, followed by
English senior teachers with a percentage of (16.9%). As a number of 67 PBE schools
have selected to choose the study sample from, it is expected that the number of
English senior teachers will be less than the teachers. To illustrate, as seen in table
4.3, there are 59 senior teachers because not all schools have senior teachers. The
schools that are in the mountainous areas where there are less than 3 teachers, they
don't have a senior teacher. Consequently, out of the 67 schools of the study sample ,
8 schools don't have senior teachers. The table also reveals that the number of male
senior teachers is 28 and there are 31 female senior teachers. It is helpful to gather
accurate data about teachers' perception towards the implementation and usefulness
of CA tools especially when male and female senior teachers are involved in the
study. In fact, this diversity in the participating job positions gives the results of the
study a characteristic of quality and credibility.
Table 4.4: Participants’ years of experience
Years of experience
Frequency Percent Valid Percent Cumulative Percent
Valid 1-5 years 143 40.9 40.9 40.9
5-10 years 99 28.2 28.2 69.1
10 years or
more
108 30.9 30.9 100.0
Total 350 100.0 100.0
Moreover, regarding years of experience, table 4.4 shows that the majority of
participated teachers who have 1-5 years of experience represented (40.9%), followed
by (28.2%) of teachers who have 5-10 years of experience, then (30.9%) for teachers
with experience of 10 years or more. It is also clear from the table that the sample of
the study includes vast majority of experienced teachers. The percentage representing
the two groups of 5-10 and more than 10 years of experience is about (69.1%)
compared to the percentage of less experienced teachers who are 1-5 years of
experience. This indicates that the study sample consists of English teachers with
valuable and long experiences, which can give the impression that teachers possess
extensive knowledge in the field of study and that their answers will be representative
and trustworthy.
Table 4.5: Participants' gender years of experience
Gender *years of experience
years of experience
Total
1-5 years 5-10 years 10 years or more
Gender Male 54 45 40 139
Female 89 54 68 211
Total 143 99 108 350
Percent 40.9 28.2 30.9 100
Finally, according to table 4.5, although there is a big difference in the number of
males and females of the study sample, there isn't a big difference in the years of
experience among the three groups. To illustrate, the group of 1-5 years of experience
represents (40.9%), group of 5-10 years of experience represents (28.2%) and the
group of 10 years of experience and more represents (30.9%). This close percentages
of teachers can provide worthy data and accurate responses from the data instruments.
4.2.2 Demographic characteristics of qualitative sample
The qualitative data is collected based on two instruments; the open-ended questions
which is part 4 of the questionnaire and the structured classroom observation
instrument. The participants of the open-ended questions are 350 English teachers
who are the same sample that responded to the close-ended questions of the
questionnaire. The description of the 350 participants is summarized in table 4.15
below.
Table 4. 6: Participants of the questionnaire tool (open-ended questions)
English teachers
Grades
Total
Grade 10 Grade 11 Grade 12
Gender
Male 49 45 45 139
Female 61 70 80 211
Total 110 115 125 350
% 31.5 32.8 35.7 100
Table 4. 6 shows the participants of the study who responded to the whole
questionnaire including both close-ended and the open-ended questions. According to
the table, there are 350 English teachers who answered the seven open-ended
questions. There are 139 male and 211 female teachers. All are teaching grades 10, 11
and 12 in post basic education schools. However, the table indicates that there are 110
English teachers of grade 10, 115 teachers of grade 11 and 125 teachers of grade 12. It
can be noticed that the number of teachers involved in the study has fair selection
from the three different grades and this can be very beneficial to provide different and
valuable point of views with regards to the research questions.
According to the table, there are 240 teachers of grades 11 and 12. This is valuable to
the study as this number of participants are selected on purpose to teach grades 11 and
12. These teachers have long teaching experience and more knowledge and skills so
they can enrich the data collected about the study problem.
As for the participants of the classroom observation, the researcher visited a total of
21 English teachers in grades 10, 11 and 12 as explained in Table 4. 16 below.
Table 4. 7: Participants of the classroom observation tool
Grade 10 Grade 11 Grade 12
Total
Male Female Male Female Male Female
Teacher 2 3 2 3 2 3 15
Sen. T 1 1 1 1 1 1 6
Total 3 4 3 4 3 4 21
7 7 7
According to table 4.7, the researcher visited 21 English teachers. He conducted
seven observations for each level grade of grades 10, 11 and 12. The table shows that
not only teachers were visited but the English senior teachers were visited to
investigate their practices of the CA tools in their classrooms. So, 15 teachers and 6
senior teachers were visited and data collected from their lessons using the structured
observation form. Conducting observations, especially, for senior teachers'
classrooms can reflect valuable data and add validity to the findings of the study
because they have longer teaching experiences and a variety of knowledge and skills
that can provide realistic data.
Data analysis has a huge role to play in any research. It is a significant method which
a researcher uses to study and analyze huge amounts of data. Therefore, the researcher
analyzes the data collected in various techniques and formats. In fact, the significance
of data analysis lies in cleaning and transforming all the data into a consistent form in
order to study the data effectively. When analyzing the data, the researcher has the
chance to clean the data and only analyze the accurate and useful information. Data
analysis can also help the researcher to make the appropriate decision about the study
problem and this can be based on facts and not on anticipations. The researcher, in
this study, puts such considerations in his mind and conducted in-depth analysis of
data collected as this stage can lead to discoveries, understanding and improve
decision making process.
The next sections demonstrate the quantitative results and the qualitative findings of
all research questions. It begins by presenting the quantitative results of the four
questions regarding the first theme which is implementation of the prescribed CA
tools. It discusses English teachers' perceptions towards the CA tools, the challenges
of implementation, teachers' practices of the tools and the factors influencing teachers'
adoption of the prescribed CA tools. Then, it also presents the quantitative results of
the remaining three questions regarding the second theme which is the usefulness of
the CA tools. It presents results about teachers' perceptions towards the usefulness of
the CA tools, the tools used more frequently by teachers and the tools teachers find
easy and useful for learners' assessment.
4.3 Quantitative Data Analysis from the questionnaire
In order to quantitatively identify the perception of English teachers towards the
implementation and usefulness of the prescribed CA tools, the analysis of the
questionnaire questions was divided into two main themes; tools implementation and
tools usefulness. In the binging, the statements of the questionnaire were categorized
according to the major research questions. For instance, items related to the first
questions were identified and listed in a separate table. Similarly, statements of all
questions were collected and organized in tables. The software SPSS was utilized to
administer the descriptive analysis of frequencies. Frequencies of all close-ended
statements were calculated and percentages were also added to the tables.
In every quantitative descriptive analysis, there must be a measure of central tendency
and a measure of variance to describe results appropriately. Accordingly, the
researcher used the arithmetic mean to measure the central tendency of the
respondents’ answers and describe the degree of their agreement on the statements,
and the standard deviation was used for being the most widely used measure of
variance to determine the average variance in a set of data and to provide insight into
the difference between a value in a data set and the mean value of the same data set.
The variance reflects the degree of prevalence and the extent to which the
respondents’ opinions differ from their arithmetic mean. A low standard deviation
indicates that the data are clustered around the mean, and a high standard deviation
indicates a greater spread of the data. Therefore, in our study, the researcher found
that the standard deviation values are low, which indicates that the opinions and
perceptions of the respondents were in agreement, and there was no significant
difference or variation in their perceptions towards CA.
The descriptive statistics (means and standard deviations) of the responses and their
ranks, which were elicited using a six-point Likert scale were calculated via SPSS,
table 4.8 below shows the evaluation criteria for measuring attitudes level based on
the mean.
Table 4.8: Evaluation criteria for measuring attitudes' level
Evaluation criteria used for measuring attitudes' levels
Likert Scale Means Decision
Strongly disagree 1.00 - 1.83 Very low
Disagree 1.84 - 267 Low
Slightly disagree 2.68 - 3.51 Slightly Low
slightly agree 3.52 - 4.35 Slightly High
Agree 4.36 - 5.19 High
Strongly agree 5.20 - 6.00 Very high
The previous table 4.8 depicts the evaluation criteria that were used to determine the
level of agreement for each statement and question. The questionnaire responses were
ranged using six Likert scale (strongly disagree = 1, disagree = 2, Slightly disagree =
3, Slightly agree = 4, Agree = 5 and Strongly agree = 6) evaluation criteria for judging
the level of respondents' scores (respondents' attitudes levels).
1. Results of Theme 1. Implementation of CA tools
1.1 Results regarding first research question:
Question1. What are the perceptions of English teachers toward the implementation of
the prescribed CA tools in PBE schools in Batinah North Governorate?
Table 4. 9: English teachers' perceptions toward the implementation of the
prescribed CA tools in PBE schools
No Statement
N
Strongly
disagree
Disagree
Slightly
disagree
slightly
agree
Agree
Strongly
agree
Mean
Std.
Deviation
Decision
% % % % % %
1 2 3 4 5 6
1
CA tools make
my students work
harder.
350
0 0.9 5.4 20.0 41.1 32.6 4.99 0.91
High
2
Listening skill
should be
assessed as a part
of the CA.
350
0 2.3 10.9 19.7 35.1 32.0 4.84 1.07
High
3
CA tools focus on
quantity of papers
not quality of
students works.
350
1.1 3.7 14.3 22.9 32.6 25.4 4.58 1.18
High
4
I need a variety of
CA tools to assess
me students.
350
0.3 4.0 11.1 27.4 39.7 17.4 4.55 1.05
High
5
CA tools help
students getting
high CA marks
easily.
350
2.0 11.7 26.9 24.3 21.7 13.4 3.92 1.29
Slightly
High
6
I am happy about
the quality of the
CA work.
350 14.
3
40.3 34.3 5.1 3.4 2.6 2.51 1.08
Slightly
Low
7
CA tools support
the types of final
exam questions.
350 23.
4
36.6 29.4 4.9 3.1 2.6 2.35 1.14
Low
All Questions
5.9 14.2 18.9 17.8 25.2 18.0 3.96 1.10
Slightly
High
Table 4.9, delivers series of 7 items with respect to English teachers' perception
toward the implementation of the prescribed CA tools. According to table 4.9,
teachers' perception towards the CA tools is regarded slightly high as it scored a mean
value of (3.96). Generally speaking, teachers have negative perception towards the
implementation of the CA tools. Teachers' negative perception is stressed through
statements 2, 3, 5, 6 and 7. According to statement 2, teachers believe that the CA
tools need to focus on evaluating students on the four major language skills. When
implementing the CA tools, teachers find that there is no CA tool assessing students'
listening skill among the seven CA tools. This item received a mean of (4.84) which
is very high and it indicates that teachers want CA tools to assess the listening skill.
Implementation of CA tools revealed poor quality of CA work because teachers were
not convinced by the process of implementing the CA tools in their schools. Thus,
teachers' perception about the quality of CA tools is expressed in statements 3 and 6.
In item 3, teachers showed a high mean score (4.58) which indicates that CA tools
focus on collecting a big number of quantity of papers rather than taking care of
quality of work when implementing the CA tools in the classrooms.
Item 6 also supported this perception, it showed that teachers are not happy about the
quality of the CA work, so it scored a low mean (2.35) which means teachers are
against this item. Finally, teachers' implementation of the CA tools should be
supportive to the types of the final examinations. However, item 7 shows that after
implementing the CA tools, teachers find these tools do not support the types of final
exam questions. It scored a low mean (2.35) indicating teachers' disagreement to this
statement and, of course, emphasizes the negative perception toward the
implementation of the prescribed CA tools.
However, findings reveal that implementation of CA tools indicate positive teachers'
perception, but it is emphasized through two items only. According to statements 1,
84.5% of teachers found that CA tools make their students work harder and this is
supported by the highest mean value of (4.99). Besides, 93.7% of teachers agreed on
their need for a variety of CA tools to assess their students in statement 4 and this
finding is supported by a high mean score which is (4.55).
1.2 Results regarding second research question:
Question2. What are the challenges that teachers encounter in implementing the
prescribed CA tools?
Table 4. 10: Challenges that teachers encounter in implementing the prescribed
CA tools
No
Statement
No
Strongly
disagree
Disagree
Slightly
disagree
slightly
agree
Agree
Strongly
agree
Mean
Std.
Deviation
Decision
% % % % % %
1 2 3 4 5 6
1
The university
course of evaluation
and assessment
provides me with
the skills/knowledge
of assessment.
350
0.0 0.9 3.4 24.6 44.0 27.1
4.9
3
0.85
4
High
2
I have to modify
tasks/activities of
the textbook to fit in
with the CA tools.
350
0.0 0.3 4.3 28.0 42.9 24.6
4.8
7
0.84
2
High
3
I feel burdened by
the amount of CA
tools
350
0.3 5.1 5.1 19.7 44.0 25.7
4.7
9
1.06
2
High
4
A training
workshop is given
for me about the
350 1.1 1.4 9.1 22.6 42.9 22.9
4.7
3
1.03
1
High
implementation of
CA tools.
5
I have enough
knowledge and
skills for
implementing the
CA tools.
350
0.0 2.3 9.1 35.1 27.7 25.7
4.6
5
1.03
1
High
6
Students’ writings
can be finished with
students in the
classroom.
350
0.3 1.1 17.4 32.6 32.6 16.0
4.4
4
1.01
0
High
7
I have sufficient
time to develop the
CA tools I use to
assess my students.
350
0.3 5.7 11.1 36.6 26.9 19.4
4.4
2
1.11
2
High
8
Training given to
teachers help
teachers acquire the
required
CA skills.
350
0.0 10.9 18.6 31.1 32.6 6.9
4.0
6
1.10
4
Slightly
High
9
Implementing CA
tools affects
teachers’ teaching
time.
350
10.6 36.6 34.0 6.6 6.6 5.7
2.7
9
1.26
2
Slightly
Low
10
Textbooks have
enough tasks to
practice the
different CA tools.
350
17.4 33.1 28.6 7.4 13.1 0.3
2.6
7
1.24
4
Low
11
Teachers are
provided with
supportive resources
to apply CA tools.
350
16.3 30.0 36.0 11.4 5.4 0.9
2.6
2
1.10
5
Low
12
All CA tools are
suitable for students'
level of English.
350
17.1 31.7 36.3 5.7 8.3 0.9
2.5
9
1.14
1
Low
13
Textbooks can be
finished within the
proposed semester
time.
350
17.7 30.6 37.7 7.7 5.1 1.1
2.5
5
1.09
8
Low
14
The number of
students in
classroom is
appropriate for
doing the CA tools.
350
26.9 37.4 27.7 4.3 2.9 0.9
2.2
1
1.03
4
Low
All Questions
7.7 16.2 19.9 19.5 23.9 12.7
3.7
4
0.99
2
Slightly
High
Table 4.10 shows the challenges English teachers face when implementing the
prescribed CA tools. The 14 items in this section investigate seven challenges and
each challenge is represented by a number of statements to gather accurate data from
the participants. These challenges are teachers' skills and knowledge of CA, training,
time, textbook, large class size, resources and load of CA. According to Table 4.10,
results of statements 1 and 5 indicate that teachers do not consider their skills and
knowledge of the CA as a challenge. The first item received the highest mean score
(4.93) indicating that teachers have assessment skills and knowledge from the
university course. This is confirmed by teachers' agreement to item 5 which received
a high mean score too (4.65) and it states I have enough knowledge and skills for
implementing the CA tools.
In addition, results of statements 4 and 8 revealed that teachers do not consider
training as a challenge as well. Statement 4 received a mean score of (4.73) and is
considered high indicating teachers' agreement to this statement. In other words,
teachers received training workshops on implementing the CA tools. Besides,
statement 8 received a mean score of (4.06) and is regarded slightly high. This
statement indicates teachers' agreement on the statement that training helps in
acquiring the required skills for implementing the CA tools.
Moreover, results of items 7 and 9 indicate that time is not a big challenge for
teachers when implementing the CA tools, especiall y for preparation work of CA
tools. Item 7 received a high mean score (4.42) indicating that teachers have sufficient
time to develop the CA tools and item 9 received a slightly high mean score (2.76)
indicating that implementing the CA tools does not affect teachers teaching time.
Interestingly, item 6 supports that time is not a challenge for English teachers. Results
of item 6 indicated that teachers are able to finish the writing tasks in the classroom as
part of students' written work tool. To conclude, English teachers in PBE schools do
not consider their skills and knowledge of CA, time and training as challenges when
implementing the prescribed CA tools.
On the contrary, results of other items revealed that teachers have encountered some
challenges when implementing the CA tools. These challenges are heavy textbook,
load of CA work, lack of resources and large class size. The first big challenge
teachers face is the heavy textbook. To illustrate, item 2 received the second highest
mean score (4.87) at which teachers agreed that they have to modify tasks and
activities of the textbook to fit in with CA tools. This item indicates that the English
textbook represents a challenge for teachers as it lacks CA tasks and activities. This is
fostered by teachers' disagreement to item 10 which says "textbooks have enough
tasks to practice the different CA tools" as it received a low score mean (2.67). This is
also supported by item 13 at which teachers disagreed to the statement of " textbook
can be finished with the proposed semester time", These 3 items, (2, 10 and 13)
emphasize that textbook is a big challenge for teachers.
Then according to table 4.10, item 3 received the third highest mean score which is
(4.79). This, to a very big extent, indicates that the heavy load of CA tools work
represents the second big challenge for teachers. In addition, lack of resources in PBE
school is considered as one more challenge. This is indicated by the results of item 11
as it received a low mean score of (2.62) showing teachers' disagreement to the
statement. . Moreover, item 12 indicates the level of difficulty of the CA tools as they
are not suitable for students' level of English. This is a challenge that teachers have
encountered when implementing the CA tools. It is not only the students' level, but
results of statement 14 reveals that teachers have a challenge with the big number of
students in the classroom. In fact, teachers disagreed on the statement "the number of
students in classroom is appropriate for doing the CA tools". Thus, the large class size
is found a challenge for teachers. 92% of teachers disagreed to this statement.
In a conclusion, results indicated that teachers consider heavy textbook, time required
to finish the textbook, large class size, students' level of English, workload of CA and
lack of resources are the major challenges teachers' face when implementing the CA
tools in their PBE school.
1.3 Results regarding third research question:
Question3. How do English teachers practice the prescribed CA tools in PBE schools?
There is a need to investigate how teachers practice the various CA tools in their
classrooms and what teachers' understand about implementing CA tools to achieve the
informative purposes of assessment. Therefore, the results of this question is divided
into two parts. These two parts are explained in this section.
Part one: Teachers' practices of CA tools
4.11: English teachers practices of the prescribed CA tools in PBE schools
N
o.
Statement
N
Strongly
disagree
Disagree
Slightly
disagree
slightly
agree
Agree
Strongly
agree
Mean
Std.
Deviation
Decision
% % % % % %
1 2 3 4 5 6
1
I award the final mark
of CA based on some
of CA tools.
350 0.0 0.6 5.7 34.0 38.0 21.7 4.75
0.88
0
High
2
I implement the CA
tools because this is
part of my work.
350
0.3 1.7 11.1 27.1 34.3 25.4 4.70
1.04
1
High
3
I check students’ work
after feedback is
given.
350
3.1 5.1 10.3 17.7 33.7 30.0 4.64
1.31
4
High
4
I select the useful and
effective CA tools for
my students.
350 2.0 6.0 12.3 21.7 23.1 34.9 4.63
1.33
5
High
5
If my students get low
marks, I repeat the
quiz.
350 2.3 7.7 12.6 29.1 30.3 18.0 4.31
1.25
2
Slightl
y High
6
A quiz takes the whole
lesson to be finished.
350
3.7 8.0 14.9 24.3 28.3 20.9 4.28
1.35
9
Slightl
y High
7
I assess students
writing skill based on
work done at home.
350 3.1
14.
0
22.3 21.7 19.4 19.4 3.99
1.42
9
Slightl
y High
8
I allow some students
to read the
presentation,
especially low
achievers.
350
2.9
15.
4
25.1 18.9 16.9 20.9 3.94
1.46
0
Slightl
y High
9
I accept students’
written work although
they do not
written/done it.
350
4.6
19.
4
31.7 19.1 16.9 8.3 3.49
1.32
4
Slightl
y Low
10
I apply all the CA
tools because they are
effective in improving
students’ achievement.
350
7.1
32.
6
27.1 17.4 7.7 8.0 3.10
1.34
5
Slightl
y Low
11
I finish students’
presentations in one
week.
350 9.1
33.
1
31.5 9.1 7.1 10.0 3.02
1.40
7
Slightl
y Low
All Questions
3.5
13.
1
18.6 21.8 23.2 19.8 4.08
1.23
0
Slightl
y High
Table 4.11 discusses a series of 11 statements with respect to English teachers'
practice of the prescribed CA tools in their schools. The overall score mean is slightly
high (4.08) and it indicates good practices of the CA tools by English teachers.
However, the table highlights teachers' general practices and specific practices of
some CA tools.
Generally speaking, items 1, 2, 3, 4 and 10 describe English teachers' general practice
of the CA tools in their classrooms. Teachers are found not infavor of implementing
all the seven CA tools, but they tend to select from these tools to evaluate their
students. To begin, item 1 which received the highest mean score (4.75) shows that
teachers award the final mark of CA based on some of the CA tools. This reflects
teachers' intention to use some of the seven CA tools. This is supported by item 4 as
79.7% of teachers agreed to the statement "I select the useful and effective tools for
my students". Item 2 has the second highest mean score (4.70) emphasizing that
teachers implement the CA tools only because it is as part of their work. This also
reveals teachers' motive to implement some of the tools. The motive seems that they
have to do it as part of their work regardless their acceptance or attitude. In addition,
teachers' practice of CA tools is connected to the feedback element. Teachers consider
feedback as an important element when implementing the CA tools. Thus, item 3
scored the third highest mean score (4.64) indicating that teachers give feedback to
their students on the CA work as part of their practice and they check students' work
based on feedback given. Finally, in item 10 which says "I apply all the CA tools
because they are effective in improving students' achievement", 66.8% of teachers
disagreed to the use of all CA tools when evaluating students, meaning that they
select some of these tools and this supports items 1 and 4 discussed earlier.
Regarding teachers' practice of some of the CA tools, the remaining six items discuss
the practice of three different tools which are quizzes, students' written work and
presentations. Items 5 and 6 discuss teachers' practice of the quiz tool. Statement 5
scored a mean of (4.31) and it is considered slightly high. This indicates that teachers'
consider the quiz tool as a significant one for learners' assessment. However, results
of the two statements revealed wrong practices of this tool. Item 5 scored a high mean
score (4.31) indicating that teachers repeat the quiz if their students get low marks and
this contradicts the regulations provided in the Students' Assessment Handbook
(SAH), from the Ministry of Education. Besides, item 6 which scored a slightly high
mean score (4.28) shows that teachers conduct a quiz for the whole lesson while the
SAH directs teachers to make the quiz as part of their normal daily lesson. Although
teachers practice the quiz tool, it seems they are not careful about following the
regulations of tools implementation.
Moreover, items 7 and 9 describe teachers' practice of students' written work tool.
Item 7 indicates that teachers assess students' writing skill based on work done at
home. This item scored a slightly high mean score (3.99), but teachers are asked to
implement this tool in the classroom too, not only depending on work done at home.
Item 9 reveals teachers' disagreement on the statement " I accept students' written
work although they do not write it". 55.7% of teachers disagreed to this statement and
this shows good practice of this tool. Teachers are advised to do so and not to accept
any work which is not done by the student himself. On the contrary, very few teachers
agreed to do this practice indicating that they practice this tool inappropriately.
Furthermore, items 8 and 11 describe teachers' practice of the presentation tool.
According to the results of table 4.11, teachers are found to practice this tool in their
classrooms. To illustrate, item 8 received a slightly high mean score (3.94) indicating
that more teachers allow students to read the presentation in front of the class,
especially low achievers. 56.7% of teachers agreed to let students read their
presentation although it is an inappropriate practice of this tool. on the contrary, item
11 indicates teachers' appropriate practice of this tool. 73.7% of teachers disagreed to
the practice of finishing students' presentation in one week. Teachers are advised to
distribute presentation through the whole semester and this is the appropriate practice
of this tool. However, 26.3% of teachers agreed on this statement indicating their
wrong practice of implementing the presentation tool and finish all students in one
week.
In a conclusion, teachers' general practice of CA tools shows their tendency to choose
from the CA tools instead of implementing them all. Their practice also of some CA
tools fluctuates between effective and suitable practice to inaccurate and inappropriate
practice. Results revealed some of teachers' wrong practices in tools like presentations
and quizzes.
Part two: Teachers' understanding of implementing CA tools to achieve
formative purposes of assessment
4.12: English teachers' understanding of implementing CA tools to achieve
formative purposes of assessment
N
o.
Statement
N
Strongly
disagree
Disagree
Slightly
disagree
slightly
agree
Agree
Strongly
agree
Mean
Std.
Deviation
Decision
% % % % % %
1 2 3 4 5 6
1
I give students
opportunity to be
involved in learning
process when
implementing CA
tools.
350
2.6 6.6 9.1 36.0 21.7 24.0 4.40
1.26
9
High
2
I give feedback to
students on their
work of CA to
improve it.
350
0.9 11.1 8.6 33.1 21.7 24.6 4.37
1.29
4
High
3
CA in my school
supports assessment
for learning
350 0.3 10.0
21.
1
14.9 33.4 20.3 4.32
1.29
8
Sligh
tly
High
4
CA is formative
assessment by
nature.
350 3.7 6.0
23.
4
21.7 32.3 12.9 4.11
1.28
0
Sligh
tly
High
5
I make students feel
motivated and
engaged when
applying CA tools.
350
2.6 14.9
23.
1
20.3 14.0 25.1 4.04
1.48
6
Sligh
tly
High
All Questions
2.0 9.7
17.
1
25.2 24.6 21.4 4.25
1.32
5
Sligh
tly
High
Table 4.12 has 5 statements prepared to examine teachers' understanding of the
formative purposes of assessment when teachers implement the prescribed CA tool in
their classrooms. One significant purpose for introducing the CA tools in PBE schools
is to improve the learning process through achieving formative purposes of
assessment where teachers collect data about their students in order to improve the
learning process. Teachers are directed when implementing the CA tools to engage
their students in the learning process and to give them feedback on their work.
Teachers are also advised to make beneficial use of information or data gathered from
assessment.
According to table 4.12, all items scored a slightly high mean score which is (4.25)
indicating that teachers have good understanding of the formative purposes behind
the implementation of the CA tools. As shown in item 1, it received the highest mean
score (4.40) indicating teachers' understanding of the element of students'
involvement in the learning process when implementing the CA tools. Item 5
supported this understanding when it received a slightly high score mean of (4.04)
indicating teachers' agreement on the statement "I make students feel motivated and
engaged when applying the CA tools". Teachers valued learners' engagement as a
significant element of formative assessment. Then, item 2 scored the second highest
mean value (4.37) indicating 79.4% of teachers' who agreed on the practice of giving
feedback to students on their work. This findings also revealed that teachers valued
the element of feedback. In addition, 68.6% of teachers agreed to item 3 "CA in my
school supports assessment for learning" and it supported by a slightly high mean
score which is (4.32). When teachers practice CA to achieve the purpose of
assessment for learning, purposes of formative assessment can be achieved. Finally,
66.9% of teachers agreed to item 4 which says "CA is formative assessment by
nature" as it indicated teachers' understanding of implementing the CA tools in order
to achieve elements of formative assessment. This understanding is fostered by the
most findings of the items involved in this part of the questionnaire.
1.4 Results regarding fourth research question:
Question4. What are the factors influencing English teachers’ adoption
(acceptance/rejection) of the prescribed CA tools?
Teachers' acceptance of tools adoption in their classrooms is investigated by 5
statements as in Table 4.13. The researcher states these factors based on the
theoretical framework which discusses the theories and models of individuals'
acceptance behavior. The factors being investigated in this section are usefulness of
CA tools, teachers' support, teachers' abilities and attitudes and the easiness of CA
tools.
Table 4. 13: Factors influencing English teachers’ adoption
(acceptance/rejection) of the prescribed CA tools
N
o.
Statement
N
Strongly
disagree
Disagree
Slightly
disagree
slightly
agree
Agree
Strongly
agree
Mean
Std.
Deviation
Decision
% % % % % %
1 2 3 4 5 6
1
Teachers’
acceptance of CA
tools is based on
their usefulness for
students.
353 0.0 0.9 2.3
24.
0
34.
0
38.
9
5.0
8
0.89
1
High
2
In PBE schools,
teachers are
supported by
supervisors and
seniors when
implementing CA
tools.
353 0.6 4.3 7.7
16.
3
34.
9
36.
3
4.8
9
1.14
2
High
3
Teachers find
themselves being
able to implement
the CA tools.
353
1.1 4.6
12.
6
17.
7
31.
1
32.
9
4.7
2
1.23
6
High
4
Teacher’s attitude
is significant to
motivate adoption
of the CA tools in
classroom.
353 1.1 2.6 7.4
32.
0
36.
0
20.
9
4.6
2
1.04
7
High
5
CA tools are easy
to be implemented
by teachers in their
classroom.
353
3.4 6.3
18.
0
20.
0
28.
6
23.
7
4.3
5
1.36
2
Slightly
High
6
CA tools are useful
to develop students’
learning and
progress.
353
1.7
14.
6
18.
3
24.
3
26.
3
14.
9
4.0
3
1.33
5
Slightly
High
All Questions
1.3 5.6
11.
1
22.
4
31.
8
27.
9
4.6
2
1.16
9
High
According to table 4.13, the series of the 6 items scored a mean of (4.62) which is
very high. This indicates that English teachers highly valued the factors influencing
the adoption of the CA tools in their classrooms. The first statement which indicates
that teachers' acceptance of CA tools is based on their usefulness for students scored
the highest mean which is (5.08). 94.3% of teachers agreed to this item confirming
that usefulness of CA tools is a very significant factor for teachers' adoption of CA
tools. This factor is supported by the results of item 6 which states "CA tools are
useful to develop students' learning and progress". It scored a slightly high mean
(4.03) which indicates teachers' strong belief in this factor in order to make them
adopt the CA tools in their classrooms. In fact, 65.5% of teachers agreed to this item.
The next three items scored high means ranging from 4.89 to 4.62 and they refer to
other significant factors about teachers' acceptance of CA tools which are support,
teachers' abilities and attitudes. Item 2 received the second highest mean score which
is (4.89). Teachers confirmed their necessity to be supported by supervisors and
senior teachers when implementing the CA tools. In addition, item 3 indicates
teachers' aptitude and trust in themselves being able to implement the CA tools in
PBE schools. Results shows a high mean value of (4.72) scored by this statement.
Similar to this item, item 4 received a high mean value (4.62) indicating teachers'
belief in attitudes as one factor that can influence their acceptance behaviour towards
the adoption of the CA tools in their classrooms. So, if teachers maintain positive
attitude towards the CA tools, they will probably accept to adopt and implement CA
tools in their classrooms.
Finally, item 5 examines the factor of easiness of tools implementation. This item
scored a mean of (4.35) which is slightly high. It indicates that CA tools have to be
easy for teachers when implementing them in their classrooms. Teachers don't want
complexity and difficulty in CA tools. Overall, items about the various factors
influencing teachers' acceptance reveal their significant agreement to these factors in
order to adopt these prescribed CA tools in their classrooms.
4.2 Results of Theme 2: usefulness of CA tools
4.2.1 Results regarding fifth research question:
Question5. What are the perceptions of English teachers towards the usefulness of the
prescribed CA tools in PBE schools?
Table 4. 14: Descriptive summary for the perceptions of English teachers
towards the usefulness of the prescribed CA tools in PBE schools
No
.
Statement
N
Strongly
disagree
Disagree
Slightly
disagree
slightly
agree
Agree
Strongly
agree
Mean
Std.
Deviation
Decision
% % % % % %
1 2 3 4 5 6
1
Implementing
CA tools 350
1.1 2.6
12.
6
34.
6
34.
3
14.
9
4.4
3
1.0
43
High
promotes
students’
engagement in
learning.
2
CA tools help
teachers to
evaluate
students’ level of
English
effectively.
350
7.1
32.
0
31.
1
11.
1
12.
3
6.3
3.0
8
1.3
31
Slightly
Low
3
CA tools are
useful to
determine
students’
strengths and
weaknesses.
350 12.
0
31.
1
31.
4
16.
6
2.6 6.3
2.8
5
1.2
68
Slightly
Low
4
CA tools
stimulate
students’ skills of
critical thinking,
problem solving
and decision
making.
350
10.
6
34.
0
30.
3
19.
4
4.3 1.4
2.7
7
1.0
99
Slightly
Low
5
CA tools provide
chances for
giving feedback
to improve
students’
performance.
350 12.
3
30.
9
41.
7
8.0 3.7 3.4
2.7
0
1.1
19
Slightly
Low
All Questions
8.6
26.
1
29.
4
17.
9
11.
4
6.5
3.1
7
1.1
72
Slightly
Low
Table 4.14 delivers a series of 5 items with respect to English teachers' perceptions
toward the usefulness of CA tools. The overall mean of the 5 items is (3.17) which is
slightly low. This mean value indicates that teachers disagreed to the statements and
emphasized their negative perception towards the usefulness of CA tools
Although the first item scored the highest mean value, all the remaining 4 items
scored slightly low means ranging from (3.08 to 2.70) which, to a very big extent,
reflect teachers' disagreement to all these statements. For instance, statement 2 stating
"CA tools help teachers to evaluate students' level of English effectively" received a
slightly low mean (3.08). Teachers' disagreement to this statement shows that CA
tools do not give students' actual level of English and this what makes teachers
trustless in these tools. In addition, statement 3 stating "CA are useful tools to
determine students' strengths and weaknesses" received slightly low mean too which
is (2.85). 74.5% of teachers found the CA tools to be not helpful to identify students'
strengths and recognize areas to be improved in students' learning.
Moreover, statement 4 which states "CA tools stimulate students' thinking skills of
critical thinking, problem solving and decision making" received a slightly mean
score (2.70). In fact, 74.9% of teachers found that CA tools do not support future
skills. Nowadays, learning is targeted towards achieving these 21st
century skills. and
teachers find these tools unable to achieve such skills. Moreover, statement 5 which
indicates that CA tools provide chances for giving feedback to improve students'
performance scored a slightly low mean value (2.70). 84.9% of teachers disagreed to
this statement and results confirms teachers' inability to provide their students with
the necessary feedback to improve their work. Thus, teachers find the CA tools less
useful to improve the learning process.
Finally, teachers' positive perception is stated only in item 1. The first statement about
"Implementing CA tools promotes students’ engagement in learning" scored the
highest mean score (4.43) which indicates a percentage of 83.3 teachers' agreement to
this statement. Teachers find the CA tools is useful in developing the learners'
engagement in the learning process, but this shows limited positive perception.
4.2.2 Results regarding sixth research question:
Question6. What are the major CA tools that teachers use more frequently to assess
students’ learning in their PBE schools?
To answer this question, the researcher used seven statements about each CA tool. As
seen in table 4.15, these statements investigate the seven prescribed CA tools, daily
observation, informal record, written work, classroom questioning, presentations,
quizzes and projects, to identify the most frequent tools implemented by English
teachers in their classrooms. Results are stated in table 4.15 below.
Table 4. 15: The major CA tools that teachers use more frequently to assess
students’ learning in their PBE schools
No. Statement
N
Strongly
disagree
Disagree
Slightly
disagree
slightly
agree
Agree
Strongly
agree
Mean
Std.
Deviation
Decision
% % % % % %
1 2 3 4 5 6
1
I observe and records
comments on
students’
performance.
350
0.6 2.0 4.6 22.6 35.1 35.1 4.95 1.016 High
2
I use a form of criteria
when assessing
students’
presentations.
350
0.3 0.6 3.1 37.7 25.1 33.1 4.86 0.957 High
3
I ask questions to
students in the
classroom during the
lesson for assessment
purposes.
350
0.3 2.0 5.4 27.7 37.4 27.1 4.81 0.980 High
4
I ask students to do a
project to help them
get better marks.
350 0.6 2.0 4.9 33.7 33.4 25.4 4.74 0.995 High
5
Having more quizzes
is better than having
more CA tools.
350 0.9 4.3 9.1 21.4 36.3 28.0 4.72 1.144 High
6
I depend on
observation without
recording comments;
there is no need for
written comments.
350
0.9 2.6 9.4 25.4 34.6 27.1 4.72 1.093 High
7
I assess students
writing skill based on
composition done in
the classroom.
350
1.4
10.
0
20.
0
20.3 24.0 24.3 4.28 1.366
Slightly
High
All Questions 0.7 3.4 8.1 27.0 32.3 28.6 4.73 1.079 High
According to table 4.15, English teachers highly regarded the use of CA tools as the
overall mean score of all statements is high (4.73). Results indicate that teachers
practice all CA tools in their classrooms. However, the first three highest mean scores
ranging from (4.95 to 4.81) which indicate that teachers use the tools of daily
observation, presentations and classroom questions more frequently in their
classrooms than the other tools.
To begin, item 1 indicating "I observe and record comments on students'
performance" scored the highest mean score (4.95). It reveals that the most common
and frequent tool used by teachers is daily observation. This is related to the easiness
of this tool as teachers implement it when teaching their everyday lessons and at the
same time they easily observe their students' performance and notice their
development behavior. The second most frequently used tool by teachers is the
presentation tool. Item 2 "I use a form of criteria when assessing students'
presentations" received the second highest mean score (4.86). According to item 3,
the third frequently used tool is classroom questioning. it received a high mean value
of (4.81) emphasizing that teachers ask questions in the classroom during the lesson
for the assessment purposes. Moreover, item 4 about the project tool shows a high
mean value of (4.74). Teachers practice this tool for the purpose of helping their
students improve the overall of the CA mark. Project comes in the fourth position
because teachers take advantage of this tool to improve students' final mark of CA.
Interestingly, the tools of quizzes, informal records and students written work appear
at the end of the list of the most practiced CA tools. Based on results of item 5, a high
mean of (4.72) indicates teachers agreement of implementing the quizzes in their
classrooms to assess their students. So it comes in the fifth place among the most
frequently practiced CA tools. Furthermore, the statement about the informal record
tool received a mean score of (4.72) putting it at the sixth place. According to
teachers, this tool is practiced less than the other tools in the classroom as it required
more effort from teachers. In fact, in this tool, teachers are asked to write comments
on every student on each skill of the four language skills. This could be the reason
placing it at the end of the list. Finally, item 7 about students' written work received a
slightly high mean score of (4.28). Students' written work tool comes at the end of the
list because teachers want to evaluate students' writing skill based on compositions
written in the classroom, as results revealed that 68.6% of teachers agreed to this
statement.
In a conclusion, English teachers practice all the prescribed CA tools in their
classroom, but it varies according to their convictions. The majority of teachers
frequently practice the tools of daily observations, presentations and classroom
questions. Quiz tool is also practiced to some extent. On the other hand, the least two
frequently used tools are informal records and students' written work tools.
4.2.3 Results regarding seventh research question:
Question7. Which CA tools English teachers find easy and useful for learners’
assessment?
To answer this question, the researcher stated seven statements, one for each tool to
find out the most easy and useful CA tools according to English teachers. Results are
explained in table 4.16.
Table 4. 16: The most prominent CA tools that English teachers find easy and
useful for assessing learners
No Statement
N
Strongly
disagree
Disagree
Slightly
disagree
slightly
agree
Agree
Strongly
agree
Mean
Std.
Deviation
Decision
% % % % % %
1 2 3 4 5 6
1
The practice of the 4
types of writing
improves students’
writing skill.
350
0.3 0.9 7.4 33.4 36.9 21.1 4.69 0.934 High
2
Quizzes are the major
assessment tool I use to
assess students.
350 0.6 5.7 12.3 22.6 33.1 25.7 4.59 1.190 High
3
Day to day observation
tool helps gathering
useful information
about students.
350
0.3 3.4 14.6 28.9 34.6 18.3 4.49 1.073 High
4
Classroom questioning
tool develops students’
higher thinking skills. 350
1.7 1.7 14.6 32.0 34.3 15.7 4.43 1.078 High
5
Student’s informal
record is a reliable tool
for teachers to assess
students’ performance.
350
4.6 27.4 44.3 14.6 5.1 4.0 3.00 1.083
Sligh
tly
Low
6
Projects play effective
roles in developing
learners’ life and social
skills.
350
9.4 28.0 38.0 10.9 11.1 2.6 2.94 1.201
Sligh
tly
Low
7
Students perform
presentations in a way
that improves their
speaking skill.
350
10.
9
31.1 37.1 8.3 7.4 5.1 2.86 1.254
Sligh
tly
Low
All Questions
4.0 14.0 24.0 21.5 23.2 13.2 3.86 1.116
Sligh
tly
High
Generally speaking English teachers find four CA tools to be very easy and useful for
their learners. They are students' written work, quizzes, daily observation and
classroom questioning. On the other hand, the tools of informal records, projects and
presentations are found to be the least useful for students. According to table 4.16, the
highest mean value is received by statement 1 which represents students' written
work tool and it received a mean of (4.69). 91.4% of teachers confirm that the most
useful tool is students' written work as it develops students' writing skill. The second
useful tool is the quizzes. Item 2 received a high mean score of (4.59). Quizzes comes
at this position because 81.4% of teachers agreed that quizzes are the major tool for
learners' assessment and they think that quizzes provide the actual level of students. In
addition, the third statement received a high mean value of (4.49) confirming that
daily observation tool is useful. 78.9% of teachers agreed that this tool helps them to
gather useful information about students' performance.
On the contrary, the last three statements received slightly low mean scores. The score
means range from (3.00 to 2.86) and indicate that the tools of informal records,
projects and presentations are less useful for students. Teachers' disagreement to items
5 and 6 emphasize that tools of informal records and projects are not reliable and not
useful for learners' assessment. Thus they appeared at the end of the list. Informal
records and projects are not useful because they seem demanding for more efforts and
time. Teachers may not have the time to take notes and ask students to do projects.
Finally, with regard to item 7, "Students perform presentations in a way that improves
their speaking skill", received the lowest mean score (2.86). The mean value indicates
that teachers find the presentation tool to be the least useful one for students and does
not help learners to improve their speaking skill.
To conclude, English teachers find tools of students' written work, quizzes, daily
observation and classroom questioning to be very useful for students' learning and
assessment, while projects, informal records and presentations are the least useful
tools.
4.4 Qualitative Data Analysis
Analysis of qualitative data is done based on two major instruments; the open-ended
questions and observation instrument. The researcher decides to analyze the data manually.
Manual analysis of open-ended questions involves carefully reviewing and interpreting the
responses provided by participants in a study. This type of analysis can be time-consuming,
but it provides valuable insights into the thoughts, opinions, and experiences of the study
population. It can also yield rich and accurate insights into the attitudes, beliefs, and
experiences of the participants.
When analyzing data of the open-ended questions, the researcher followed the
concept of qualitative content data analysis by taking important data and grouping
them into themes. So, the researcher has gone through teachers' responses of each
question one by one and put them all in organized tables. Then, the data is filtered and
only the required data is collected. The frequency of responses are counted and given
percentages. Giving percentages helps to organize and order the responses from the
highest to the lowest percentage. This procedure has been done to all the responses of
the 8 open-ended questions. Later, the researcher sorts out the data to find out the
most common responses as well as the least repeated ones. The qualitative analysis
findings are demonstrated as “themes”, which generated a comprehensive and
influential conclusions regarding English teachers' perception towards the
implementation and usefulness of the prescribed CA tools in PBE schools in the
Sultanate of Oman.
The researcher also conducted the data analysis of the observation instrument. The
form which is utilized to serve this purpose has three columns of "Implemented",
"Implemented to some extent" and "Not implemented". When analyzing the data of
the classroom observation tool, the researcher has interpreted the two columns of
"Implemented" an "Implemented to some extent" together, while the column of "Not
implemented" is interpreted separately. The researcher finds it helpful to combine
the two columns as this can lead to a better understanding of teachers' practice of the
prescribed CA tools in their classrooms. It also provides a bigger chance to recognize
the various CA tools that take place in English teachers' lessons.
In this section, qualitative content analysis of the participants' responses to the eight
open-ended questions in part 4 of the questionnaire is carried out as well as the
qualitative data analysis of the classroom observations collected from 21 classroom
observational visits. The process of qualitative analysis of open-ended questions and
observations is carried out according to the two main themes; implementation and
usefulness of the prescribed CA tools. Analysis is conducted in order to extract the
required in-depth qualitative information that provides deeper understanding of the
study problem, and supports the obtained quantitative statistical results. This section
begins with the demographic description of the qualitative participants and then it
displays the findings of the qualitative analysis.
4.4.1 Qualitative Data Analysis of Theme 1: Implementation of CA Tools
4.4.1.1 Findings regarding the first research question:
Q1: What are the perceptions of English teachers towards the implementation of the
prescribed CA tools in PBE schools in Batinah North Governorate?
The researcher designed this question to encourage teachers to write about the
weaknesses and the strengths of the CA tools so that teachers' perception can be
derived based on their responses. Out of the 350 teachers, 9 teachers didn't respond to
this question. The researcher studied teachers' responses about the weaknesses and
strengths as a way to help understand their perception towards the CA tools and how
they perceive them. In fact, responses of each teacher about weaknesses and strengths
of CA tools range from three to one response. These responses were collected and
categorized into two main categories representing the positive and negative
perceptions. Then they were organized after counting the frequencies of each response
in order to rank them in a descending order.
Data of this question revealed interesting findings. In general, teachers provided 18
different responses about the prescribed CA tools, where the researcher categorize
them under teachers' negative perception towards the CA tools. Whereas, teachers
reported 12 strengths about the implementation of CA tools. Accordingly, the
majority of teachers are found to maintain negative perception towards
implementation stage of the CA tools in the PBE schools. A total of 472 negative
responses compared to 301 positive ones reported by the study participants.
Consequently , English teachers' negative perception may have influenced the
implementation of the prescribed CA tools. In the beginning, teachers responses of
positive perception is summarized and presented in table 4.17.
Table 4. 17: Teachers' negative responses about their perception towards
implementation of CA tools.
Responses Frequency
No time to finish all the CA tools 64
Has a big number of activities/papers about CA tools 54
Marks are not true and don't reflect actual level of students 49
Listening skill is not assessed 42
Presentation tool does not deserve 10 marks of CA 39
Tools are heavy burden on teachers 33
Too many quizzes 31
Marking students' written work requires too much time 28
Too much repetition of tools activities 26
Students are overloaded with lots of activities and quizzes 17
Do not match questions types of final exams 15
Large number of students in classroom 14
Do not match the curriculum 12
Repeating students' work to choose the best mark 11
Do not match students’ level 10
Puts more pressure on students 9
Some CA tools are inappropriate to assess students 7
Has easy types of questions that enable students to cheat
like MCQ questions
6
472
When analyzing teachers' negative perceptions, the researcher classified their
responses into three categories; negative responses about the CA tools, negative
responses about tools influencing students and the amount of load which CA tools
impose on teachers and students. Generally, CA tools puts heavy load on teachers and
students and do not show relevance to textbooks and final exam questions. The most
important thing is that these tools do not provide the actual level of students
achievement. To illustrate, 64 teachers show their negative perception towards the CA
tools because they reported that implementing the prescribed CA tools requires too
much time. Teachers pointed that they don't have the time to finish them all. 54
teachers also indicated that CA tools impose a big number of activities and tasks that
add extra load on them and 49 teachers indicated that marks collected from CA tools
don not provide the actual level of students' performance.
Teacher want the CA tools to evaluate all the language skills, however, the listening
skill is not assessed by any tool of the CA tools and this is according to 42 teachers
who stated listening skill is not assessed with in CA. Interestingly, 39 teachers
highlighted that the presentation tool does not deserve ten marks. They think that
these 10 marks should be exerted to important skills like reading and writing or even
include listening to the CA system. Besides, 15 teachers reported that CA tools do not
match the final examination questions and 12 teachers said that they do not match the
curriculum.
Teachers develop their negative perception towards the CA tools because they put
heavy burden on them. According to table 4.17, 33 teachers reported that these CA
tools represent heavy load on teachers and 31 teachers explained that the tools are
about implementing too many quizzes to cover the different language skills. Teachers
think that the quizzes are a lot and put more pressure on them. In addition, 28 teachers
indicated that marking students' takes or quizzes requires too much time and 11
teachers highlighted that teachers sometimes provide chances for students to repeat
some CA tools in order to choose the best mark or may be the highest one. 7 teachers
and the tools inappropriate to assess students.
Moreover, teachers found that students were influenced negatively when
implementing CA tools in the classroom. Firstly, 17 teachers noted that students are
overloaded with lots of activities and quizzes. Secondly, 14 teachers reported that
there are a large number of students in the classrooms and this makes the
implementation of the CA tools difficult. Thirdly, 9 teachers explained that CA tools
put more pressure on students because they ask for lots of work. Finally, 6 teachers
stated that CA tools examines students using some easy types of questions like
multiple choice and this enables students to cheat in exams and quizzes.
Regarding teachers' responses about their perception towards the implementation of
CA tools, the researcher read through and summarized them in Table 4.18 below.
Table 4. 18: Teachers' negative responses about their perception towards
implementation of CA tools.
Responses Frequency
Covers different skills of the language and variety of skills
are assessed
51
Helps to follow students’ progress/improvement in learning 44
Motivates students to learn and can improve their grades 42
CA tools show the actual level of students’ performance 36
Prepares students for final exam 32
Practice the language and gain knowledge 29
Makes students study hard and prepare for the CA work 21
Involves students in the learning process 13
Students learn how to organize their work 10
Helps teachers gather information about students 9
CA tools help testing students' understanding and
comprehension
8
Some tools help to assess students' level accurately 6
Total 301
The researcher analyzed teachers' positive responses about the implementation of the
CA tools and are categorized into two subcategories. The first section is teachers
good belief about the CA tools and the second one is the tools impact on developing
students' performance. Regarding the first section, 51 teachers indicated that CA
tools cover and assess the different language skills. Besides, 44 teachers explained
that tools help teachers to follow their students' progress in learning. Interestingly, 36
teachers reported that CA tools show the actual level of students' performance and 29
teachers highlighted that tools give opportunities for students to practice the language
and gain knowledge.
Teachers also expressed through their responses the impact of implementing the CA
tools on their students. To illustrate, 32 teachers indicated that CA tools prepare
students for the final exams as they provide students with similar tasks and activities.
Besides, 21 teachers pointed that CA tools make students study hard and always
prepare for the CA work. Moreover, 13 teachers reported that tools help to involve
students in the learning process and 10 teachers confirmed that students learn how to
organize their work from doing tasks of CA.
In a conclusion, English teachers in post basic education (PBE) schools have negative
perception towards the implementation of CA tools as the majority of their responses
showed that the implementation of the CA tools is inappropriate and difficult,
demanding and overloading for them and sometimes CA tools do not give students'
actual level of English. On the contrary, very reasonable number of teachers'
responses confirm that the implementation of CA tools is reliable, suitable and
beneficial.
4.4.1.2 Findings Regarding Second Research Question:
Q2: What are the challenges that English teachers encounter in implementing the
prescribed CA tools?
To answer the second question, teachers were given the most common challenges
investigated in literature and were asked to choose only three challenges out of five
given to them in the question. Teachers' responses represent the most challenges they
face in their schools when implementing the CA tools. All teachers responded to this
question. Teachers' responses were counted and the findings are presented in Figure
4.1 below.
Figure 4. 1: Challenges English teachers’ face when implementing the prescribed
CA tools
It can be noticed from Figure 4.1 above that there is a consensus in the responses of
English teachers to the question about the challenges they face in their schools. In
general, all teachers confirm the existence of the five challenges in PBE schools when
implementing the prescribed CA tools. Interestingly, teachers have mentioned some
other challenges they face when they added their explanations to justify their
selections of the challenges.
According to Figure 4.1, English teachers consider the large class size as the biggest
challenge for them. Out of 350 teachers, 326 reported that there is a high number of
students in their classroom and this obstacles the implementation of the CA tools. 299
teachers reported that time constraint is the second biggest challenge they face in the
PBE schools. Teachers sometimes ask for extra time to finish the textbook, so the CA
tools require additional time to be finished and this doubled the time teachers need to
finish both the textbooks and the CA tools. Teachers also consider the curriculum as a
challenge. It comes in third place after class size and time as 226 teachers reported it
as a challenge. As teachers explained, textbooks lack the tasks and activities that
support the implementation of the CA tools. However, teachers' responses reveal that
training and teachers' knowledge and skills are not considered big challenges when
implementing the CA tools. Out of 350 teachers, 76 reported training as a challenge
and only 52 reported that teachers' knowledge and skills as another challenge.
Teachers have justified their view by reflecting on training sessions given to them.
They were trained to some extent so that they have acquired the knowledge and skills
to implement the tools.
326
299
226
76
52
Large class size Time Curriculum Training Knowledge and
skills
Challenges of implementing CA tools
350
In this question, the researcher also asked teachers to write some explanations in order
to in depth understand and support their selections of the challenges. Interestingly, the
majority of teachers reported valuable explanations, however, out of 350 only 21
teachers didn't write any explanations. Teachers' explanations are summarized and
presented in a descending order in Table 4:19 below.
Table 4. 19: English teachers’ explanations about the challenges of implementing
the prescribed CA tools in PBE schools
Responses frequency
Overcrowded classrooms/ large class size/ huge number of
students in the classrooms
106
Time provided to implement the CA tools is not enough 87
Heavy curriculum which needs long time to finish 71
The curriculum does not match CA tools 52
Too much work/ lot of things to cover quizzes/ activities 42
Students' level does not help to finish all CA tools 37
Finishing the CA tools with the curriculum is very difficult 28
CA adds extra load on teachers besides school work 22
Teachers face many/too many challenges in implementing CA
tools
19
Training on how to apply tools 17
Most of teachers need training o implementing CA tools 16
We need 2 to 3 lessons to apply one CA tool 11
Teachers should have knowledge and skills to implement CA
tools
10
Marking of writing and making of CA tool activities consume
teachers' time
7
A document comes in many pages, how teachers can read and
understand CA tools
3
Total 528
Generally speaking, teachers' explanations strongly support the findings of the first
part of the question. It can be noticed that the first three dominant challenges teachers'
encounter in implementing the CA tools are large class size, time, and the curriculum.
106 teachers explain that there are many students in the classroom so the teacher
needs time to cover the tools with such big number. 87 teachers report that the time is
not enough to finish all the CA tools. Thus, they always link this difficulty to the large
classroom size as well as the heavy curriculum. In fact, 71 teachers report that the
curriculum is a significant challenge. Teachers report two challenges about the
curriculum. It is true that they have to finish the heavy curriculum, but teachers add
that the curriculum does not match the CA tools. In other words, teacher don't find it
supportive to the implementation of CA tools.
However, teachers reflect more in depth explanations about the previous three
challenges. To illustrate, it is not only that the classroom is crowded but also the level
of the students does not help teachers to implement the CA tools or even to finish
them. Therefore, 37 teachers highlight students' level of English as another challenge
hindering them from implementing the CA tools. Moreover, 42 teachers indicate that
the CA tools come up with extra work and load which burden teachers duty in
schools. Furthermore, 17 teachers explain that training is required for the success of
tools implementation. 10 teachers' point out that teachers' need to be trained to absorb
knowledge about the CA tools.
4.4.1.3 Findings Regarding Third Research Question:
Q3: How do English teachers practice the prescribed CA tools in PBE schools?
The researcher depends on two instruments to collect data in order to answer this
question; open-ended questions and classroom observation instrument. Findings of the
data of this question is divided into two sections. The first section aims to find out
how teachers practice the prescribed CA tools in their lessons. In the second section,
the researcher describes teachers' implementation of CA tools whether their practice
achieves the formative purposes of assessment or not. Qualitative findings of the two
sections are reported below.
Section1: English teachers' practice of prescribed CA tools
The researcher used a form that includes indicators of the seven prescribed CA tools.
So, the researcher conducted 21 classroom observations and collected qualitative data
about the indicators of the seven CA tools (Day to day observation, Classroom
questioning, Presentation, Written work, Projects, Quizzes and Informal record
keeping). There are three indicators representing each CA tool. Frequencies of all
indicators representing the seven CA tools were calculated and displayed in Appendix
1.1. However, the researcher only highlighted the most observed indicators practiced
by teachers in their classrooms in Table 4.20 below.
Table 4. 20: Most implemented indicators of the prescribed CA tools by teachers
No
Prescribed
CA
Tools
Tools indicators No. of lessons
observed
Freque
ncy
1
Classroom
questioning
Lots of questions are asked during the
lesson
21 21
All students are involved in answering
teacher’s questions.
21 18
2 Day to day
observation
Teacher reacts to students’ facial
expressions and body language.
21 21
Teacher calls some students to put down
their names for assessment.
21 17
3 Quizzes
Teacher announces a quiz for the next
lesson
21 16
Teachers implement a quiz during the
lesson.
21 14
4 Written work
Teacher refers to students’ written work in
their EX. Book.
21 16
Individual/pair/group writing activities
done during the lesson.
21 14
5
Informal
record
keeping
Teacher calls students’ names to evaluate
their performance.
21 12
Teacher writes comments/jots down notes
on students' performance.
21 8
6 Presentation
Teacher assigns presentations to students 21 12
Student present topics of their interest
during the lesson.
21 8
7 Project
Projects are assigned by the teacher during
the lesson.
21 6
Teacher checks students’ implementation
of their projects as assignments.
21 7
Generally speaking, English teachers practice all the CA tools in their classrooms.
Interestingly, they are found to implement at least two of the three indicators of each
CA tool. According to table 4.20, it is worth mentioning that the indicators of
classroom questioning , day to day observation, quizzes and written work tools are the
most practiced ones by English teachers in the 21 observed lessons. There are 8
dominant indicators that have been practiced regularly in the observed lessons.
Observations of these 8 indicators ranged from 14 to 21 lessons which represent a
high percentage of implementation in classrooms. On the other hand, the rest of
indicators representing tools of informal records keeping, presentations and projects
are reasonably observed and they ranged between 6 to 12 lessons in the 21 observed
lessons. Teachers either delay these tools to the end of the semester or stop
implementing them due to the challenges they face in PBE schools.
According to the table, findings show that the most commonly practiced indicators in
the 21 observed lessons are the indicators of the classroom questioning tool. English
teachers are found to ask lots of questions during the lesson in all the 21 observed
lessons and the indicator of all students are involved in answering teachers' questions
is observed in 18 lessons. Indicators of the day to day observation tool become the
second ones observed in the 21 lessons. Teachers are found to react to students’ facial
expressions and body language in all the observed lessons and teachers call some
students to put down their names for assessment is observed in 17 lessons. Quiz tool
comes in the third place. The most practiced indicator is teachers announce quiz for
the next lesson. This indicator is observed in 16 out of 21 lessons. 14 teachers also
implemented quizzes during the 21 lessons. This indicates that teachers depend on the
traditional tool of exams and quizzes to evaluate their students. Moreover, the
indicators of students' written work tool are reasonably practiced by English teachers
in their lessons. 16 teachers refer to students' written work done in their exercise book
and 14 teachers do different types of writings (individual/pair/group writing) in the 21
observed lessons.
On the contrary, it can be noticed from the table that teachers, to some extent, are
hesitant about implementing the indicators of informal records keeping, presentations
and projects tools. They may find these tools less useful for their learners, thus their
practice of these tools is limited. To illustrate, the indicators of these tools are
observed shortly from 6 to 12 lessons out of the 21 lessons observed. This could be
due to the challenges teachers face when implementing the CA tools or dissatisfaction
of these tools. For the informal records keeping tool, 12 teachers implement the
indicator of teacher calls students’ names to evaluate their performance and 8 teachers
only writes comments or jots down notes on students' performance in the 21 lessons.
Moreover, presentation and project tools become at the end of the list, their indicators
are practiced moderately by English teachers. The indicator of teacher assigns
presentations to students is observed in 12 lessons and students present topics of their
interest during the lesson is observed in 8 lessons only out of 21. Finally, indicators of
the project tool are found moderately practiced by teachers in the 21 observed lessons.
The indicator of teacher checks students’ implementation of their projects as
assignments is observed in 7 lessons and projects are assigned by the teacher during
the lesson is observed only in 6 lessons.
According to table 4.20 presentations and projects tools appear at the end of the list.
Interestingly, the researcher supplemented this instrument with an open-ended
question which is "Why do you think teachers delay tools of presentation and project
to the end of semester?". This question is accidently serves to understand the findings
of the classroom observation instrument. Therefore, it is expected that this question
can add valuable data to understand teachers' practice of the presentations and
projects tools. The researcher wants to investigate the reasons for delaying the
implementation of these two tools.
First, the researcher studied teachers' responses and found that teachers reported their
views about the delay of these tools. Analysis was very helpful to recognize who
delay the implementation of these two tools and who don't delay. Findings is
summarized in Table 4.21 below.
Table 4. 21: English teachers' practice of presentation and project tools
Presentation
and project
tools
Teachers who
don’t delay
Teachers who
responded we delay
Teachers left it
Unanswered/
Frequency 76 253 21
Percentage 21.7% 72.3% 6%
Findings generally show that he majority of English teachers postpone the
implementation of presentation and project tools to the end of the semester.
According to table 4.21, 253 out of 350 teachers indicated in their responses that they
delay these tools and 76 teachers reported that they don't delay them to the end of the
semester. Some teachers reported that they start implementing these two tools in the
beginning of the semester. However, only 21 teachers left this question unanswered,
they didn't respond to this question.
Then, accordingly and in order to verify the previous findings to identify the reasons
why teachers postpone presentations and projects to the end of the semester, the
researcher qualitatively analyzed teachers' responses of reasons and organized them in
a descending order as shown in Table 4.22 below.
Table 4. 22: English teachers’ reasons for postponing presentation and project
tools
Responses Frequency
These tools consume too much time and this wastes our teaching time 64
Teachers provide chances for students to acquire language, more
knowledge and more skills
52
Teachers focus on finishing the heavy curriculum 48
Students are carless and refuse to present and do project early in the
semester
44
Teachers work hard to follow the scheme of work 34
Teachers give time for students to prepare and be ready to present and
make a project
29
Teachers are overloaded with work and duties 27
Teachers want to finish the important tools like quizzes, written work 26
Lots of marking especially students written work tool 19
Students are overloaded 18
Teachers want to recognize students' level 15
Too many students in the class 14
Presentation and project tools are easy to apply and evaluate 10
Teachers want to help students get more marks, so they do it at the
end of semester
7
Presentation and projects are less important tools 6
In general, the reasons of postponing the implementation of presentations and projects
to the end of the semester are similar to the challenges teachers face in their PBE
schools. Findings show that the reasons for the delay in based on time, heavy
curriculum, work overload, students level and other significant factors. According to
table 4.22, the most common reasons reported by English teachers for tools delay are
time, students' level, heavy curriculum and heavy load of work and duties in PBE
schools. According to 64 teachers, the strongest reason for delaying presentations and
projects is "These tools consume too much time and this wastes our teaching time.”
Then the reason of “Teachers provide chances for students to acquire language, more
knowledge and more skills ” comes in the second place where 52 teachers reported
this reason. Heavy curriculum is reported by 48 teachers as the third significant
reason. In addition, students' themselves represent a reason for the delay. 44 teachers
reported that students are carless and refuse to present in the beginning of the
semester. Moreover, 27 teachers mentioned that they delay these tools because they
are overloaded with work and duties. 26 teachers think that presentations and projects
are not important and they want to finish the important tools they think more
important for learners' assessment.
Interestingly, reasons like lots of marking, large class size, students' overload are the
least mentioned by teachers. Although 10 teachers responded that presentation and
project tools are easy to be implemented, 6 teachers said that they are not important
so they postpone them to the end of the semester.
Section2: English teachers' implementation of CA tools to achieve formative
purposes of assessment
The prescribed CA tools are introduced in the assessment system in PBE school in
order to activate the benefits of the elements of formative assessment so that English
teachers apply the CA tools in order to achieve the formative purposes of assessment.
This requires teachers' understanding of the formative assessment in relation to its
elements. Therefore, the researcher utilized two open-ended questions to collect data
about this issue. The analysis of the qualitative content of data collected questions
focuses on examining the extent to which teachers understand that CA is formative
assessment by nature.
The first question examines teachers' responses to the open-ended question of their
agreement with the statement that says "Continuous assessment is formative
assessment by nature" and findings is shown in Table 4.23.
Table 4. 23: Percentage and frequency of teachers’ consensus on the truth of the
statement that “Continuous assessment is formative assessment by nature”
Analysis
Teachers who
responded
"Correct"
Teachers who
responded
"Incorrect"
Left unanswered
or no comments
or
no idea
Frequency 226 88 36
Percentage 64.5% 25.1% 10.4
According to Table 4.23, findings show that the largest percentage of teachers
(64.5%) agree that the statement “Continuous assessment is formative assessment by
nature” is correct, (25.1%) of them do not believe that it is correct, and only (10.4%)
have no response or do not have any idea about the statement. It is worth mentioning
that 226 teachers out of 350 have a clear understanding of implementing CA tools in
order to use assessment data to develop the learning process and improve learners'
performance. This number imposes teachers' awareness of implementing the CA
tools in a way that achieves learners' engagement and feedback to learners. However,
it should be highly considered when 88 out of 350 teachers responded that the
statement is incorrect. It means 25% of teachers do not understand that CA comes to
work in line with the formative purposes of assessment. This group seems to
implement the CA tools without peering in mind the elements of formative
assessment. Lastly, 36 teachers have no idea about what this statement means. This
group, if added to the previous group, the percentage will be 35.5% and this
represents teachers' poor understanding of the essence of implementing the CA tools
to achieve formative purposes of assessment.
Accordingly, in order to ascertain teachers' understanding of the concept of
implementing CA to achieve formative purposes of assessment, teachers were asked
to provide explanations about their understanding of the statement. They gave various
explanations and the researcher analyzed their responses and presented them in Table
4.24 below
Table 4. 24: English teachers’ explanations showing teachers' understanding of
the statement "CA is formative assessment by nature."
Responses Frequency
Teachers collect data about students continuously 54
Formative assessment is part of CA 36
CA helps teacher to view their teaching 34
Teachers do CA to know students' progress or level 30
It is an on-going process, it is continuous in the semester 28
Teachers can give feedback to students on their work 17
CA is based on learner’s engagement 16
Teachers use different tools according to students’ level to
evaluate them
14
Both are similar 12
Tools are used to improve students' performance 11
It is correct because formative assessment is about feedback 11
It can give us feedback about students' level 10
CA is evaluating students in all language skills 9
Correct. Students need to practice to develop their skills 8
Teachers who responded that the statement is correct, they provided interesting
explanations about CA is formative assessment by nature and this revealed their
appropriate understanding of the statement. Generally speaking, their responses
pointed that teachers are aware of the meaning of CA. teachers understand that it
represents an ongoing process of implementing the various CA tools to gather data
about students. Their responses also stress the elements of formative assessment like
feedback and learner's engagement. They provided 14 explanations confirming good
understanding of tools implementation. Thus, 54 teachers wrote that the statement is
about collecting data about students continuously through the semester using the CA
tools. 36 teachers also reported that formative assessment is part of CA. This to some
extent makes close understanding of CA and formative assessment as they meet in
something similar. Besides, 34 teachers feel that CA helps them through using the CA
tools to look back at their teaching and modify their methods and ways. In addition,
28 teachers supported the first explanation about looking at CA and tools as an
ongoing process of implementation.
However, very few teachers who reported in their explanations that learners'
engagement and feedback are essential elements to be achieved when implementing
the CA tools. 17 teachers explained that CA help them to give feedback to their
students and 11 teacher responded that statement is correct because formative
assessment is about feedback. In addition, 16 teachers wrote that the statement means
CA is based on learner's engagement. Interestingly, the two elements of formative
assessment have appeared in teachers' responses about the statement meaning their
good understanding of CA is formative assessment by nature.
On the contrary, teachers provided few responses that highlight their limited
understanding about the statement. These responses are presented in Table 4.25.
Table 4. 25: English teachers’ explanations representing limited understanding
Responses Frequency
CA is different from formative assessment 40
CA depends on tests and quizzes 21
CA should be summative 8
No idea, no comments 8
It depends on students information 5
Its correct. All language skills can be gained by nature 4
According to Table 4.25, it is worth mentioning that teachers provided six irrelevant
responses about their understanding of the statement. These responses indicate
teachers' weak understanding of CA is formative assessment by nature. As a result,
this limited understanding can be reflected on teachers; practice of the CA tools in
their classes. To illustrate, 40 teachers explained that CA is different from formative
assessment and 21 teachers wrote CA depends on exams and quizzes. In addition, 8
teachers said that CA should be summative. Interestingly, 8 teachers stated directly
that they have no idea and some of them wrote no comments as an explanation for
their understanding of the statement.
In this section, the researcher examines one of the elements of the formative
assessment that can be achieved by teachers when implementing the CA tools.
Therefore, the researcher included a second question in the questionnaire
investigating teachers' practice of the feedback element in their classrooms. The
purpose of this question is to investigate teachers’ knowledge and their practice of the
element of providing feedback to students. So, teachers were asked the following
open-ended question: “A significant element of CA tools is providing feedback to
help students improve their achievement. How do you see this happening in your
classroom?” The percentages of feedback element is shown in Table 4.26 below.
Table 4. 26: Percentages of teachers’ practice of the feedback element
Analysis Teachers who provide
feedback to students
Teachers who
don’t provide
feedback
Question left
unanswered
Frequency 214 127 9
Percentage 61.2% 36.2% 2.6%
According to table 4.26, analysis revealed that teachers' percentage of (61.2%)
provides feedback to students, while only (36.2%) of them do not provide feedback,
and only (2.6%) didn't respond to the question. Findings confirm teachers'
understanding of using the prescribed CA tools to practice the element of providing
feedback to students on their work. Teachers believe in the importance of feedback
for the learning process, but findings also indicated 127 teachers who don’t provide
feedback. So, it has become significant for teachers to explain their responses why it
is difficult to provide feedback.
In response to the research question, teachers provided lots of explanations about the
feedback element. The researcher analyzed and organized the responses into two
categories, responses about how teachers give feedback and responses about reasons
why teachers can't give feedback. The researcher collected teachers' explanations and
organized them in Table 4.267 below.
Table 4. 27: English teachers’ explanations about the feedback element of CA
Responses about teachers who provide feedback to students Frequency
Teachers give written feedback 68
Comments given on student’s writings 50
Comments given after a quiz 41
Give back papers to students to learn from their mistakes 39
Oral feedback 33
At the end of each activity/task 31
Individual feedback 21
Pronunciation correction when reading aloud 20
Immediate feedback 18
Whole class feedback 17
Total 297
Table 4.27 shows 297 responses were provided by English teachers regarding the
feedback practice. This big number of responses explained teachers care and interest
to provide feedback to their students. Teachers use several and various approaches
of providing feedback to their students. In fact, the largest group of 68 teachers, give
written feedback to their students while the lowest group of 17 teachers give whole
class feedback. The table also confirms the use of a variety of feedback forms where
50 teachers give lots of comments on students' writings and 41 teachers give
comments on students' performance after the quiz. In addition, 39 teachers mentioned
that they return papers to students in order to help them learn from their mistakes.
Moreover, 33 teachers give feedback orally, 21 teachers give it individually and 20
give feedback when speaking and reading to correct students pronunciation. Finally,
18 teachers said they give feedback immediately to students and 17 teachers give it as
a whole class feedback. This all indicates teachers appropriate practice of the element
of feedback when implementation the CA tools inside their classroom.
The element of feedback is not implemented by all teachers. Teachers are found to
have difficulties and reasons for this. These reasons are stated in Table 4.27.
Table 4.27: teachers responses about why they can't give feedback
Responses about teachers who don't provide feedback Frequency
No time to give feedback 56
Large class size 42
It depends on students' level 28
Students do not care about teachers' feedback 14
Feedback is not meaningful 12
Don't work with low achievers, work only with good students 9
Students don't learn from their mistakes 8
160
According to Table 4.27, although teachers believe in the importance of feedback
element, they wrote about the reasons which stop them from providing feedback to
their students. Teachers reasons can be classified into reasons of school context,
problems of CA tools and faults of students. For instance, 56 teachers mentioned that
they are not able to provide feedback to their students because they don't have enough
time in the classroom. The second reason mentioned by 42 teachers is the large class
size. Teachers found them unable to provide feedback because there are lots of
students in the classroom. Interestingly, teachers indicated some reasons related to
students themselves. 28 teachers said students' level does not help to provide feedback
and 14 teachers indicated that students don't care about teachers feedback. Thus, 8
teachers mentioned students do not learn from their mistakes and similarly they may
not benefit from the feedback. Moreover, teachers mentioned reasons about the CA
tools. 9 teachers reported that CA tools don't work with low achievers and only high
students' level can handle CA tools. This confirms that students' level is a difficulty
for teachers to implement the CA tools in order to achieve the formative purposes.
Finally,12 teachers find feedback is not meaningful for the improvement of students'
work. All these responses, shows teachers' retreatment from providing feedback to
their students.
4.4.1.4 Findings Regarding Fourth Research Question:
Q4: What are the factors influencing English teachers' adoption
(acceptance/rejection) of the prescribed CA tools?
In the questionnaire, teachers were asked a direct question to report the factors of
acceptance or rejection of the CA tools in their classrooms. Out of 350 teachers, only
11 teachers didn't respond to this question. Teachers' responses were collected and
analyzed by the researcher then listed in a descending order in table 4. 27 below.
Table 4. 27: The factors influencing English teachers' adoption of the prescribed
CA tools
Responses Frequency
Usefulness of the CA tools 88
Time required to finish the CA tools 67
Formality, if tools are formally implemented in the classroom 52
Easiness of implementation of tools 43
Validity, CA tools should be valid / should test what is required to be
tested
41
Accuracy, tools should be accurate, give the true/actual/ real level of
students
30
CA tools should match the final exam questions 26
The flexibility of implementation of CA tools so they are not
compulsory
20
Appropriateness for students' level 18
The amount of work required, tools should not be demanding 14
If tools are done by students themselves 13
Relevancy , tools should be relevant to the textbook 11
Should improve teachers' performance 9
Generally speaking, although the researcher investigates limited factors of teachers'
acceptance that are based on the theoretical framework, teachers' responses to the
question indicated thirteen different factors influencing their adoption of the
prescribed CA tools in their classrooms. According to table 4.27, these factors can be
categorized into two groups; factors related to the CA tools and factors related to tools
of implementation. Regarding the factors of the CA tools, teachers find usefulness (88
teachers), easiness (43 teachers), validity (41 teachers), accuracy (30 teachers),
relevancy to final exams (26 teachers) and appropriateness (18 teachers) to be
fundamental factors for them in order to accept using the CA tools in their
classrooms.
As for the ways of implementation, 67 teachers reported that time is a major factor to
adopt the CA tools. 14 teachers indicated that these tools are demanding and required
lots of work and effort and this can't be done unless there is plenty of time to finish
the CA tools. In addition, 52 teachers are against students' implementing the work of
CA tools at home. They emphasize that CA work should be done formally in the
school. Teachers think the work is not done by students themselves. Moreover, 20
teachers reported that they need freedom to choose from the CA tools according to
what they see appropriate and effective. The least mentioned factors reported by
teachers are tools relevancy to the text book (11 teachers) and tools should be useful
for teachers as well (9 teachers).
4.4.1 Qualitative data analysis of theme 2: Usefulness of CA tools
In this theme, the researcher discusses the findings about teachers' perception towards
the usefulness of CA tools, the most frequently used tools and the tools teachers find
easy and useful for learners’ assessment. So, the researcher utilized two instruments;
open-ended questions and classroom observation instrument. The findings of both
instruments are shown in the sections below.
4.4.2.1 Findings Regarding the Fifth Research Question
Q5: What are the perceptions of English teachers towards the usefulness of the
prescribed CA tools in PBE schools?
To answer the fifth question, teachers were asked to answer a direct open-ended
question which says "Prescribed CA tools are useful for developing learners and
CHAPTER FOUR DATA ANALYSIS AND RESULTS.pdf

More Related Content

Similar to CHAPTER FOUR DATA ANALYSIS AND RESULTS.pdf

ppt two.pptdddfdvserfvwerwerfgvwrtvfdvvfe
ppt two.pptdddfdvserfvwerwerfgvwrtvfdvvfeppt two.pptdddfdvserfvwerwerfgvwrtvfdvvfe
ppt two.pptdddfdvserfvwerwerfgvwrtvfdvvfeSirajudinAkmel1
 
DYNAMIC ASSESSMENT AND THE IRANIAN UNIVERSITY INSTRUCTORS’ CONCEPTUALIZATIONS...
DYNAMIC ASSESSMENT AND THE IRANIAN UNIVERSITY INSTRUCTORS’ CONCEPTUALIZATIONS...DYNAMIC ASSESSMENT AND THE IRANIAN UNIVERSITY INSTRUCTORS’ CONCEPTUALIZATIONS...
DYNAMIC ASSESSMENT AND THE IRANIAN UNIVERSITY INSTRUCTORS’ CONCEPTUALIZATIONS...International Scientific Events
 
MUHAMMAD AKBAR ZAHIDI - american journal education 2-10-2 copy
MUHAMMAD AKBAR ZAHIDI - american journal education 2-10-2 copyMUHAMMAD AKBAR ZAHIDI - american journal education 2-10-2 copy
MUHAMMAD AKBAR ZAHIDI - american journal education 2-10-2 copymuhammadakbarzahidi
 
Promoting Best Practices in Secondary Schools through Teacher Commitment
 Promoting Best Practices in Secondary Schools through Teacher Commitment Promoting Best Practices in Secondary Schools through Teacher Commitment
Promoting Best Practices in Secondary Schools through Teacher CommitmentResearch Journal of Education
 
Factors Affecting the Contribution of 1st Year Female Students Tutorial Class...
Factors Affecting the Contribution of 1st Year Female Students Tutorial Class...Factors Affecting the Contribution of 1st Year Female Students Tutorial Class...
Factors Affecting the Contribution of 1st Year Female Students Tutorial Class...CrimsonPublishers-SBB
 
Student Evaluations in Physics - A Study on Gender Bias at the University of ...
Student Evaluations in Physics - A Study on Gender Bias at the University of ...Student Evaluations in Physics - A Study on Gender Bias at the University of ...
Student Evaluations in Physics - A Study on Gender Bias at the University of ...Joshua Brothers
 
Thesis-presentation FACCTORS AFFECTING TEACHING PERFORMANCE.pptx
Thesis-presentation FACCTORS AFFECTING TEACHING PERFORMANCE.pptxThesis-presentation FACCTORS AFFECTING TEACHING PERFORMANCE.pptx
Thesis-presentation FACCTORS AFFECTING TEACHING PERFORMANCE.pptxMaryCresDegumaOtaza
 
Protocolo Presentation
Protocolo PresentationProtocolo Presentation
Protocolo PresentationAstrid Madera
 
HSTA September 2013 ees survey results 10-4-13
HSTA September 2013 ees survey results 10-4-13HSTA September 2013 ees survey results 10-4-13
HSTA September 2013 ees survey results 10-4-13oakparkrj
 
An Analysis Of Letter Writing Tasks From The English Portion Of Myanmar S Uni...
An Analysis Of Letter Writing Tasks From The English Portion Of Myanmar S Uni...An Analysis Of Letter Writing Tasks From The English Portion Of Myanmar S Uni...
An Analysis Of Letter Writing Tasks From The English Portion Of Myanmar S Uni...Christine Williams
 
Impact of a Public Examination Change on Teachers’ Perceptions and Attitudes ...
Impact of a Public Examination Change on Teachers’ Perceptions and Attitudes ...Impact of a Public Examination Change on Teachers’ Perceptions and Attitudes ...
Impact of a Public Examination Change on Teachers’ Perceptions and Attitudes ...iosrjce
 
Teaching Reading using ICT
Teaching Reading using ICTTeaching Reading using ICT
Teaching Reading using ICTWiwiekAfifah
 
Reasearch mapping
Reasearch mappingReasearch mapping
Reasearch mappingcaraganalyn
 
Reflecting on esl teacher beliefs and classroom practices a case study
Reflecting on esl teacher beliefs and classroom practices  a case studyReflecting on esl teacher beliefs and classroom practices  a case study
Reflecting on esl teacher beliefs and classroom practices a case studyNur Raieda Ainul Maslih
 
An Experimental Study of the Effects of Listening on Speaking for College Stu...
An Experimental Study of the Effects of Listening on Speaking for College Stu...An Experimental Study of the Effects of Listening on Speaking for College Stu...
An Experimental Study of the Effects of Listening on Speaking for College Stu...MxioMel Alt Alv
 

Similar to CHAPTER FOUR DATA ANALYSIS AND RESULTS.pdf (20)

Chapter 3
Chapter 3Chapter 3
Chapter 3
 
Timss 1
Timss 1Timss 1
Timss 1
 
ppt two.pptdddfdvserfvwerwerfgvwrtvfdvvfe
ppt two.pptdddfdvserfvwerwerfgvwrtvfdvvfeppt two.pptdddfdvserfvwerwerfgvwrtvfdvvfe
ppt two.pptdddfdvserfvwerwerfgvwrtvfdvvfe
 
DYNAMIC ASSESSMENT AND THE IRANIAN UNIVERSITY INSTRUCTORS’ CONCEPTUALIZATIONS...
DYNAMIC ASSESSMENT AND THE IRANIAN UNIVERSITY INSTRUCTORS’ CONCEPTUALIZATIONS...DYNAMIC ASSESSMENT AND THE IRANIAN UNIVERSITY INSTRUCTORS’ CONCEPTUALIZATIONS...
DYNAMIC ASSESSMENT AND THE IRANIAN UNIVERSITY INSTRUCTORS’ CONCEPTUALIZATIONS...
 
C322330.pdf
C322330.pdfC322330.pdf
C322330.pdf
 
C322330.pdf
C322330.pdfC322330.pdf
C322330.pdf
 
MUHAMMAD AKBAR ZAHIDI - american journal education 2-10-2 copy
MUHAMMAD AKBAR ZAHIDI - american journal education 2-10-2 copyMUHAMMAD AKBAR ZAHIDI - american journal education 2-10-2 copy
MUHAMMAD AKBAR ZAHIDI - american journal education 2-10-2 copy
 
Promoting Best Practices in Secondary Schools through Teacher Commitment
 Promoting Best Practices in Secondary Schools through Teacher Commitment Promoting Best Practices in Secondary Schools through Teacher Commitment
Promoting Best Practices in Secondary Schools through Teacher Commitment
 
Factors Affecting the Contribution of 1st Year Female Students Tutorial Class...
Factors Affecting the Contribution of 1st Year Female Students Tutorial Class...Factors Affecting the Contribution of 1st Year Female Students Tutorial Class...
Factors Affecting the Contribution of 1st Year Female Students Tutorial Class...
 
Student Evaluations in Physics - A Study on Gender Bias at the University of ...
Student Evaluations in Physics - A Study on Gender Bias at the University of ...Student Evaluations in Physics - A Study on Gender Bias at the University of ...
Student Evaluations in Physics - A Study on Gender Bias at the University of ...
 
Thesis-presentation FACCTORS AFFECTING TEACHING PERFORMANCE.pptx
Thesis-presentation FACCTORS AFFECTING TEACHING PERFORMANCE.pptxThesis-presentation FACCTORS AFFECTING TEACHING PERFORMANCE.pptx
Thesis-presentation FACCTORS AFFECTING TEACHING PERFORMANCE.pptx
 
Nambiar washback in press
Nambiar washback in pressNambiar washback in press
Nambiar washback in press
 
Protocolo Presentation
Protocolo PresentationProtocolo Presentation
Protocolo Presentation
 
HSTA September 2013 ees survey results 10-4-13
HSTA September 2013 ees survey results 10-4-13HSTA September 2013 ees survey results 10-4-13
HSTA September 2013 ees survey results 10-4-13
 
An Analysis Of Letter Writing Tasks From The English Portion Of Myanmar S Uni...
An Analysis Of Letter Writing Tasks From The English Portion Of Myanmar S Uni...An Analysis Of Letter Writing Tasks From The English Portion Of Myanmar S Uni...
An Analysis Of Letter Writing Tasks From The English Portion Of Myanmar S Uni...
 
Impact of a Public Examination Change on Teachers’ Perceptions and Attitudes ...
Impact of a Public Examination Change on Teachers’ Perceptions and Attitudes ...Impact of a Public Examination Change on Teachers’ Perceptions and Attitudes ...
Impact of a Public Examination Change on Teachers’ Perceptions and Attitudes ...
 
Teaching Reading using ICT
Teaching Reading using ICTTeaching Reading using ICT
Teaching Reading using ICT
 
Reasearch mapping
Reasearch mappingReasearch mapping
Reasearch mapping
 
Reflecting on esl teacher beliefs and classroom practices a case study
Reflecting on esl teacher beliefs and classroom practices  a case studyReflecting on esl teacher beliefs and classroom practices  a case study
Reflecting on esl teacher beliefs and classroom practices a case study
 
An Experimental Study of the Effects of Listening on Speaking for College Stu...
An Experimental Study of the Effects of Listening on Speaking for College Stu...An Experimental Study of the Effects of Listening on Speaking for College Stu...
An Experimental Study of the Effects of Listening on Speaking for College Stu...
 

Recently uploaded

皇冠体育- 皇冠体育官方网站- CROWN SPORTS| 立即访问【ac123.net】
皇冠体育- 皇冠体育官方网站- CROWN SPORTS| 立即访问【ac123.net】皇冠体育- 皇冠体育官方网站- CROWN SPORTS| 立即访问【ac123.net】
皇冠体育- 皇冠体育官方网站- CROWN SPORTS| 立即访问【ac123.net】larisashrestha558
 
135. Reviewer Certificate in Journal of Engineering
135. Reviewer Certificate in Journal of Engineering135. Reviewer Certificate in Journal of Engineering
135. Reviewer Certificate in Journal of EngineeringManu Mitra
 
Operating system. short answes and Interview questions .pdf
Operating system. short answes and Interview questions .pdfOperating system. short answes and Interview questions .pdf
Operating system. short answes and Interview questions .pdfharikrishnahari6276
 
134. Reviewer Certificate in Computer Science
134. Reviewer Certificate in Computer Science134. Reviewer Certificate in Computer Science
134. Reviewer Certificate in Computer ScienceManu Mitra
 
How to create an effective K-POC tutorial
How to create an effective K-POC tutorialHow to create an effective K-POC tutorial
How to create an effective K-POC tutorialvencislavkaaa
 
0524.priorspeakingengagementslist-01.pdf
0524.priorspeakingengagementslist-01.pdf0524.priorspeakingengagementslist-01.pdf
0524.priorspeakingengagementslist-01.pdfThomas GIRARD BDes
 
131. Reviewer Certificate in BP International
131. Reviewer Certificate in BP International131. Reviewer Certificate in BP International
131. Reviewer Certificate in BP InternationalManu Mitra
 
Chapters 3 Contracts.pptx Chapters 3 Contracts.pptx
Chapters 3  Contracts.pptx Chapters 3  Contracts.pptxChapters 3  Contracts.pptx Chapters 3  Contracts.pptx
Chapters 3 Contracts.pptx Chapters 3 Contracts.pptxSheldon Byron
 
129. Reviewer Certificate in BioNature [2024]
129. Reviewer Certificate in BioNature [2024]129. Reviewer Certificate in BioNature [2024]
129. Reviewer Certificate in BioNature [2024]Manu Mitra
 
Widal Agglutination Test: A rapid serological diagnosis of typhoid fever
Widal Agglutination Test: A rapid serological diagnosis of typhoid feverWidal Agglutination Test: A rapid serological diagnosis of typhoid fever
Widal Agglutination Test: A rapid serological diagnosis of typhoid fevertaexnic
 
欧洲杯投注网站-欧洲杯投注网站推荐-欧洲杯投注网站| 立即访问【ac123.net】
欧洲杯投注网站-欧洲杯投注网站推荐-欧洲杯投注网站| 立即访问【ac123.net】欧洲杯投注网站-欧洲杯投注网站推荐-欧洲杯投注网站| 立即访问【ac123.net】
欧洲杯投注网站-欧洲杯投注网站推荐-欧洲杯投注网站| 立即访问【ac123.net】foismail170
 
Transferable Skills - Your Roadmap - Part 1 and 2 - Dirk Spencer Senior Recru...
Transferable Skills - Your Roadmap - Part 1 and 2 - Dirk Spencer Senior Recru...Transferable Skills - Your Roadmap - Part 1 and 2 - Dirk Spencer Senior Recru...
Transferable Skills - Your Roadmap - Part 1 and 2 - Dirk Spencer Senior Recru...Dirk Spencer Corporate Recruiter LION
 
欧洲杯买球平台-欧洲杯买球平台推荐-欧洲杯买球平台| 立即访问【ac123.net】
欧洲杯买球平台-欧洲杯买球平台推荐-欧洲杯买球平台| 立即访问【ac123.net】欧洲杯买球平台-欧洲杯买球平台推荐-欧洲杯买球平台| 立即访问【ac123.net】
欧洲杯买球平台-欧洲杯买球平台推荐-欧洲杯买球平台| 立即访问【ac123.net】foismail170
 
132. Acta Scientific Pharmaceutical Sciences
132. Acta Scientific Pharmaceutical Sciences132. Acta Scientific Pharmaceutical Sciences
132. Acta Scientific Pharmaceutical SciencesManu Mitra
 
How to Master LinkedIn for Career and Business
How to Master LinkedIn for Career and BusinessHow to Master LinkedIn for Career and Business
How to Master LinkedIn for Career and Businessideatoipo
 
Luke Royak's Personal Brand Exploration!
Luke Royak's Personal Brand Exploration!Luke Royak's Personal Brand Exploration!
Luke Royak's Personal Brand Exploration!LukeRoyak
 
欧洲杯投注app-欧洲杯投注app推荐-欧洲杯投注app| 立即访问【ac123.net】
欧洲杯投注app-欧洲杯投注app推荐-欧洲杯投注app| 立即访问【ac123.net】欧洲杯投注app-欧洲杯投注app推荐-欧洲杯投注app| 立即访问【ac123.net】
欧洲杯投注app-欧洲杯投注app推荐-欧洲杯投注app| 立即访问【ac123.net】foismail170
 
Biography and career history of Chad Henson.pdf
Biography and career history of Chad Henson.pdfBiography and career history of Chad Henson.pdf
Biography and career history of Chad Henson.pdfChad Henson
 
Midterm Contract Law and Adminstration.pptx
Midterm Contract Law and Adminstration.pptxMidterm Contract Law and Adminstration.pptx
Midterm Contract Law and Adminstration.pptxSheldon Byron
 
太阳城娱乐-太阳城娱乐推荐-太阳城娱乐官方网站| 立即访问【ac123.net】
太阳城娱乐-太阳城娱乐推荐-太阳城娱乐官方网站| 立即访问【ac123.net】太阳城娱乐-太阳城娱乐推荐-太阳城娱乐官方网站| 立即访问【ac123.net】
太阳城娱乐-太阳城娱乐推荐-太阳城娱乐官方网站| 立即访问【ac123.net】foismail170
 

Recently uploaded (20)

皇冠体育- 皇冠体育官方网站- CROWN SPORTS| 立即访问【ac123.net】
皇冠体育- 皇冠体育官方网站- CROWN SPORTS| 立即访问【ac123.net】皇冠体育- 皇冠体育官方网站- CROWN SPORTS| 立即访问【ac123.net】
皇冠体育- 皇冠体育官方网站- CROWN SPORTS| 立即访问【ac123.net】
 
135. Reviewer Certificate in Journal of Engineering
135. Reviewer Certificate in Journal of Engineering135. Reviewer Certificate in Journal of Engineering
135. Reviewer Certificate in Journal of Engineering
 
Operating system. short answes and Interview questions .pdf
Operating system. short answes and Interview questions .pdfOperating system. short answes and Interview questions .pdf
Operating system. short answes and Interview questions .pdf
 
134. Reviewer Certificate in Computer Science
134. Reviewer Certificate in Computer Science134. Reviewer Certificate in Computer Science
134. Reviewer Certificate in Computer Science
 
How to create an effective K-POC tutorial
How to create an effective K-POC tutorialHow to create an effective K-POC tutorial
How to create an effective K-POC tutorial
 
0524.priorspeakingengagementslist-01.pdf
0524.priorspeakingengagementslist-01.pdf0524.priorspeakingengagementslist-01.pdf
0524.priorspeakingengagementslist-01.pdf
 
131. Reviewer Certificate in BP International
131. Reviewer Certificate in BP International131. Reviewer Certificate in BP International
131. Reviewer Certificate in BP International
 
Chapters 3 Contracts.pptx Chapters 3 Contracts.pptx
Chapters 3  Contracts.pptx Chapters 3  Contracts.pptxChapters 3  Contracts.pptx Chapters 3  Contracts.pptx
Chapters 3 Contracts.pptx Chapters 3 Contracts.pptx
 
129. Reviewer Certificate in BioNature [2024]
129. Reviewer Certificate in BioNature [2024]129. Reviewer Certificate in BioNature [2024]
129. Reviewer Certificate in BioNature [2024]
 
Widal Agglutination Test: A rapid serological diagnosis of typhoid fever
Widal Agglutination Test: A rapid serological diagnosis of typhoid feverWidal Agglutination Test: A rapid serological diagnosis of typhoid fever
Widal Agglutination Test: A rapid serological diagnosis of typhoid fever
 
欧洲杯投注网站-欧洲杯投注网站推荐-欧洲杯投注网站| 立即访问【ac123.net】
欧洲杯投注网站-欧洲杯投注网站推荐-欧洲杯投注网站| 立即访问【ac123.net】欧洲杯投注网站-欧洲杯投注网站推荐-欧洲杯投注网站| 立即访问【ac123.net】
欧洲杯投注网站-欧洲杯投注网站推荐-欧洲杯投注网站| 立即访问【ac123.net】
 
Transferable Skills - Your Roadmap - Part 1 and 2 - Dirk Spencer Senior Recru...
Transferable Skills - Your Roadmap - Part 1 and 2 - Dirk Spencer Senior Recru...Transferable Skills - Your Roadmap - Part 1 and 2 - Dirk Spencer Senior Recru...
Transferable Skills - Your Roadmap - Part 1 and 2 - Dirk Spencer Senior Recru...
 
欧洲杯买球平台-欧洲杯买球平台推荐-欧洲杯买球平台| 立即访问【ac123.net】
欧洲杯买球平台-欧洲杯买球平台推荐-欧洲杯买球平台| 立即访问【ac123.net】欧洲杯买球平台-欧洲杯买球平台推荐-欧洲杯买球平台| 立即访问【ac123.net】
欧洲杯买球平台-欧洲杯买球平台推荐-欧洲杯买球平台| 立即访问【ac123.net】
 
132. Acta Scientific Pharmaceutical Sciences
132. Acta Scientific Pharmaceutical Sciences132. Acta Scientific Pharmaceutical Sciences
132. Acta Scientific Pharmaceutical Sciences
 
How to Master LinkedIn for Career and Business
How to Master LinkedIn for Career and BusinessHow to Master LinkedIn for Career and Business
How to Master LinkedIn for Career and Business
 
Luke Royak's Personal Brand Exploration!
Luke Royak's Personal Brand Exploration!Luke Royak's Personal Brand Exploration!
Luke Royak's Personal Brand Exploration!
 
欧洲杯投注app-欧洲杯投注app推荐-欧洲杯投注app| 立即访问【ac123.net】
欧洲杯投注app-欧洲杯投注app推荐-欧洲杯投注app| 立即访问【ac123.net】欧洲杯投注app-欧洲杯投注app推荐-欧洲杯投注app| 立即访问【ac123.net】
欧洲杯投注app-欧洲杯投注app推荐-欧洲杯投注app| 立即访问【ac123.net】
 
Biography and career history of Chad Henson.pdf
Biography and career history of Chad Henson.pdfBiography and career history of Chad Henson.pdf
Biography and career history of Chad Henson.pdf
 
Midterm Contract Law and Adminstration.pptx
Midterm Contract Law and Adminstration.pptxMidterm Contract Law and Adminstration.pptx
Midterm Contract Law and Adminstration.pptx
 
太阳城娱乐-太阳城娱乐推荐-太阳城娱乐官方网站| 立即访问【ac123.net】
太阳城娱乐-太阳城娱乐推荐-太阳城娱乐官方网站| 立即访问【ac123.net】太阳城娱乐-太阳城娱乐推荐-太阳城娱乐官方网站| 立即访问【ac123.net】
太阳城娱乐-太阳城娱乐推荐-太阳城娱乐官方网站| 立即访问【ac123.net】
 

CHAPTER FOUR DATA ANALYSIS AND RESULTS.pdf

  • 1. CHAPTER FOUR: DATA ANALYSIS AND RESULTS 4.1 Introduction 4.2 Demographic Characteristics of study participants 4.2.1 Demographic characteristics of quantitative sample 4.2.2 Demographic characteristics of qualitative sample 4.3. Quantitative Data Analysis from Questionnaire 4.3.1. Quantitative Data Analysis of Theme 1. Implementation of CA tools 4.3.1.1.Results Regarding First Research Question: Teachers' perceptions 4.3.1.2. Results Regarding Second Research Question: Challenges of implementing CA tools 4.3.1.3. Results Regarding Third Research Question: Teachers' practice of CA tools 4.3.1.4. Results Regarding Forth Research Question: Factors of adopting CA tools (acceptance /rejection factors) 4.3.2 Qualitative Data Analysis of Theme 2. Usefulness of CA tools 4.3.2.1. Results Regarding Fifth Research Question: Teachers' perceptions 4.3.2.2. Results Regarding Sixth Research Question: Frequently used CA tools 4.3.2.3. Results s Regarding Seventh Research Question: Usefulness of CA tools 4.4. Qualitative Data Analysis form Open-ended Questions and Observations 4.4.1.Qualitative Data Analysis of Theme 1. Implementation of CA tools 4.4.1.1. Findings Regarding First Research Question: Teachers' perceptions 4.4.1.2. Findings Regarding Second Research Question: Challenges of implementing CA tools 4.4.1.3. Findings Regarding Third Research Question: Teachers' practice of CA tools 4.4.1.4. Findings Regarding Forth Research Question: Factors of adopting CA tools (acceptance /rejection factors) 4.4.2.Qualitative Data Analysis of Theme 2. Usefulness of CA tools 4.4.2.1. Findings Regarding Fifth Research Question: Teachers' perceptions 4.4.2.2. Findings Regarding Sixth Research Question: Frequently used CA tools 4.4.2.3. Findings Regarding Seventh Research Question: Usefulness of CA tools
  • 2. CHAPTER FOUR DATA ANALYISS OF FINDINGS AND RESULTS 4.1 Introduction In the previous chapter, the researcher discussed and explained the mixed approach used in this study to collect and analyze data. Accordingly, the current chapter presents the analysis of the quantitative data collected from the questionnaire applied to a sample of 350 English teachers in Post Basic Education (PBE) schools. In this chapter, the researcher also analyzed the qualitative data collected from the same 350 participants after responding to 8 open-ended questions and conducting 21 classroom observations. This analysis can lead to extract the required statistical and generate comprehensive and influential conclusions regarding English teachers' perception towards the implementation and usefulness of the prescribed CA tools in PBE schools in Batinah North Governorate in Oman. The chapter begins by describing the socio-demographic characteristics of the sample which responded to the questionnaire and discussing the results and findings regarding teachers' perception towards the implementation and usefulness of the prescribed CA tools, the challenges that teachers encounter in implementing the prescribed CA tools, the factors influencing English teachers' adoption (acceptance/rejection) of the prescribed CA tools and the major CA tools that teachers use more frequently to assess students’ learning in their classrooms. 4.2 Demographic characteristics of the study participants After the questionnaires were distributed and filled out by the 350 English teachers in Post Basic Education schools, a descriptive statistical analysis was performed by SPSS to determine the social and demographic characteristics of the sample members. The analysis of the demographic characteristics of the sample is important, because it helps in knowing the characteristics of the sample community and the nature of the characteristics of the people participating in the completion of the questionnaire, the extent of their experience and their connection with the subject, as well as identifying the personal differences between them and whether they affect the nature of the answers submitted by them or not (Dobronte, 2013). In this section, the researcher describes the socio-demographic characteristics of the quantitative and qualitative study participants. 4.2.1 Demographic characteristics of quantitative sample Having collected data from the instrument of the questionnaire, the researcher begins the analysis by categorizing the participants of the study and are presented in organized tables.
  • 3. Table 4. 1: Participants’ gender Gender Frequency Percent Valid Percent Cumulative Percent Valid Male 139 39.7 39.7 39.7 Female 211 60.3 60.3 100.0 Total 350 100.0 100.0 The sample of the study consists of both gender (males and females). As can be seen in table 4.1, the majority of the sample were female (60.3%), while the male category constitutes (39.7%) of the total sample. According to table 4.1, the number of female teachers is 211 teachers while male teachers are 139 . In fact, the slight increase in the number of female teachers is because of the demographics of the area as the number of female schools are more than male schools. Besides, the study sample is selected from a sample at which female schools are more than male schools. In addition, females are more inclined to practice the profession of teaching than males. This percentage gives an indication that the sample is representative of society and it takes into account the point of view of female and male teachers alike. Table 4. 2: Participants' teaching grades Gender * Grade of teacher Grades of English teachers Total 10 grade 11 grade 12 grade Gender Male 49 45 45 139 Female 61 70 80 211 Total 110 115 125 350 Percent 31.5 32.8 35.7 100 The table 4.2 describes the distribution of male and female English teachers according to the grades of 10, 11 and 12. According to table 4.2, the number of teachers teaching grades 10, 11 and 12 is almost close to each other. There are 110 English teachers teaching grade 10, 115 teachers teaching grade 11 and 125 teachers teaching grade 12. This can be explained by the fact that there is an interest on the part of all teachers in the different grades of PBE schools to participate in the study and learn about the implementation and usefulness of the prescribed CA tools in PBE schools, which gives the study the characteristic of comprehensiveness in collected viewpoints. In addition, the number of teachers of grades 11 and 12 represents (68.5) while the number of grade 10 teachers is (31.5). This is very helpful to get reliable responses from the study instruments as teachers of grades 11 and 12 are expected to have more knowledge and experience that can add valuable data to the study.
  • 4. Table 4.3: Participants’ job positions Gender * Job position Job position Total Teacher Senior Teacher Gender Male 111 28 139 Female 180 31 211 Total 291 59 350 Percent 83.1 16.9 100 In addition, with regard to job position, table 4.3 shows that the individuals participating in this questionnaire are distributed among two job titles, the largest percentage of them are teachers, who constituted (83.1%) of the sample, followed by English senior teachers with a percentage of (16.9%). As a number of 67 PBE schools have selected to choose the study sample from, it is expected that the number of English senior teachers will be less than the teachers. To illustrate, as seen in table 4.3, there are 59 senior teachers because not all schools have senior teachers. The schools that are in the mountainous areas where there are less than 3 teachers, they don't have a senior teacher. Consequently, out of the 67 schools of the study sample , 8 schools don't have senior teachers. The table also reveals that the number of male senior teachers is 28 and there are 31 female senior teachers. It is helpful to gather accurate data about teachers' perception towards the implementation and usefulness of CA tools especially when male and female senior teachers are involved in the study. In fact, this diversity in the participating job positions gives the results of the study a characteristic of quality and credibility. Table 4.4: Participants’ years of experience Years of experience Frequency Percent Valid Percent Cumulative Percent Valid 1-5 years 143 40.9 40.9 40.9 5-10 years 99 28.2 28.2 69.1 10 years or more 108 30.9 30.9 100.0 Total 350 100.0 100.0 Moreover, regarding years of experience, table 4.4 shows that the majority of participated teachers who have 1-5 years of experience represented (40.9%), followed by (28.2%) of teachers who have 5-10 years of experience, then (30.9%) for teachers with experience of 10 years or more. It is also clear from the table that the sample of the study includes vast majority of experienced teachers. The percentage representing the two groups of 5-10 and more than 10 years of experience is about (69.1%) compared to the percentage of less experienced teachers who are 1-5 years of experience. This indicates that the study sample consists of English teachers with valuable and long experiences, which can give the impression that teachers possess
  • 5. extensive knowledge in the field of study and that their answers will be representative and trustworthy. Table 4.5: Participants' gender years of experience Gender *years of experience years of experience Total 1-5 years 5-10 years 10 years or more Gender Male 54 45 40 139 Female 89 54 68 211 Total 143 99 108 350 Percent 40.9 28.2 30.9 100 Finally, according to table 4.5, although there is a big difference in the number of males and females of the study sample, there isn't a big difference in the years of experience among the three groups. To illustrate, the group of 1-5 years of experience represents (40.9%), group of 5-10 years of experience represents (28.2%) and the group of 10 years of experience and more represents (30.9%). This close percentages of teachers can provide worthy data and accurate responses from the data instruments. 4.2.2 Demographic characteristics of qualitative sample The qualitative data is collected based on two instruments; the open-ended questions which is part 4 of the questionnaire and the structured classroom observation instrument. The participants of the open-ended questions are 350 English teachers who are the same sample that responded to the close-ended questions of the questionnaire. The description of the 350 participants is summarized in table 4.15 below. Table 4. 6: Participants of the questionnaire tool (open-ended questions) English teachers Grades Total Grade 10 Grade 11 Grade 12 Gender Male 49 45 45 139 Female 61 70 80 211 Total 110 115 125 350 % 31.5 32.8 35.7 100
  • 6. Table 4. 6 shows the participants of the study who responded to the whole questionnaire including both close-ended and the open-ended questions. According to the table, there are 350 English teachers who answered the seven open-ended questions. There are 139 male and 211 female teachers. All are teaching grades 10, 11 and 12 in post basic education schools. However, the table indicates that there are 110 English teachers of grade 10, 115 teachers of grade 11 and 125 teachers of grade 12. It can be noticed that the number of teachers involved in the study has fair selection from the three different grades and this can be very beneficial to provide different and valuable point of views with regards to the research questions. According to the table, there are 240 teachers of grades 11 and 12. This is valuable to the study as this number of participants are selected on purpose to teach grades 11 and 12. These teachers have long teaching experience and more knowledge and skills so they can enrich the data collected about the study problem. As for the participants of the classroom observation, the researcher visited a total of 21 English teachers in grades 10, 11 and 12 as explained in Table 4. 16 below. Table 4. 7: Participants of the classroom observation tool Grade 10 Grade 11 Grade 12 Total Male Female Male Female Male Female Teacher 2 3 2 3 2 3 15 Sen. T 1 1 1 1 1 1 6 Total 3 4 3 4 3 4 21 7 7 7 According to table 4.7, the researcher visited 21 English teachers. He conducted seven observations for each level grade of grades 10, 11 and 12. The table shows that not only teachers were visited but the English senior teachers were visited to investigate their practices of the CA tools in their classrooms. So, 15 teachers and 6 senior teachers were visited and data collected from their lessons using the structured observation form. Conducting observations, especially, for senior teachers' classrooms can reflect valuable data and add validity to the findings of the study because they have longer teaching experiences and a variety of knowledge and skills that can provide realistic data. Data analysis has a huge role to play in any research. It is a significant method which a researcher uses to study and analyze huge amounts of data. Therefore, the researcher analyzes the data collected in various techniques and formats. In fact, the significance of data analysis lies in cleaning and transforming all the data into a consistent form in order to study the data effectively. When analyzing the data, the researcher has the chance to clean the data and only analyze the accurate and useful information. Data analysis can also help the researcher to make the appropriate decision about the study problem and this can be based on facts and not on anticipations. The researcher, in
  • 7. this study, puts such considerations in his mind and conducted in-depth analysis of data collected as this stage can lead to discoveries, understanding and improve decision making process. The next sections demonstrate the quantitative results and the qualitative findings of all research questions. It begins by presenting the quantitative results of the four questions regarding the first theme which is implementation of the prescribed CA tools. It discusses English teachers' perceptions towards the CA tools, the challenges of implementation, teachers' practices of the tools and the factors influencing teachers' adoption of the prescribed CA tools. Then, it also presents the quantitative results of the remaining three questions regarding the second theme which is the usefulness of the CA tools. It presents results about teachers' perceptions towards the usefulness of the CA tools, the tools used more frequently by teachers and the tools teachers find easy and useful for learners' assessment. 4.3 Quantitative Data Analysis from the questionnaire In order to quantitatively identify the perception of English teachers towards the implementation and usefulness of the prescribed CA tools, the analysis of the questionnaire questions was divided into two main themes; tools implementation and tools usefulness. In the binging, the statements of the questionnaire were categorized according to the major research questions. For instance, items related to the first questions were identified and listed in a separate table. Similarly, statements of all questions were collected and organized in tables. The software SPSS was utilized to administer the descriptive analysis of frequencies. Frequencies of all close-ended statements were calculated and percentages were also added to the tables. In every quantitative descriptive analysis, there must be a measure of central tendency and a measure of variance to describe results appropriately. Accordingly, the researcher used the arithmetic mean to measure the central tendency of the respondents’ answers and describe the degree of their agreement on the statements, and the standard deviation was used for being the most widely used measure of variance to determine the average variance in a set of data and to provide insight into the difference between a value in a data set and the mean value of the same data set. The variance reflects the degree of prevalence and the extent to which the respondents’ opinions differ from their arithmetic mean. A low standard deviation indicates that the data are clustered around the mean, and a high standard deviation indicates a greater spread of the data. Therefore, in our study, the researcher found that the standard deviation values are low, which indicates that the opinions and perceptions of the respondents were in agreement, and there was no significant difference or variation in their perceptions towards CA. The descriptive statistics (means and standard deviations) of the responses and their ranks, which were elicited using a six-point Likert scale were calculated via SPSS,
  • 8. table 4.8 below shows the evaluation criteria for measuring attitudes level based on the mean. Table 4.8: Evaluation criteria for measuring attitudes' level Evaluation criteria used for measuring attitudes' levels Likert Scale Means Decision Strongly disagree 1.00 - 1.83 Very low Disagree 1.84 - 267 Low Slightly disagree 2.68 - 3.51 Slightly Low slightly agree 3.52 - 4.35 Slightly High Agree 4.36 - 5.19 High Strongly agree 5.20 - 6.00 Very high The previous table 4.8 depicts the evaluation criteria that were used to determine the level of agreement for each statement and question. The questionnaire responses were ranged using six Likert scale (strongly disagree = 1, disagree = 2, Slightly disagree = 3, Slightly agree = 4, Agree = 5 and Strongly agree = 6) evaluation criteria for judging the level of respondents' scores (respondents' attitudes levels). 1. Results of Theme 1. Implementation of CA tools 1.1 Results regarding first research question: Question1. What are the perceptions of English teachers toward the implementation of the prescribed CA tools in PBE schools in Batinah North Governorate? Table 4. 9: English teachers' perceptions toward the implementation of the prescribed CA tools in PBE schools No Statement N Strongly disagree Disagree Slightly disagree slightly agree Agree Strongly agree Mean Std. Deviation Decision % % % % % % 1 2 3 4 5 6 1 CA tools make my students work harder. 350 0 0.9 5.4 20.0 41.1 32.6 4.99 0.91 High
  • 9. 2 Listening skill should be assessed as a part of the CA. 350 0 2.3 10.9 19.7 35.1 32.0 4.84 1.07 High 3 CA tools focus on quantity of papers not quality of students works. 350 1.1 3.7 14.3 22.9 32.6 25.4 4.58 1.18 High 4 I need a variety of CA tools to assess me students. 350 0.3 4.0 11.1 27.4 39.7 17.4 4.55 1.05 High 5 CA tools help students getting high CA marks easily. 350 2.0 11.7 26.9 24.3 21.7 13.4 3.92 1.29 Slightly High 6 I am happy about the quality of the CA work. 350 14. 3 40.3 34.3 5.1 3.4 2.6 2.51 1.08 Slightly Low 7 CA tools support the types of final exam questions. 350 23. 4 36.6 29.4 4.9 3.1 2.6 2.35 1.14 Low All Questions 5.9 14.2 18.9 17.8 25.2 18.0 3.96 1.10 Slightly High Table 4.9, delivers series of 7 items with respect to English teachers' perception toward the implementation of the prescribed CA tools. According to table 4.9, teachers' perception towards the CA tools is regarded slightly high as it scored a mean value of (3.96). Generally speaking, teachers have negative perception towards the implementation of the CA tools. Teachers' negative perception is stressed through statements 2, 3, 5, 6 and 7. According to statement 2, teachers believe that the CA tools need to focus on evaluating students on the four major language skills. When implementing the CA tools, teachers find that there is no CA tool assessing students' listening skill among the seven CA tools. This item received a mean of (4.84) which is very high and it indicates that teachers want CA tools to assess the listening skill. Implementation of CA tools revealed poor quality of CA work because teachers were not convinced by the process of implementing the CA tools in their schools. Thus, teachers' perception about the quality of CA tools is expressed in statements 3 and 6. In item 3, teachers showed a high mean score (4.58) which indicates that CA tools focus on collecting a big number of quantity of papers rather than taking care of quality of work when implementing the CA tools in the classrooms.
  • 10. Item 6 also supported this perception, it showed that teachers are not happy about the quality of the CA work, so it scored a low mean (2.35) which means teachers are against this item. Finally, teachers' implementation of the CA tools should be supportive to the types of the final examinations. However, item 7 shows that after implementing the CA tools, teachers find these tools do not support the types of final exam questions. It scored a low mean (2.35) indicating teachers' disagreement to this statement and, of course, emphasizes the negative perception toward the implementation of the prescribed CA tools. However, findings reveal that implementation of CA tools indicate positive teachers' perception, but it is emphasized through two items only. According to statements 1, 84.5% of teachers found that CA tools make their students work harder and this is supported by the highest mean value of (4.99). Besides, 93.7% of teachers agreed on their need for a variety of CA tools to assess their students in statement 4 and this finding is supported by a high mean score which is (4.55). 1.2 Results regarding second research question: Question2. What are the challenges that teachers encounter in implementing the prescribed CA tools? Table 4. 10: Challenges that teachers encounter in implementing the prescribed CA tools No Statement No Strongly disagree Disagree Slightly disagree slightly agree Agree Strongly agree Mean Std. Deviation Decision % % % % % % 1 2 3 4 5 6 1 The university course of evaluation and assessment provides me with the skills/knowledge of assessment. 350 0.0 0.9 3.4 24.6 44.0 27.1 4.9 3 0.85 4 High 2 I have to modify tasks/activities of the textbook to fit in with the CA tools. 350 0.0 0.3 4.3 28.0 42.9 24.6 4.8 7 0.84 2 High 3 I feel burdened by the amount of CA tools 350 0.3 5.1 5.1 19.7 44.0 25.7 4.7 9 1.06 2 High 4 A training workshop is given for me about the 350 1.1 1.4 9.1 22.6 42.9 22.9 4.7 3 1.03 1 High
  • 11. implementation of CA tools. 5 I have enough knowledge and skills for implementing the CA tools. 350 0.0 2.3 9.1 35.1 27.7 25.7 4.6 5 1.03 1 High 6 Students’ writings can be finished with students in the classroom. 350 0.3 1.1 17.4 32.6 32.6 16.0 4.4 4 1.01 0 High 7 I have sufficient time to develop the CA tools I use to assess my students. 350 0.3 5.7 11.1 36.6 26.9 19.4 4.4 2 1.11 2 High 8 Training given to teachers help teachers acquire the required CA skills. 350 0.0 10.9 18.6 31.1 32.6 6.9 4.0 6 1.10 4 Slightly High 9 Implementing CA tools affects teachers’ teaching time. 350 10.6 36.6 34.0 6.6 6.6 5.7 2.7 9 1.26 2 Slightly Low 10 Textbooks have enough tasks to practice the different CA tools. 350 17.4 33.1 28.6 7.4 13.1 0.3 2.6 7 1.24 4 Low 11 Teachers are provided with supportive resources to apply CA tools. 350 16.3 30.0 36.0 11.4 5.4 0.9 2.6 2 1.10 5 Low 12 All CA tools are suitable for students' level of English. 350 17.1 31.7 36.3 5.7 8.3 0.9 2.5 9 1.14 1 Low 13 Textbooks can be finished within the proposed semester time. 350 17.7 30.6 37.7 7.7 5.1 1.1 2.5 5 1.09 8 Low 14 The number of students in classroom is appropriate for doing the CA tools. 350 26.9 37.4 27.7 4.3 2.9 0.9 2.2 1 1.03 4 Low All Questions 7.7 16.2 19.9 19.5 23.9 12.7 3.7 4 0.99 2 Slightly High
  • 12. Table 4.10 shows the challenges English teachers face when implementing the prescribed CA tools. The 14 items in this section investigate seven challenges and each challenge is represented by a number of statements to gather accurate data from the participants. These challenges are teachers' skills and knowledge of CA, training, time, textbook, large class size, resources and load of CA. According to Table 4.10, results of statements 1 and 5 indicate that teachers do not consider their skills and knowledge of the CA as a challenge. The first item received the highest mean score (4.93) indicating that teachers have assessment skills and knowledge from the university course. This is confirmed by teachers' agreement to item 5 which received a high mean score too (4.65) and it states I have enough knowledge and skills for implementing the CA tools. In addition, results of statements 4 and 8 revealed that teachers do not consider training as a challenge as well. Statement 4 received a mean score of (4.73) and is considered high indicating teachers' agreement to this statement. In other words, teachers received training workshops on implementing the CA tools. Besides, statement 8 received a mean score of (4.06) and is regarded slightly high. This statement indicates teachers' agreement on the statement that training helps in acquiring the required skills for implementing the CA tools. Moreover, results of items 7 and 9 indicate that time is not a big challenge for teachers when implementing the CA tools, especiall y for preparation work of CA tools. Item 7 received a high mean score (4.42) indicating that teachers have sufficient time to develop the CA tools and item 9 received a slightly high mean score (2.76) indicating that implementing the CA tools does not affect teachers teaching time. Interestingly, item 6 supports that time is not a challenge for English teachers. Results of item 6 indicated that teachers are able to finish the writing tasks in the classroom as part of students' written work tool. To conclude, English teachers in PBE schools do not consider their skills and knowledge of CA, time and training as challenges when implementing the prescribed CA tools. On the contrary, results of other items revealed that teachers have encountered some challenges when implementing the CA tools. These challenges are heavy textbook, load of CA work, lack of resources and large class size. The first big challenge teachers face is the heavy textbook. To illustrate, item 2 received the second highest mean score (4.87) at which teachers agreed that they have to modify tasks and activities of the textbook to fit in with CA tools. This item indicates that the English textbook represents a challenge for teachers as it lacks CA tasks and activities. This is fostered by teachers' disagreement to item 10 which says "textbooks have enough tasks to practice the different CA tools" as it received a low score mean (2.67). This is also supported by item 13 at which teachers disagreed to the statement of " textbook can be finished with the proposed semester time", These 3 items, (2, 10 and 13) emphasize that textbook is a big challenge for teachers.
  • 13. Then according to table 4.10, item 3 received the third highest mean score which is (4.79). This, to a very big extent, indicates that the heavy load of CA tools work represents the second big challenge for teachers. In addition, lack of resources in PBE school is considered as one more challenge. This is indicated by the results of item 11 as it received a low mean score of (2.62) showing teachers' disagreement to the statement. . Moreover, item 12 indicates the level of difficulty of the CA tools as they are not suitable for students' level of English. This is a challenge that teachers have encountered when implementing the CA tools. It is not only the students' level, but results of statement 14 reveals that teachers have a challenge with the big number of students in the classroom. In fact, teachers disagreed on the statement "the number of students in classroom is appropriate for doing the CA tools". Thus, the large class size is found a challenge for teachers. 92% of teachers disagreed to this statement. In a conclusion, results indicated that teachers consider heavy textbook, time required to finish the textbook, large class size, students' level of English, workload of CA and lack of resources are the major challenges teachers' face when implementing the CA tools in their PBE school. 1.3 Results regarding third research question: Question3. How do English teachers practice the prescribed CA tools in PBE schools? There is a need to investigate how teachers practice the various CA tools in their classrooms and what teachers' understand about implementing CA tools to achieve the informative purposes of assessment. Therefore, the results of this question is divided into two parts. These two parts are explained in this section. Part one: Teachers' practices of CA tools 4.11: English teachers practices of the prescribed CA tools in PBE schools N o. Statement N Strongly disagree Disagree Slightly disagree slightly agree Agree Strongly agree Mean Std. Deviation Decision % % % % % % 1 2 3 4 5 6 1 I award the final mark of CA based on some of CA tools. 350 0.0 0.6 5.7 34.0 38.0 21.7 4.75 0.88 0 High 2 I implement the CA tools because this is part of my work. 350 0.3 1.7 11.1 27.1 34.3 25.4 4.70 1.04 1 High
  • 14. 3 I check students’ work after feedback is given. 350 3.1 5.1 10.3 17.7 33.7 30.0 4.64 1.31 4 High 4 I select the useful and effective CA tools for my students. 350 2.0 6.0 12.3 21.7 23.1 34.9 4.63 1.33 5 High 5 If my students get low marks, I repeat the quiz. 350 2.3 7.7 12.6 29.1 30.3 18.0 4.31 1.25 2 Slightl y High 6 A quiz takes the whole lesson to be finished. 350 3.7 8.0 14.9 24.3 28.3 20.9 4.28 1.35 9 Slightl y High 7 I assess students writing skill based on work done at home. 350 3.1 14. 0 22.3 21.7 19.4 19.4 3.99 1.42 9 Slightl y High 8 I allow some students to read the presentation, especially low achievers. 350 2.9 15. 4 25.1 18.9 16.9 20.9 3.94 1.46 0 Slightl y High 9 I accept students’ written work although they do not written/done it. 350 4.6 19. 4 31.7 19.1 16.9 8.3 3.49 1.32 4 Slightl y Low 10 I apply all the CA tools because they are effective in improving students’ achievement. 350 7.1 32. 6 27.1 17.4 7.7 8.0 3.10 1.34 5 Slightl y Low 11 I finish students’ presentations in one week. 350 9.1 33. 1 31.5 9.1 7.1 10.0 3.02 1.40 7 Slightl y Low All Questions 3.5 13. 1 18.6 21.8 23.2 19.8 4.08 1.23 0 Slightl y High Table 4.11 discusses a series of 11 statements with respect to English teachers' practice of the prescribed CA tools in their schools. The overall score mean is slightly high (4.08) and it indicates good practices of the CA tools by English teachers. However, the table highlights teachers' general practices and specific practices of some CA tools. Generally speaking, items 1, 2, 3, 4 and 10 describe English teachers' general practice of the CA tools in their classrooms. Teachers are found not infavor of implementing all the seven CA tools, but they tend to select from these tools to evaluate their students. To begin, item 1 which received the highest mean score (4.75) shows that teachers award the final mark of CA based on some of the CA tools. This reflects teachers' intention to use some of the seven CA tools. This is supported by item 4 as
  • 15. 79.7% of teachers agreed to the statement "I select the useful and effective tools for my students". Item 2 has the second highest mean score (4.70) emphasizing that teachers implement the CA tools only because it is as part of their work. This also reveals teachers' motive to implement some of the tools. The motive seems that they have to do it as part of their work regardless their acceptance or attitude. In addition, teachers' practice of CA tools is connected to the feedback element. Teachers consider feedback as an important element when implementing the CA tools. Thus, item 3 scored the third highest mean score (4.64) indicating that teachers give feedback to their students on the CA work as part of their practice and they check students' work based on feedback given. Finally, in item 10 which says "I apply all the CA tools because they are effective in improving students' achievement", 66.8% of teachers disagreed to the use of all CA tools when evaluating students, meaning that they select some of these tools and this supports items 1 and 4 discussed earlier. Regarding teachers' practice of some of the CA tools, the remaining six items discuss the practice of three different tools which are quizzes, students' written work and presentations. Items 5 and 6 discuss teachers' practice of the quiz tool. Statement 5 scored a mean of (4.31) and it is considered slightly high. This indicates that teachers' consider the quiz tool as a significant one for learners' assessment. However, results of the two statements revealed wrong practices of this tool. Item 5 scored a high mean score (4.31) indicating that teachers repeat the quiz if their students get low marks and this contradicts the regulations provided in the Students' Assessment Handbook (SAH), from the Ministry of Education. Besides, item 6 which scored a slightly high mean score (4.28) shows that teachers conduct a quiz for the whole lesson while the SAH directs teachers to make the quiz as part of their normal daily lesson. Although teachers practice the quiz tool, it seems they are not careful about following the regulations of tools implementation. Moreover, items 7 and 9 describe teachers' practice of students' written work tool. Item 7 indicates that teachers assess students' writing skill based on work done at home. This item scored a slightly high mean score (3.99), but teachers are asked to implement this tool in the classroom too, not only depending on work done at home. Item 9 reveals teachers' disagreement on the statement " I accept students' written work although they do not write it". 55.7% of teachers disagreed to this statement and this shows good practice of this tool. Teachers are advised to do so and not to accept any work which is not done by the student himself. On the contrary, very few teachers agreed to do this practice indicating that they practice this tool inappropriately. Furthermore, items 8 and 11 describe teachers' practice of the presentation tool. According to the results of table 4.11, teachers are found to practice this tool in their classrooms. To illustrate, item 8 received a slightly high mean score (3.94) indicating that more teachers allow students to read the presentation in front of the class, especially low achievers. 56.7% of teachers agreed to let students read their presentation although it is an inappropriate practice of this tool. on the contrary, item
  • 16. 11 indicates teachers' appropriate practice of this tool. 73.7% of teachers disagreed to the practice of finishing students' presentation in one week. Teachers are advised to distribute presentation through the whole semester and this is the appropriate practice of this tool. However, 26.3% of teachers agreed on this statement indicating their wrong practice of implementing the presentation tool and finish all students in one week. In a conclusion, teachers' general practice of CA tools shows their tendency to choose from the CA tools instead of implementing them all. Their practice also of some CA tools fluctuates between effective and suitable practice to inaccurate and inappropriate practice. Results revealed some of teachers' wrong practices in tools like presentations and quizzes. Part two: Teachers' understanding of implementing CA tools to achieve formative purposes of assessment 4.12: English teachers' understanding of implementing CA tools to achieve formative purposes of assessment N o. Statement N Strongly disagree Disagree Slightly disagree slightly agree Agree Strongly agree Mean Std. Deviation Decision % % % % % % 1 2 3 4 5 6 1 I give students opportunity to be involved in learning process when implementing CA tools. 350 2.6 6.6 9.1 36.0 21.7 24.0 4.40 1.26 9 High 2 I give feedback to students on their work of CA to improve it. 350 0.9 11.1 8.6 33.1 21.7 24.6 4.37 1.29 4 High 3 CA in my school supports assessment for learning 350 0.3 10.0 21. 1 14.9 33.4 20.3 4.32 1.29 8 Sligh tly High 4 CA is formative assessment by nature. 350 3.7 6.0 23. 4 21.7 32.3 12.9 4.11 1.28 0 Sligh tly High 5 I make students feel motivated and engaged when applying CA tools. 350 2.6 14.9 23. 1 20.3 14.0 25.1 4.04 1.48 6 Sligh tly High
  • 17. All Questions 2.0 9.7 17. 1 25.2 24.6 21.4 4.25 1.32 5 Sligh tly High Table 4.12 has 5 statements prepared to examine teachers' understanding of the formative purposes of assessment when teachers implement the prescribed CA tool in their classrooms. One significant purpose for introducing the CA tools in PBE schools is to improve the learning process through achieving formative purposes of assessment where teachers collect data about their students in order to improve the learning process. Teachers are directed when implementing the CA tools to engage their students in the learning process and to give them feedback on their work. Teachers are also advised to make beneficial use of information or data gathered from assessment. According to table 4.12, all items scored a slightly high mean score which is (4.25) indicating that teachers have good understanding of the formative purposes behind the implementation of the CA tools. As shown in item 1, it received the highest mean score (4.40) indicating teachers' understanding of the element of students' involvement in the learning process when implementing the CA tools. Item 5 supported this understanding when it received a slightly high score mean of (4.04) indicating teachers' agreement on the statement "I make students feel motivated and engaged when applying the CA tools". Teachers valued learners' engagement as a significant element of formative assessment. Then, item 2 scored the second highest mean value (4.37) indicating 79.4% of teachers' who agreed on the practice of giving feedback to students on their work. This findings also revealed that teachers valued the element of feedback. In addition, 68.6% of teachers agreed to item 3 "CA in my school supports assessment for learning" and it supported by a slightly high mean score which is (4.32). When teachers practice CA to achieve the purpose of assessment for learning, purposes of formative assessment can be achieved. Finally, 66.9% of teachers agreed to item 4 which says "CA is formative assessment by nature" as it indicated teachers' understanding of implementing the CA tools in order to achieve elements of formative assessment. This understanding is fostered by the most findings of the items involved in this part of the questionnaire. 1.4 Results regarding fourth research question: Question4. What are the factors influencing English teachers’ adoption (acceptance/rejection) of the prescribed CA tools? Teachers' acceptance of tools adoption in their classrooms is investigated by 5 statements as in Table 4.13. The researcher states these factors based on the theoretical framework which discusses the theories and models of individuals' acceptance behavior. The factors being investigated in this section are usefulness of
  • 18. CA tools, teachers' support, teachers' abilities and attitudes and the easiness of CA tools. Table 4. 13: Factors influencing English teachers’ adoption (acceptance/rejection) of the prescribed CA tools N o. Statement N Strongly disagree Disagree Slightly disagree slightly agree Agree Strongly agree Mean Std. Deviation Decision % % % % % % 1 2 3 4 5 6 1 Teachers’ acceptance of CA tools is based on their usefulness for students. 353 0.0 0.9 2.3 24. 0 34. 0 38. 9 5.0 8 0.89 1 High 2 In PBE schools, teachers are supported by supervisors and seniors when implementing CA tools. 353 0.6 4.3 7.7 16. 3 34. 9 36. 3 4.8 9 1.14 2 High 3 Teachers find themselves being able to implement the CA tools. 353 1.1 4.6 12. 6 17. 7 31. 1 32. 9 4.7 2 1.23 6 High 4 Teacher’s attitude is significant to motivate adoption of the CA tools in classroom. 353 1.1 2.6 7.4 32. 0 36. 0 20. 9 4.6 2 1.04 7 High 5 CA tools are easy to be implemented by teachers in their classroom. 353 3.4 6.3 18. 0 20. 0 28. 6 23. 7 4.3 5 1.36 2 Slightly High 6 CA tools are useful to develop students’ learning and progress. 353 1.7 14. 6 18. 3 24. 3 26. 3 14. 9 4.0 3 1.33 5 Slightly High All Questions 1.3 5.6 11. 1 22. 4 31. 8 27. 9 4.6 2 1.16 9 High According to table 4.13, the series of the 6 items scored a mean of (4.62) which is very high. This indicates that English teachers highly valued the factors influencing the adoption of the CA tools in their classrooms. The first statement which indicates
  • 19. that teachers' acceptance of CA tools is based on their usefulness for students scored the highest mean which is (5.08). 94.3% of teachers agreed to this item confirming that usefulness of CA tools is a very significant factor for teachers' adoption of CA tools. This factor is supported by the results of item 6 which states "CA tools are useful to develop students' learning and progress". It scored a slightly high mean (4.03) which indicates teachers' strong belief in this factor in order to make them adopt the CA tools in their classrooms. In fact, 65.5% of teachers agreed to this item. The next three items scored high means ranging from 4.89 to 4.62 and they refer to other significant factors about teachers' acceptance of CA tools which are support, teachers' abilities and attitudes. Item 2 received the second highest mean score which is (4.89). Teachers confirmed their necessity to be supported by supervisors and senior teachers when implementing the CA tools. In addition, item 3 indicates teachers' aptitude and trust in themselves being able to implement the CA tools in PBE schools. Results shows a high mean value of (4.72) scored by this statement. Similar to this item, item 4 received a high mean value (4.62) indicating teachers' belief in attitudes as one factor that can influence their acceptance behaviour towards the adoption of the CA tools in their classrooms. So, if teachers maintain positive attitude towards the CA tools, they will probably accept to adopt and implement CA tools in their classrooms. Finally, item 5 examines the factor of easiness of tools implementation. This item scored a mean of (4.35) which is slightly high. It indicates that CA tools have to be easy for teachers when implementing them in their classrooms. Teachers don't want complexity and difficulty in CA tools. Overall, items about the various factors influencing teachers' acceptance reveal their significant agreement to these factors in order to adopt these prescribed CA tools in their classrooms. 4.2 Results of Theme 2: usefulness of CA tools 4.2.1 Results regarding fifth research question: Question5. What are the perceptions of English teachers towards the usefulness of the prescribed CA tools in PBE schools? Table 4. 14: Descriptive summary for the perceptions of English teachers towards the usefulness of the prescribed CA tools in PBE schools No . Statement N Strongly disagree Disagree Slightly disagree slightly agree Agree Strongly agree Mean Std. Deviation Decision % % % % % % 1 2 3 4 5 6 1 Implementing CA tools 350 1.1 2.6 12. 6 34. 6 34. 3 14. 9 4.4 3 1.0 43 High
  • 20. promotes students’ engagement in learning. 2 CA tools help teachers to evaluate students’ level of English effectively. 350 7.1 32. 0 31. 1 11. 1 12. 3 6.3 3.0 8 1.3 31 Slightly Low 3 CA tools are useful to determine students’ strengths and weaknesses. 350 12. 0 31. 1 31. 4 16. 6 2.6 6.3 2.8 5 1.2 68 Slightly Low 4 CA tools stimulate students’ skills of critical thinking, problem solving and decision making. 350 10. 6 34. 0 30. 3 19. 4 4.3 1.4 2.7 7 1.0 99 Slightly Low 5 CA tools provide chances for giving feedback to improve students’ performance. 350 12. 3 30. 9 41. 7 8.0 3.7 3.4 2.7 0 1.1 19 Slightly Low All Questions 8.6 26. 1 29. 4 17. 9 11. 4 6.5 3.1 7 1.1 72 Slightly Low Table 4.14 delivers a series of 5 items with respect to English teachers' perceptions toward the usefulness of CA tools. The overall mean of the 5 items is (3.17) which is slightly low. This mean value indicates that teachers disagreed to the statements and emphasized their negative perception towards the usefulness of CA tools Although the first item scored the highest mean value, all the remaining 4 items scored slightly low means ranging from (3.08 to 2.70) which, to a very big extent, reflect teachers' disagreement to all these statements. For instance, statement 2 stating "CA tools help teachers to evaluate students' level of English effectively" received a slightly low mean (3.08). Teachers' disagreement to this statement shows that CA tools do not give students' actual level of English and this what makes teachers trustless in these tools. In addition, statement 3 stating "CA are useful tools to determine students' strengths and weaknesses" received slightly low mean too which
  • 21. is (2.85). 74.5% of teachers found the CA tools to be not helpful to identify students' strengths and recognize areas to be improved in students' learning. Moreover, statement 4 which states "CA tools stimulate students' thinking skills of critical thinking, problem solving and decision making" received a slightly mean score (2.70). In fact, 74.9% of teachers found that CA tools do not support future skills. Nowadays, learning is targeted towards achieving these 21st century skills. and teachers find these tools unable to achieve such skills. Moreover, statement 5 which indicates that CA tools provide chances for giving feedback to improve students' performance scored a slightly low mean value (2.70). 84.9% of teachers disagreed to this statement and results confirms teachers' inability to provide their students with the necessary feedback to improve their work. Thus, teachers find the CA tools less useful to improve the learning process. Finally, teachers' positive perception is stated only in item 1. The first statement about "Implementing CA tools promotes students’ engagement in learning" scored the highest mean score (4.43) which indicates a percentage of 83.3 teachers' agreement to this statement. Teachers find the CA tools is useful in developing the learners' engagement in the learning process, but this shows limited positive perception. 4.2.2 Results regarding sixth research question: Question6. What are the major CA tools that teachers use more frequently to assess students’ learning in their PBE schools? To answer this question, the researcher used seven statements about each CA tool. As seen in table 4.15, these statements investigate the seven prescribed CA tools, daily observation, informal record, written work, classroom questioning, presentations, quizzes and projects, to identify the most frequent tools implemented by English teachers in their classrooms. Results are stated in table 4.15 below. Table 4. 15: The major CA tools that teachers use more frequently to assess students’ learning in their PBE schools No. Statement N Strongly disagree Disagree Slightly disagree slightly agree Agree Strongly agree Mean Std. Deviation Decision % % % % % % 1 2 3 4 5 6 1 I observe and records comments on students’ performance. 350 0.6 2.0 4.6 22.6 35.1 35.1 4.95 1.016 High
  • 22. 2 I use a form of criteria when assessing students’ presentations. 350 0.3 0.6 3.1 37.7 25.1 33.1 4.86 0.957 High 3 I ask questions to students in the classroom during the lesson for assessment purposes. 350 0.3 2.0 5.4 27.7 37.4 27.1 4.81 0.980 High 4 I ask students to do a project to help them get better marks. 350 0.6 2.0 4.9 33.7 33.4 25.4 4.74 0.995 High 5 Having more quizzes is better than having more CA tools. 350 0.9 4.3 9.1 21.4 36.3 28.0 4.72 1.144 High 6 I depend on observation without recording comments; there is no need for written comments. 350 0.9 2.6 9.4 25.4 34.6 27.1 4.72 1.093 High 7 I assess students writing skill based on composition done in the classroom. 350 1.4 10. 0 20. 0 20.3 24.0 24.3 4.28 1.366 Slightly High All Questions 0.7 3.4 8.1 27.0 32.3 28.6 4.73 1.079 High According to table 4.15, English teachers highly regarded the use of CA tools as the overall mean score of all statements is high (4.73). Results indicate that teachers practice all CA tools in their classrooms. However, the first three highest mean scores ranging from (4.95 to 4.81) which indicate that teachers use the tools of daily observation, presentations and classroom questions more frequently in their classrooms than the other tools. To begin, item 1 indicating "I observe and record comments on students' performance" scored the highest mean score (4.95). It reveals that the most common and frequent tool used by teachers is daily observation. This is related to the easiness of this tool as teachers implement it when teaching their everyday lessons and at the same time they easily observe their students' performance and notice their development behavior. The second most frequently used tool by teachers is the presentation tool. Item 2 "I use a form of criteria when assessing students' presentations" received the second highest mean score (4.86). According to item 3, the third frequently used tool is classroom questioning. it received a high mean value of (4.81) emphasizing that teachers ask questions in the classroom during the lesson for the assessment purposes. Moreover, item 4 about the project tool shows a high mean value of (4.74). Teachers practice this tool for the purpose of helping their
  • 23. students improve the overall of the CA mark. Project comes in the fourth position because teachers take advantage of this tool to improve students' final mark of CA. Interestingly, the tools of quizzes, informal records and students written work appear at the end of the list of the most practiced CA tools. Based on results of item 5, a high mean of (4.72) indicates teachers agreement of implementing the quizzes in their classrooms to assess their students. So it comes in the fifth place among the most frequently practiced CA tools. Furthermore, the statement about the informal record tool received a mean score of (4.72) putting it at the sixth place. According to teachers, this tool is practiced less than the other tools in the classroom as it required more effort from teachers. In fact, in this tool, teachers are asked to write comments on every student on each skill of the four language skills. This could be the reason placing it at the end of the list. Finally, item 7 about students' written work received a slightly high mean score of (4.28). Students' written work tool comes at the end of the list because teachers want to evaluate students' writing skill based on compositions written in the classroom, as results revealed that 68.6% of teachers agreed to this statement. In a conclusion, English teachers practice all the prescribed CA tools in their classroom, but it varies according to their convictions. The majority of teachers frequently practice the tools of daily observations, presentations and classroom questions. Quiz tool is also practiced to some extent. On the other hand, the least two frequently used tools are informal records and students' written work tools. 4.2.3 Results regarding seventh research question: Question7. Which CA tools English teachers find easy and useful for learners’ assessment? To answer this question, the researcher stated seven statements, one for each tool to find out the most easy and useful CA tools according to English teachers. Results are explained in table 4.16. Table 4. 16: The most prominent CA tools that English teachers find easy and useful for assessing learners No Statement N Strongly disagree Disagree Slightly disagree slightly agree Agree Strongly agree Mean Std. Deviation Decision % % % % % % 1 2 3 4 5 6 1 The practice of the 4 types of writing improves students’ writing skill. 350 0.3 0.9 7.4 33.4 36.9 21.1 4.69 0.934 High
  • 24. 2 Quizzes are the major assessment tool I use to assess students. 350 0.6 5.7 12.3 22.6 33.1 25.7 4.59 1.190 High 3 Day to day observation tool helps gathering useful information about students. 350 0.3 3.4 14.6 28.9 34.6 18.3 4.49 1.073 High 4 Classroom questioning tool develops students’ higher thinking skills. 350 1.7 1.7 14.6 32.0 34.3 15.7 4.43 1.078 High 5 Student’s informal record is a reliable tool for teachers to assess students’ performance. 350 4.6 27.4 44.3 14.6 5.1 4.0 3.00 1.083 Sligh tly Low 6 Projects play effective roles in developing learners’ life and social skills. 350 9.4 28.0 38.0 10.9 11.1 2.6 2.94 1.201 Sligh tly Low 7 Students perform presentations in a way that improves their speaking skill. 350 10. 9 31.1 37.1 8.3 7.4 5.1 2.86 1.254 Sligh tly Low All Questions 4.0 14.0 24.0 21.5 23.2 13.2 3.86 1.116 Sligh tly High Generally speaking English teachers find four CA tools to be very easy and useful for their learners. They are students' written work, quizzes, daily observation and classroom questioning. On the other hand, the tools of informal records, projects and presentations are found to be the least useful for students. According to table 4.16, the highest mean value is received by statement 1 which represents students' written work tool and it received a mean of (4.69). 91.4% of teachers confirm that the most useful tool is students' written work as it develops students' writing skill. The second useful tool is the quizzes. Item 2 received a high mean score of (4.59). Quizzes comes at this position because 81.4% of teachers agreed that quizzes are the major tool for learners' assessment and they think that quizzes provide the actual level of students. In addition, the third statement received a high mean value of (4.49) confirming that daily observation tool is useful. 78.9% of teachers agreed that this tool helps them to gather useful information about students' performance. On the contrary, the last three statements received slightly low mean scores. The score means range from (3.00 to 2.86) and indicate that the tools of informal records, projects and presentations are less useful for students. Teachers' disagreement to items 5 and 6 emphasize that tools of informal records and projects are not reliable and not useful for learners' assessment. Thus they appeared at the end of the list. Informal
  • 25. records and projects are not useful because they seem demanding for more efforts and time. Teachers may not have the time to take notes and ask students to do projects. Finally, with regard to item 7, "Students perform presentations in a way that improves their speaking skill", received the lowest mean score (2.86). The mean value indicates that teachers find the presentation tool to be the least useful one for students and does not help learners to improve their speaking skill. To conclude, English teachers find tools of students' written work, quizzes, daily observation and classroom questioning to be very useful for students' learning and assessment, while projects, informal records and presentations are the least useful tools. 4.4 Qualitative Data Analysis Analysis of qualitative data is done based on two major instruments; the open-ended questions and observation instrument. The researcher decides to analyze the data manually. Manual analysis of open-ended questions involves carefully reviewing and interpreting the responses provided by participants in a study. This type of analysis can be time-consuming, but it provides valuable insights into the thoughts, opinions, and experiences of the study population. It can also yield rich and accurate insights into the attitudes, beliefs, and experiences of the participants. When analyzing data of the open-ended questions, the researcher followed the concept of qualitative content data analysis by taking important data and grouping them into themes. So, the researcher has gone through teachers' responses of each question one by one and put them all in organized tables. Then, the data is filtered and only the required data is collected. The frequency of responses are counted and given percentages. Giving percentages helps to organize and order the responses from the highest to the lowest percentage. This procedure has been done to all the responses of the 8 open-ended questions. Later, the researcher sorts out the data to find out the most common responses as well as the least repeated ones. The qualitative analysis findings are demonstrated as “themes”, which generated a comprehensive and influential conclusions regarding English teachers' perception towards the implementation and usefulness of the prescribed CA tools in PBE schools in the Sultanate of Oman. The researcher also conducted the data analysis of the observation instrument. The form which is utilized to serve this purpose has three columns of "Implemented", "Implemented to some extent" and "Not implemented". When analyzing the data of the classroom observation tool, the researcher has interpreted the two columns of "Implemented" an "Implemented to some extent" together, while the column of "Not implemented" is interpreted separately. The researcher finds it helpful to combine the two columns as this can lead to a better understanding of teachers' practice of the prescribed CA tools in their classrooms. It also provides a bigger chance to recognize the various CA tools that take place in English teachers' lessons.
  • 26. In this section, qualitative content analysis of the participants' responses to the eight open-ended questions in part 4 of the questionnaire is carried out as well as the qualitative data analysis of the classroom observations collected from 21 classroom observational visits. The process of qualitative analysis of open-ended questions and observations is carried out according to the two main themes; implementation and usefulness of the prescribed CA tools. Analysis is conducted in order to extract the required in-depth qualitative information that provides deeper understanding of the study problem, and supports the obtained quantitative statistical results. This section begins with the demographic description of the qualitative participants and then it displays the findings of the qualitative analysis. 4.4.1 Qualitative Data Analysis of Theme 1: Implementation of CA Tools 4.4.1.1 Findings regarding the first research question: Q1: What are the perceptions of English teachers towards the implementation of the prescribed CA tools in PBE schools in Batinah North Governorate? The researcher designed this question to encourage teachers to write about the weaknesses and the strengths of the CA tools so that teachers' perception can be derived based on their responses. Out of the 350 teachers, 9 teachers didn't respond to this question. The researcher studied teachers' responses about the weaknesses and strengths as a way to help understand their perception towards the CA tools and how they perceive them. In fact, responses of each teacher about weaknesses and strengths of CA tools range from three to one response. These responses were collected and categorized into two main categories representing the positive and negative perceptions. Then they were organized after counting the frequencies of each response in order to rank them in a descending order. Data of this question revealed interesting findings. In general, teachers provided 18 different responses about the prescribed CA tools, where the researcher categorize them under teachers' negative perception towards the CA tools. Whereas, teachers reported 12 strengths about the implementation of CA tools. Accordingly, the majority of teachers are found to maintain negative perception towards implementation stage of the CA tools in the PBE schools. A total of 472 negative responses compared to 301 positive ones reported by the study participants. Consequently , English teachers' negative perception may have influenced the implementation of the prescribed CA tools. In the beginning, teachers responses of positive perception is summarized and presented in table 4.17. Table 4. 17: Teachers' negative responses about their perception towards implementation of CA tools.
  • 27. Responses Frequency No time to finish all the CA tools 64 Has a big number of activities/papers about CA tools 54 Marks are not true and don't reflect actual level of students 49 Listening skill is not assessed 42 Presentation tool does not deserve 10 marks of CA 39 Tools are heavy burden on teachers 33 Too many quizzes 31 Marking students' written work requires too much time 28 Too much repetition of tools activities 26 Students are overloaded with lots of activities and quizzes 17 Do not match questions types of final exams 15 Large number of students in classroom 14 Do not match the curriculum 12 Repeating students' work to choose the best mark 11 Do not match students’ level 10 Puts more pressure on students 9 Some CA tools are inappropriate to assess students 7 Has easy types of questions that enable students to cheat like MCQ questions 6 472 When analyzing teachers' negative perceptions, the researcher classified their responses into three categories; negative responses about the CA tools, negative responses about tools influencing students and the amount of load which CA tools impose on teachers and students. Generally, CA tools puts heavy load on teachers and students and do not show relevance to textbooks and final exam questions. The most important thing is that these tools do not provide the actual level of students achievement. To illustrate, 64 teachers show their negative perception towards the CA tools because they reported that implementing the prescribed CA tools requires too much time. Teachers pointed that they don't have the time to finish them all. 54 teachers also indicated that CA tools impose a big number of activities and tasks that add extra load on them and 49 teachers indicated that marks collected from CA tools don not provide the actual level of students' performance. Teacher want the CA tools to evaluate all the language skills, however, the listening skill is not assessed by any tool of the CA tools and this is according to 42 teachers who stated listening skill is not assessed with in CA. Interestingly, 39 teachers highlighted that the presentation tool does not deserve ten marks. They think that these 10 marks should be exerted to important skills like reading and writing or even include listening to the CA system. Besides, 15 teachers reported that CA tools do not match the final examination questions and 12 teachers said that they do not match the curriculum.
  • 28. Teachers develop their negative perception towards the CA tools because they put heavy burden on them. According to table 4.17, 33 teachers reported that these CA tools represent heavy load on teachers and 31 teachers explained that the tools are about implementing too many quizzes to cover the different language skills. Teachers think that the quizzes are a lot and put more pressure on them. In addition, 28 teachers indicated that marking students' takes or quizzes requires too much time and 11 teachers highlighted that teachers sometimes provide chances for students to repeat some CA tools in order to choose the best mark or may be the highest one. 7 teachers and the tools inappropriate to assess students. Moreover, teachers found that students were influenced negatively when implementing CA tools in the classroom. Firstly, 17 teachers noted that students are overloaded with lots of activities and quizzes. Secondly, 14 teachers reported that there are a large number of students in the classrooms and this makes the implementation of the CA tools difficult. Thirdly, 9 teachers explained that CA tools put more pressure on students because they ask for lots of work. Finally, 6 teachers stated that CA tools examines students using some easy types of questions like multiple choice and this enables students to cheat in exams and quizzes. Regarding teachers' responses about their perception towards the implementation of CA tools, the researcher read through and summarized them in Table 4.18 below. Table 4. 18: Teachers' negative responses about their perception towards implementation of CA tools. Responses Frequency Covers different skills of the language and variety of skills are assessed 51 Helps to follow students’ progress/improvement in learning 44 Motivates students to learn and can improve their grades 42 CA tools show the actual level of students’ performance 36 Prepares students for final exam 32 Practice the language and gain knowledge 29 Makes students study hard and prepare for the CA work 21 Involves students in the learning process 13 Students learn how to organize their work 10 Helps teachers gather information about students 9 CA tools help testing students' understanding and comprehension 8 Some tools help to assess students' level accurately 6 Total 301 The researcher analyzed teachers' positive responses about the implementation of the CA tools and are categorized into two subcategories. The first section is teachers
  • 29. good belief about the CA tools and the second one is the tools impact on developing students' performance. Regarding the first section, 51 teachers indicated that CA tools cover and assess the different language skills. Besides, 44 teachers explained that tools help teachers to follow their students' progress in learning. Interestingly, 36 teachers reported that CA tools show the actual level of students' performance and 29 teachers highlighted that tools give opportunities for students to practice the language and gain knowledge. Teachers also expressed through their responses the impact of implementing the CA tools on their students. To illustrate, 32 teachers indicated that CA tools prepare students for the final exams as they provide students with similar tasks and activities. Besides, 21 teachers pointed that CA tools make students study hard and always prepare for the CA work. Moreover, 13 teachers reported that tools help to involve students in the learning process and 10 teachers confirmed that students learn how to organize their work from doing tasks of CA. In a conclusion, English teachers in post basic education (PBE) schools have negative perception towards the implementation of CA tools as the majority of their responses showed that the implementation of the CA tools is inappropriate and difficult, demanding and overloading for them and sometimes CA tools do not give students' actual level of English. On the contrary, very reasonable number of teachers' responses confirm that the implementation of CA tools is reliable, suitable and beneficial. 4.4.1.2 Findings Regarding Second Research Question: Q2: What are the challenges that English teachers encounter in implementing the prescribed CA tools? To answer the second question, teachers were given the most common challenges investigated in literature and were asked to choose only three challenges out of five given to them in the question. Teachers' responses represent the most challenges they face in their schools when implementing the CA tools. All teachers responded to this question. Teachers' responses were counted and the findings are presented in Figure 4.1 below.
  • 30. Figure 4. 1: Challenges English teachers’ face when implementing the prescribed CA tools It can be noticed from Figure 4.1 above that there is a consensus in the responses of English teachers to the question about the challenges they face in their schools. In general, all teachers confirm the existence of the five challenges in PBE schools when implementing the prescribed CA tools. Interestingly, teachers have mentioned some other challenges they face when they added their explanations to justify their selections of the challenges. According to Figure 4.1, English teachers consider the large class size as the biggest challenge for them. Out of 350 teachers, 326 reported that there is a high number of students in their classroom and this obstacles the implementation of the CA tools. 299 teachers reported that time constraint is the second biggest challenge they face in the PBE schools. Teachers sometimes ask for extra time to finish the textbook, so the CA tools require additional time to be finished and this doubled the time teachers need to finish both the textbooks and the CA tools. Teachers also consider the curriculum as a challenge. It comes in third place after class size and time as 226 teachers reported it as a challenge. As teachers explained, textbooks lack the tasks and activities that support the implementation of the CA tools. However, teachers' responses reveal that training and teachers' knowledge and skills are not considered big challenges when implementing the CA tools. Out of 350 teachers, 76 reported training as a challenge and only 52 reported that teachers' knowledge and skills as another challenge. Teachers have justified their view by reflecting on training sessions given to them. They were trained to some extent so that they have acquired the knowledge and skills to implement the tools. 326 299 226 76 52 Large class size Time Curriculum Training Knowledge and skills Challenges of implementing CA tools 350
  • 31. In this question, the researcher also asked teachers to write some explanations in order to in depth understand and support their selections of the challenges. Interestingly, the majority of teachers reported valuable explanations, however, out of 350 only 21 teachers didn't write any explanations. Teachers' explanations are summarized and presented in a descending order in Table 4:19 below. Table 4. 19: English teachers’ explanations about the challenges of implementing the prescribed CA tools in PBE schools Responses frequency Overcrowded classrooms/ large class size/ huge number of students in the classrooms 106 Time provided to implement the CA tools is not enough 87 Heavy curriculum which needs long time to finish 71 The curriculum does not match CA tools 52 Too much work/ lot of things to cover quizzes/ activities 42 Students' level does not help to finish all CA tools 37 Finishing the CA tools with the curriculum is very difficult 28 CA adds extra load on teachers besides school work 22 Teachers face many/too many challenges in implementing CA tools 19 Training on how to apply tools 17 Most of teachers need training o implementing CA tools 16 We need 2 to 3 lessons to apply one CA tool 11 Teachers should have knowledge and skills to implement CA tools 10 Marking of writing and making of CA tool activities consume teachers' time 7 A document comes in many pages, how teachers can read and understand CA tools 3 Total 528 Generally speaking, teachers' explanations strongly support the findings of the first part of the question. It can be noticed that the first three dominant challenges teachers' encounter in implementing the CA tools are large class size, time, and the curriculum. 106 teachers explain that there are many students in the classroom so the teacher needs time to cover the tools with such big number. 87 teachers report that the time is not enough to finish all the CA tools. Thus, they always link this difficulty to the large classroom size as well as the heavy curriculum. In fact, 71 teachers report that the curriculum is a significant challenge. Teachers report two challenges about the curriculum. It is true that they have to finish the heavy curriculum, but teachers add
  • 32. that the curriculum does not match the CA tools. In other words, teacher don't find it supportive to the implementation of CA tools. However, teachers reflect more in depth explanations about the previous three challenges. To illustrate, it is not only that the classroom is crowded but also the level of the students does not help teachers to implement the CA tools or even to finish them. Therefore, 37 teachers highlight students' level of English as another challenge hindering them from implementing the CA tools. Moreover, 42 teachers indicate that the CA tools come up with extra work and load which burden teachers duty in schools. Furthermore, 17 teachers explain that training is required for the success of tools implementation. 10 teachers' point out that teachers' need to be trained to absorb knowledge about the CA tools. 4.4.1.3 Findings Regarding Third Research Question: Q3: How do English teachers practice the prescribed CA tools in PBE schools? The researcher depends on two instruments to collect data in order to answer this question; open-ended questions and classroom observation instrument. Findings of the data of this question is divided into two sections. The first section aims to find out how teachers practice the prescribed CA tools in their lessons. In the second section, the researcher describes teachers' implementation of CA tools whether their practice achieves the formative purposes of assessment or not. Qualitative findings of the two sections are reported below. Section1: English teachers' practice of prescribed CA tools The researcher used a form that includes indicators of the seven prescribed CA tools. So, the researcher conducted 21 classroom observations and collected qualitative data about the indicators of the seven CA tools (Day to day observation, Classroom questioning, Presentation, Written work, Projects, Quizzes and Informal record keeping). There are three indicators representing each CA tool. Frequencies of all indicators representing the seven CA tools were calculated and displayed in Appendix 1.1. However, the researcher only highlighted the most observed indicators practiced by teachers in their classrooms in Table 4.20 below. Table 4. 20: Most implemented indicators of the prescribed CA tools by teachers No Prescribed CA Tools Tools indicators No. of lessons observed Freque ncy 1 Classroom questioning Lots of questions are asked during the lesson 21 21
  • 33. All students are involved in answering teacher’s questions. 21 18 2 Day to day observation Teacher reacts to students’ facial expressions and body language. 21 21 Teacher calls some students to put down their names for assessment. 21 17 3 Quizzes Teacher announces a quiz for the next lesson 21 16 Teachers implement a quiz during the lesson. 21 14 4 Written work Teacher refers to students’ written work in their EX. Book. 21 16 Individual/pair/group writing activities done during the lesson. 21 14 5 Informal record keeping Teacher calls students’ names to evaluate their performance. 21 12 Teacher writes comments/jots down notes on students' performance. 21 8 6 Presentation Teacher assigns presentations to students 21 12 Student present topics of their interest during the lesson. 21 8 7 Project Projects are assigned by the teacher during the lesson. 21 6 Teacher checks students’ implementation of their projects as assignments. 21 7 Generally speaking, English teachers practice all the CA tools in their classrooms. Interestingly, they are found to implement at least two of the three indicators of each CA tool. According to table 4.20, it is worth mentioning that the indicators of classroom questioning , day to day observation, quizzes and written work tools are the most practiced ones by English teachers in the 21 observed lessons. There are 8 dominant indicators that have been practiced regularly in the observed lessons. Observations of these 8 indicators ranged from 14 to 21 lessons which represent a high percentage of implementation in classrooms. On the other hand, the rest of indicators representing tools of informal records keeping, presentations and projects are reasonably observed and they ranged between 6 to 12 lessons in the 21 observed lessons. Teachers either delay these tools to the end of the semester or stop implementing them due to the challenges they face in PBE schools. According to the table, findings show that the most commonly practiced indicators in the 21 observed lessons are the indicators of the classroom questioning tool. English teachers are found to ask lots of questions during the lesson in all the 21 observed
  • 34. lessons and the indicator of all students are involved in answering teachers' questions is observed in 18 lessons. Indicators of the day to day observation tool become the second ones observed in the 21 lessons. Teachers are found to react to students’ facial expressions and body language in all the observed lessons and teachers call some students to put down their names for assessment is observed in 17 lessons. Quiz tool comes in the third place. The most practiced indicator is teachers announce quiz for the next lesson. This indicator is observed in 16 out of 21 lessons. 14 teachers also implemented quizzes during the 21 lessons. This indicates that teachers depend on the traditional tool of exams and quizzes to evaluate their students. Moreover, the indicators of students' written work tool are reasonably practiced by English teachers in their lessons. 16 teachers refer to students' written work done in their exercise book and 14 teachers do different types of writings (individual/pair/group writing) in the 21 observed lessons. On the contrary, it can be noticed from the table that teachers, to some extent, are hesitant about implementing the indicators of informal records keeping, presentations and projects tools. They may find these tools less useful for their learners, thus their practice of these tools is limited. To illustrate, the indicators of these tools are observed shortly from 6 to 12 lessons out of the 21 lessons observed. This could be due to the challenges teachers face when implementing the CA tools or dissatisfaction of these tools. For the informal records keeping tool, 12 teachers implement the indicator of teacher calls students’ names to evaluate their performance and 8 teachers only writes comments or jots down notes on students' performance in the 21 lessons. Moreover, presentation and project tools become at the end of the list, their indicators are practiced moderately by English teachers. The indicator of teacher assigns presentations to students is observed in 12 lessons and students present topics of their interest during the lesson is observed in 8 lessons only out of 21. Finally, indicators of the project tool are found moderately practiced by teachers in the 21 observed lessons. The indicator of teacher checks students’ implementation of their projects as assignments is observed in 7 lessons and projects are assigned by the teacher during the lesson is observed only in 6 lessons. According to table 4.20 presentations and projects tools appear at the end of the list. Interestingly, the researcher supplemented this instrument with an open-ended question which is "Why do you think teachers delay tools of presentation and project to the end of semester?". This question is accidently serves to understand the findings of the classroom observation instrument. Therefore, it is expected that this question can add valuable data to understand teachers' practice of the presentations and projects tools. The researcher wants to investigate the reasons for delaying the implementation of these two tools. First, the researcher studied teachers' responses and found that teachers reported their views about the delay of these tools. Analysis was very helpful to recognize who
  • 35. delay the implementation of these two tools and who don't delay. Findings is summarized in Table 4.21 below. Table 4. 21: English teachers' practice of presentation and project tools Presentation and project tools Teachers who don’t delay Teachers who responded we delay Teachers left it Unanswered/ Frequency 76 253 21 Percentage 21.7% 72.3% 6% Findings generally show that he majority of English teachers postpone the implementation of presentation and project tools to the end of the semester. According to table 4.21, 253 out of 350 teachers indicated in their responses that they delay these tools and 76 teachers reported that they don't delay them to the end of the semester. Some teachers reported that they start implementing these two tools in the beginning of the semester. However, only 21 teachers left this question unanswered, they didn't respond to this question. Then, accordingly and in order to verify the previous findings to identify the reasons why teachers postpone presentations and projects to the end of the semester, the researcher qualitatively analyzed teachers' responses of reasons and organized them in a descending order as shown in Table 4.22 below. Table 4. 22: English teachers’ reasons for postponing presentation and project tools Responses Frequency These tools consume too much time and this wastes our teaching time 64 Teachers provide chances for students to acquire language, more knowledge and more skills 52 Teachers focus on finishing the heavy curriculum 48 Students are carless and refuse to present and do project early in the semester 44 Teachers work hard to follow the scheme of work 34 Teachers give time for students to prepare and be ready to present and make a project 29 Teachers are overloaded with work and duties 27 Teachers want to finish the important tools like quizzes, written work 26 Lots of marking especially students written work tool 19 Students are overloaded 18 Teachers want to recognize students' level 15
  • 36. Too many students in the class 14 Presentation and project tools are easy to apply and evaluate 10 Teachers want to help students get more marks, so they do it at the end of semester 7 Presentation and projects are less important tools 6 In general, the reasons of postponing the implementation of presentations and projects to the end of the semester are similar to the challenges teachers face in their PBE schools. Findings show that the reasons for the delay in based on time, heavy curriculum, work overload, students level and other significant factors. According to table 4.22, the most common reasons reported by English teachers for tools delay are time, students' level, heavy curriculum and heavy load of work and duties in PBE schools. According to 64 teachers, the strongest reason for delaying presentations and projects is "These tools consume too much time and this wastes our teaching time.” Then the reason of “Teachers provide chances for students to acquire language, more knowledge and more skills ” comes in the second place where 52 teachers reported this reason. Heavy curriculum is reported by 48 teachers as the third significant reason. In addition, students' themselves represent a reason for the delay. 44 teachers reported that students are carless and refuse to present in the beginning of the semester. Moreover, 27 teachers mentioned that they delay these tools because they are overloaded with work and duties. 26 teachers think that presentations and projects are not important and they want to finish the important tools they think more important for learners' assessment. Interestingly, reasons like lots of marking, large class size, students' overload are the least mentioned by teachers. Although 10 teachers responded that presentation and project tools are easy to be implemented, 6 teachers said that they are not important so they postpone them to the end of the semester. Section2: English teachers' implementation of CA tools to achieve formative purposes of assessment The prescribed CA tools are introduced in the assessment system in PBE school in order to activate the benefits of the elements of formative assessment so that English teachers apply the CA tools in order to achieve the formative purposes of assessment. This requires teachers' understanding of the formative assessment in relation to its elements. Therefore, the researcher utilized two open-ended questions to collect data about this issue. The analysis of the qualitative content of data collected questions focuses on examining the extent to which teachers understand that CA is formative assessment by nature. The first question examines teachers' responses to the open-ended question of their agreement with the statement that says "Continuous assessment is formative assessment by nature" and findings is shown in Table 4.23.
  • 37. Table 4. 23: Percentage and frequency of teachers’ consensus on the truth of the statement that “Continuous assessment is formative assessment by nature” Analysis Teachers who responded "Correct" Teachers who responded "Incorrect" Left unanswered or no comments or no idea Frequency 226 88 36 Percentage 64.5% 25.1% 10.4 According to Table 4.23, findings show that the largest percentage of teachers (64.5%) agree that the statement “Continuous assessment is formative assessment by nature” is correct, (25.1%) of them do not believe that it is correct, and only (10.4%) have no response or do not have any idea about the statement. It is worth mentioning that 226 teachers out of 350 have a clear understanding of implementing CA tools in order to use assessment data to develop the learning process and improve learners' performance. This number imposes teachers' awareness of implementing the CA tools in a way that achieves learners' engagement and feedback to learners. However, it should be highly considered when 88 out of 350 teachers responded that the statement is incorrect. It means 25% of teachers do not understand that CA comes to work in line with the formative purposes of assessment. This group seems to implement the CA tools without peering in mind the elements of formative assessment. Lastly, 36 teachers have no idea about what this statement means. This group, if added to the previous group, the percentage will be 35.5% and this represents teachers' poor understanding of the essence of implementing the CA tools to achieve formative purposes of assessment. Accordingly, in order to ascertain teachers' understanding of the concept of implementing CA to achieve formative purposes of assessment, teachers were asked to provide explanations about their understanding of the statement. They gave various explanations and the researcher analyzed their responses and presented them in Table 4.24 below Table 4. 24: English teachers’ explanations showing teachers' understanding of the statement "CA is formative assessment by nature." Responses Frequency Teachers collect data about students continuously 54 Formative assessment is part of CA 36 CA helps teacher to view their teaching 34 Teachers do CA to know students' progress or level 30 It is an on-going process, it is continuous in the semester 28 Teachers can give feedback to students on their work 17
  • 38. CA is based on learner’s engagement 16 Teachers use different tools according to students’ level to evaluate them 14 Both are similar 12 Tools are used to improve students' performance 11 It is correct because formative assessment is about feedback 11 It can give us feedback about students' level 10 CA is evaluating students in all language skills 9 Correct. Students need to practice to develop their skills 8 Teachers who responded that the statement is correct, they provided interesting explanations about CA is formative assessment by nature and this revealed their appropriate understanding of the statement. Generally speaking, their responses pointed that teachers are aware of the meaning of CA. teachers understand that it represents an ongoing process of implementing the various CA tools to gather data about students. Their responses also stress the elements of formative assessment like feedback and learner's engagement. They provided 14 explanations confirming good understanding of tools implementation. Thus, 54 teachers wrote that the statement is about collecting data about students continuously through the semester using the CA tools. 36 teachers also reported that formative assessment is part of CA. This to some extent makes close understanding of CA and formative assessment as they meet in something similar. Besides, 34 teachers feel that CA helps them through using the CA tools to look back at their teaching and modify their methods and ways. In addition, 28 teachers supported the first explanation about looking at CA and tools as an ongoing process of implementation. However, very few teachers who reported in their explanations that learners' engagement and feedback are essential elements to be achieved when implementing the CA tools. 17 teachers explained that CA help them to give feedback to their students and 11 teacher responded that statement is correct because formative assessment is about feedback. In addition, 16 teachers wrote that the statement means CA is based on learner's engagement. Interestingly, the two elements of formative assessment have appeared in teachers' responses about the statement meaning their good understanding of CA is formative assessment by nature. On the contrary, teachers provided few responses that highlight their limited understanding about the statement. These responses are presented in Table 4.25. Table 4. 25: English teachers’ explanations representing limited understanding Responses Frequency CA is different from formative assessment 40 CA depends on tests and quizzes 21 CA should be summative 8
  • 39. No idea, no comments 8 It depends on students information 5 Its correct. All language skills can be gained by nature 4 According to Table 4.25, it is worth mentioning that teachers provided six irrelevant responses about their understanding of the statement. These responses indicate teachers' weak understanding of CA is formative assessment by nature. As a result, this limited understanding can be reflected on teachers; practice of the CA tools in their classes. To illustrate, 40 teachers explained that CA is different from formative assessment and 21 teachers wrote CA depends on exams and quizzes. In addition, 8 teachers said that CA should be summative. Interestingly, 8 teachers stated directly that they have no idea and some of them wrote no comments as an explanation for their understanding of the statement. In this section, the researcher examines one of the elements of the formative assessment that can be achieved by teachers when implementing the CA tools. Therefore, the researcher included a second question in the questionnaire investigating teachers' practice of the feedback element in their classrooms. The purpose of this question is to investigate teachers’ knowledge and their practice of the element of providing feedback to students. So, teachers were asked the following open-ended question: “A significant element of CA tools is providing feedback to help students improve their achievement. How do you see this happening in your classroom?” The percentages of feedback element is shown in Table 4.26 below. Table 4. 26: Percentages of teachers’ practice of the feedback element Analysis Teachers who provide feedback to students Teachers who don’t provide feedback Question left unanswered Frequency 214 127 9 Percentage 61.2% 36.2% 2.6% According to table 4.26, analysis revealed that teachers' percentage of (61.2%) provides feedback to students, while only (36.2%) of them do not provide feedback, and only (2.6%) didn't respond to the question. Findings confirm teachers' understanding of using the prescribed CA tools to practice the element of providing feedback to students on their work. Teachers believe in the importance of feedback for the learning process, but findings also indicated 127 teachers who don’t provide feedback. So, it has become significant for teachers to explain their responses why it is difficult to provide feedback. In response to the research question, teachers provided lots of explanations about the feedback element. The researcher analyzed and organized the responses into two
  • 40. categories, responses about how teachers give feedback and responses about reasons why teachers can't give feedback. The researcher collected teachers' explanations and organized them in Table 4.267 below. Table 4. 27: English teachers’ explanations about the feedback element of CA Responses about teachers who provide feedback to students Frequency Teachers give written feedback 68 Comments given on student’s writings 50 Comments given after a quiz 41 Give back papers to students to learn from their mistakes 39 Oral feedback 33 At the end of each activity/task 31 Individual feedback 21 Pronunciation correction when reading aloud 20 Immediate feedback 18 Whole class feedback 17 Total 297 Table 4.27 shows 297 responses were provided by English teachers regarding the feedback practice. This big number of responses explained teachers care and interest to provide feedback to their students. Teachers use several and various approaches of providing feedback to their students. In fact, the largest group of 68 teachers, give written feedback to their students while the lowest group of 17 teachers give whole class feedback. The table also confirms the use of a variety of feedback forms where 50 teachers give lots of comments on students' writings and 41 teachers give comments on students' performance after the quiz. In addition, 39 teachers mentioned that they return papers to students in order to help them learn from their mistakes. Moreover, 33 teachers give feedback orally, 21 teachers give it individually and 20 give feedback when speaking and reading to correct students pronunciation. Finally, 18 teachers said they give feedback immediately to students and 17 teachers give it as a whole class feedback. This all indicates teachers appropriate practice of the element of feedback when implementation the CA tools inside their classroom. The element of feedback is not implemented by all teachers. Teachers are found to have difficulties and reasons for this. These reasons are stated in Table 4.27. Table 4.27: teachers responses about why they can't give feedback Responses about teachers who don't provide feedback Frequency No time to give feedback 56 Large class size 42 It depends on students' level 28 Students do not care about teachers' feedback 14
  • 41. Feedback is not meaningful 12 Don't work with low achievers, work only with good students 9 Students don't learn from their mistakes 8 160 According to Table 4.27, although teachers believe in the importance of feedback element, they wrote about the reasons which stop them from providing feedback to their students. Teachers reasons can be classified into reasons of school context, problems of CA tools and faults of students. For instance, 56 teachers mentioned that they are not able to provide feedback to their students because they don't have enough time in the classroom. The second reason mentioned by 42 teachers is the large class size. Teachers found them unable to provide feedback because there are lots of students in the classroom. Interestingly, teachers indicated some reasons related to students themselves. 28 teachers said students' level does not help to provide feedback and 14 teachers indicated that students don't care about teachers feedback. Thus, 8 teachers mentioned students do not learn from their mistakes and similarly they may not benefit from the feedback. Moreover, teachers mentioned reasons about the CA tools. 9 teachers reported that CA tools don't work with low achievers and only high students' level can handle CA tools. This confirms that students' level is a difficulty for teachers to implement the CA tools in order to achieve the formative purposes. Finally,12 teachers find feedback is not meaningful for the improvement of students' work. All these responses, shows teachers' retreatment from providing feedback to their students. 4.4.1.4 Findings Regarding Fourth Research Question: Q4: What are the factors influencing English teachers' adoption (acceptance/rejection) of the prescribed CA tools? In the questionnaire, teachers were asked a direct question to report the factors of acceptance or rejection of the CA tools in their classrooms. Out of 350 teachers, only 11 teachers didn't respond to this question. Teachers' responses were collected and analyzed by the researcher then listed in a descending order in table 4. 27 below. Table 4. 27: The factors influencing English teachers' adoption of the prescribed CA tools Responses Frequency Usefulness of the CA tools 88 Time required to finish the CA tools 67 Formality, if tools are formally implemented in the classroom 52 Easiness of implementation of tools 43 Validity, CA tools should be valid / should test what is required to be tested 41 Accuracy, tools should be accurate, give the true/actual/ real level of students 30
  • 42. CA tools should match the final exam questions 26 The flexibility of implementation of CA tools so they are not compulsory 20 Appropriateness for students' level 18 The amount of work required, tools should not be demanding 14 If tools are done by students themselves 13 Relevancy , tools should be relevant to the textbook 11 Should improve teachers' performance 9 Generally speaking, although the researcher investigates limited factors of teachers' acceptance that are based on the theoretical framework, teachers' responses to the question indicated thirteen different factors influencing their adoption of the prescribed CA tools in their classrooms. According to table 4.27, these factors can be categorized into two groups; factors related to the CA tools and factors related to tools of implementation. Regarding the factors of the CA tools, teachers find usefulness (88 teachers), easiness (43 teachers), validity (41 teachers), accuracy (30 teachers), relevancy to final exams (26 teachers) and appropriateness (18 teachers) to be fundamental factors for them in order to accept using the CA tools in their classrooms. As for the ways of implementation, 67 teachers reported that time is a major factor to adopt the CA tools. 14 teachers indicated that these tools are demanding and required lots of work and effort and this can't be done unless there is plenty of time to finish the CA tools. In addition, 52 teachers are against students' implementing the work of CA tools at home. They emphasize that CA work should be done formally in the school. Teachers think the work is not done by students themselves. Moreover, 20 teachers reported that they need freedom to choose from the CA tools according to what they see appropriate and effective. The least mentioned factors reported by teachers are tools relevancy to the text book (11 teachers) and tools should be useful for teachers as well (9 teachers). 4.4.1 Qualitative data analysis of theme 2: Usefulness of CA tools In this theme, the researcher discusses the findings about teachers' perception towards the usefulness of CA tools, the most frequently used tools and the tools teachers find easy and useful for learners’ assessment. So, the researcher utilized two instruments; open-ended questions and classroom observation instrument. The findings of both instruments are shown in the sections below. 4.4.2.1 Findings Regarding the Fifth Research Question Q5: What are the perceptions of English teachers towards the usefulness of the prescribed CA tools in PBE schools? To answer the fifth question, teachers were asked to answer a direct open-ended question which says "Prescribed CA tools are useful for developing learners and