1. Data: Rawfacts
• Lifeblood of an organization.
• Critical for smooth operation.
• Represents facts of daily transactions (e.g., hiring a new employee).
• Captured and stored for future use (e.g., date hired, name, position
title, location).
3.
2. Information: Processeddata.
• Interpretation of data.
• Has a goal and context (e.g., making hiring decisions, understanding
employee performance).
• Sometimes data itself can be informative (e.g., salary range).
• Often requires additional work to transform data into information
(e.g., calculating totals, presenting data in order).
• Used to answer important questions (e.g., full-time employee
headcount, promotion decisions).
4.
3. Knowledge: Contextualizedinformation.
• Information given meaning.
• Different from data and information.
• About how to use data and information to make decisions and conduct business.
• Often hidden in the minds of individuals and groups.
• In HRIS, data includes facts about age, gender, education.
• Information includes average age, gender ratio, number and types of graduates.
• Helps HR managers plan recruitment, schedule training, identify discrimination.
• Knowledge involves executing plans, deciding on training programs, addressing
discrimination.
• Knowing what information is needed and how to use it to achieve HR objectives.
Definition:
• A setof software applications combined with a database.
• Allows organizations to manage data electronically.
7.
Managing Data:
• Identifyingdata needed for HR decisions.
• Defining data characteristics (e.g., number data vs. character data).
• Organizing data to promote integration, quality, and accessibility.
• Restricting data access to authorized personnel.
8.
Database:
• A setof organized, permanent, self-descriptive, interrelated data items.
• Self-descriptive: Knows characteristics of data (e.g., length of
employee’s last name).
• Interrelated: Links between different sets of data (e.g., employees and
jobs, HR data and other organizational data).
9.
Functions of aDBMS:
• Create the database.
• Insert, read, update, and delete database data.
• Maintain data integrity (correctness) and security (restricted access).
• Provide backup and recovery capabilities to prevent data loss.
• Designed for high performance, allowing quick data retrieval by many
users.
Structure:
• Paper filingsystems: Filing cabinet and drawer for each type of
document (e.g., employee personnel form).
• Computer systems: Individual computer files for each type of
document (e.g., Employee File, Time Card File, Employee Benefit
Files).
13.
Objective:
• Process transactionsefficiently (e.g., update payroll records, produce
payroll checks).
• Not focused on data sharing among different business applications and
users.
14.
Shortcomings:
• Data redundancy:Same data (e.g., employee’s name and address)
stored in multiple files.
• Poor data control: Access to a file meant access to all data in it,
lacking restriction.
• Inadequate data manipulation: Difficult to combine data across
files, update, and add new data.
• Excessive programming effort: Changes in data structure required
extensive software program modifications.
15.
Limitations:
• Good atspecialized transaction processing.
• Not designed for easy and quick information retrieval to answer
complex questions (e.g., average hourly wage comparison).
• Difficulties in sharing data across applications (e.g., linking employee
salaries and sales projections).
Introduction by E.F. Codd (1970):
• Proposed storing data in tables, each representing one “entity” (e.g.,
employee).
• Information about an entity stored only in its respective table.
• Eliminated redundancies (e.g., multiple storage locations for an
employee’s address).
18.
Tables (Relations):
• Calledrelations, forming the basis of relational databases.
• Logical relationships built into table structures for data retrieval.
19.
Query Capability:
• Madedata retrieval more accessible to end users with limited
programming experience.
• Allowed easy building of relationships among all entities in the
organization.
20.
Data Sharing:
• Significantdifference from file-based systems.
• Three types of data sharing:
• Between functional units.
• Between management levels.
• Across geographically dispersed locations.
• Requires a change in end-user thinking (sharing data means sharing
power).
• Emphasizes the importance of entering correct data.
1. Relational DBMSs:
•Facilitate data integration across different functions.
• Allow each function to access its own data and other functions’ data.
• Increase feasibility and popularity of integrated business applications
(ERP).
23.
2. Enterprise ResourcePlanning (ERP):
• Set of integrated database applications/modules.
• Carry out common business functions (HR, general ledger, accounts
payable/receivable, order management, inventory control, CRM).
• Integrated through common definitions and a common database.
1. Operational Employees:
•Focus on data-processing transactions for smooth operation.
• Use transaction-processing systems for daily business transactions
(e.g., timecard processing).
• Concerned with accuracy and efficiency of data processing.
26.
2. Managers:
• Interestedin summary data (daily, weekly, monthly reports).
• Use data to monitor hours worked, employee absences.
27.
3. Executives:
• Relyon aggregated information to evaluate trends and develop
strategies.
• Request reports comparing turnover statistics across business groups
over time.
1. Global DataAccess:
• Important for teams stationed in different countries (e.g., Thailand,
India, USA).
30.
2. Issues inData Sharing:
• Managing the day/time of a transaction.
• Determining where to store components of the business application,
DBMS, and database.
31.
3. Day/Time Management:
•DBMS developers (e.g., Oracle, MS SQL Server, IBM DB2) include
capabilities to record dates and times with time zones.
• Example: Transaction recorded in Los Angeles (1 P.M., -08:00 GMT)
stored in a database in London.
32.
4. Global InformationSystem Design:
• Business applications and DBMS broken into components (tiers).
• Traditional client-server architectures: Two tiers (user
interface/business logic on client, database on server).
• N-tier architectures: Databases and applications distributed globally.
33.
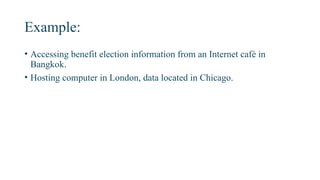
Example:
• Accessing benefitelection information from an Internet café in
Bangkok.
• Hosting computer in London, data located in Chicago.
34.
5. Centralized Database:
•Confines data to a single location for easier control of data integrity,
updating, backup, query, and access.
• Requires a communications infrastructure for data sharing over wide
areas.
35.
6. Internet andStandardized Protocols:
• Made centralized database structures and geographically dispersed
data sharing feasible.
1. Transaction ProcessingSystems (TPS):
• Automate manual processes (e.g., payroll).
• Focus on data storage, processing, and flows at the operational level.
• Provide summary reports for management.
38.
2. Management ReportingSystems (MRS):
• Aim information at middle managers.
• Integrate data by business functions (e.g., manufacturing, marketing,
HR).
• Generate inquiry and reports from the database.
39.
3. Decision SupportSystems (DSS):
• Assist senior managers and business professionals in decision-making.
• Use data mining, data analytics, and business intelligence (BI).
• Rely on data warehouses for aggregated data.
40.
4. Human ResourcesManagement Decision
System (HRMDS):
• Special instance of MRS/MIS.
• Focuses on information used in HR decision-making.
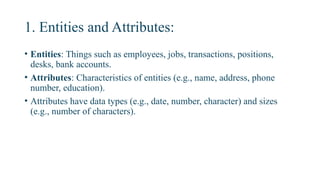
1. Entities andAttributes:
• Entities: Things such as employees, jobs, transactions, positions,
desks, bank accounts.
• Attributes: Characteristics of entities (e.g., name, address, phone
number, education).
• Attributes have data types (e.g., date, number, character) and sizes
(e.g., number of characters).
43.
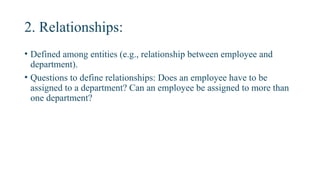
2. Relationships:
• Definedamong entities (e.g., relationship between employee and
department).
• Questions to define relationships: Does an employee have to be
assigned to a department? Can an employee be assigned to more than
one department?
44.
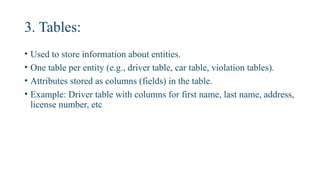
3. Tables:
• Usedto store information about entities.
• One table per entity (e.g., driver table, car table, violation tables).
• Attributes stored as columns (fields) in the table.
• Example: Driver table with columns for first name, last name, address,
license number, etc
45.
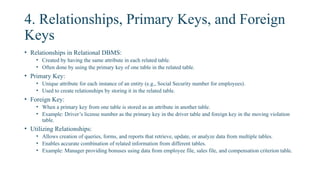
4. Relationships, PrimaryKeys, and Foreign
Keys
• Relationships in Relational DBMS:
• Created by having the same attribute in each related table.
• Often done by using the primary key of one table in the related table.
• Primary Key:
• Unique attribute for each instance of an entity (e.g., Social Security number for employees).
• Used to create relationships by storing it in the related table.
• Foreign Key:
• When a primary key from one table is stored as an attribute in another table.
• Example: Driver’s license number as the primary key in the driver table and foreign key in the moving violation
table.
• Utilizing Relationships:
• Allows creation of queries, forms, and reports that retrieve, update, or analyze data from multiple tables.
• Enables accurate combination of related information from different tables.
• Example: Manager providing bonuses using data from employee file, sales file, and compensation criterion table.
46.
5. Queries
• Definition:
•A query is a question posed to a database to retrieve or manipulate data.
• Structured to be understood by the DBMS.
47.
5.1 Queries (cont1): Type of queries
• Select Queries:
• Retrieve data based on specific criteria.
• Can be general (e.g., all employees at retirement age) or specific (e.g.,
engineers in New York at retirement age).
• Action Queries:
• Perform actions on tables (e.g., update, delete, insert records).
• Examples: Increase salaries, remove former employees, add new benefits.
• Cross-Tab Queries:
• Perform calculations and display results in a table format.
• Example: Total personnel count by gender and region.
48.
5.2 Queries (cont2): Usage
• Queries do not store data; they report on current data in tables.
• Results are temporary and not stored in the database.
49.
5.3 Queries (cont3): Capabilities
• Display selected fields and records.
• Sort records.
• Perform calculations (e.g., sums, averages).
• Generate data for forms, reports, and other queries.
• Update data in tables.
• Find and display data from multiple tables.
• Create new tables.
• Delete records based on criteria.
50.
5.4 Queries (cont4): Importance in HRIS
• Select and cross-tab queries provide essential information for
managers and executives.
• Action queries enhance operational efficiency.
• Queries serve as the foundation for forms, reports, and decision-
making tools.
51.
6. Forms:
• Objectin a database used to maintain, view, and print records in a structured
manner.
• Can present data in customized and useful ways (e.g., time sheet layout).
• Improve data input efficiency and accuracy.
• Main mechanism for creating end-user interfaces.
• Can be based on a table, multiple tables, or queries.
• Display one or many records at a time.
• Provide navigation buttons for moving between fields and records.
• Data entered or changed in a form automatically updates the underlying table
upon saving.
52.
7. Reports:
• Formattedpresentation of data from tables, multiple tables, or queries.
• Created as printouts or for on-screen viewing.
• Data in reports are dynamic, reflecting the latest data from the tables.
• Cannot change data or add new records in a report.
• Provide flexibility for formatting printed output.
• Can be designed manually or using a report wizard.