Advanced Thermodynamics
College ofElectrical, Energy and Power
Engineering
Yangzijin Campus, Yangzhou University
Lecturer: Dr. Raza Gulfam
Office Address: Zhixing Building, Room S518
Email: gulfamrazahaidery@hotmail.com
2.
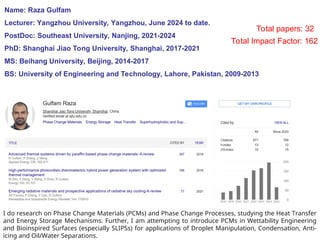
Name: Raza Gulfam
Lecturer:Yangzhou University, Yangzhou, June 2024 to date.
PostDoc: Southeast University, Nanjing, 2021-2024
PhD: Shanghai Jiao Tong University, Shanghai, 2017-2021
MS: Beihang University, Beijing, 2014-2017
BS: University of Engineering and Technology, Lahore, Pakistan, 2009-2013
I do research on Phase Change Materials (PCMs) and Phase Change Processes, studying the Heat Transfer
and Energy Storage Mechanisms. Further, I am attempting to introduce PCMs in Wettability Engineering
and Bioinspired Surfaces (especially SLIPSs) for applications of Droplet Manipulation, Condensation, Anti-
icing and Oil/Water Separations.
Total papers: 32
Total Impact Factor: 162
What is thermodynamics?
4
Thermodynamicsis a branch of physics that deals with the study of energy, heat, and
work. It focuses on how energy is transferred within physical systems and the laws
governing these processes. Thermodynamics is a fundamental part of both classical and
modern physics and plays a crucial role in many scientific and engineering disciplines.
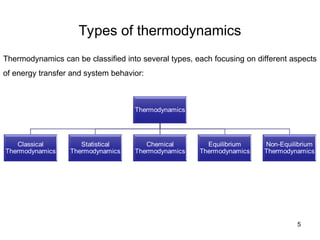
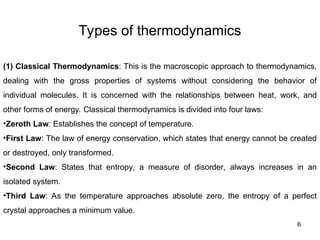
Types of thermodynamics
6
(1)Classical Thermodynamics: This is the macroscopic approach to thermodynamics,
dealing with the gross properties of systems without considering the behavior of
individual molecules. It is concerned with the relationships between heat, work, and
other forms of energy. Classical thermodynamics is divided into four laws:
•Zeroth Law: Establishes the concept of temperature.
•First Law: The law of energy conservation, which states that energy cannot be created
or destroyed, only transformed.
•Second Law: States that entropy, a measure of disorder, always increases in an
isolated system.
•Third Law: As the temperature approaches absolute zero, the entropy of a perfect
crystal approaches a minimum value.
7.
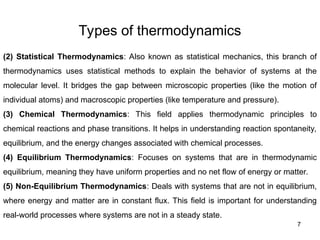
Types of thermodynamics
7
(2)Statistical Thermodynamics: Also known as statistical mechanics, this branch of
thermodynamics uses statistical methods to explain the behavior of systems at the
molecular level. It bridges the gap between microscopic properties (like the motion of
individual atoms) and macroscopic properties (like temperature and pressure).
(3) Chemical Thermodynamics: This field applies thermodynamic principles to
chemical reactions and phase transitions. It helps in understanding reaction spontaneity,
equilibrium, and the energy changes associated with chemical processes.
(4) Equilibrium Thermodynamics: Focuses on systems that are in thermodynamic
equilibrium, meaning they have uniform properties and no net flow of energy or matter.
(5) Non-Equilibrium Thermodynamics: Deals with systems that are not in equilibrium,
where energy and matter are in constant flux. This field is important for understanding
real-world processes where systems are not in a steady state.
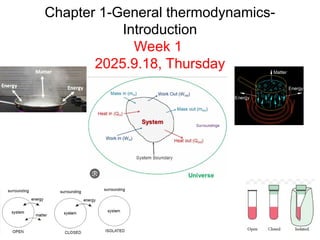
8.
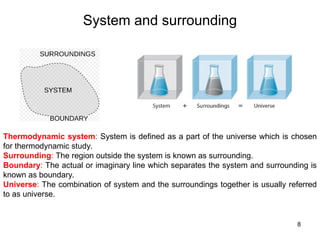
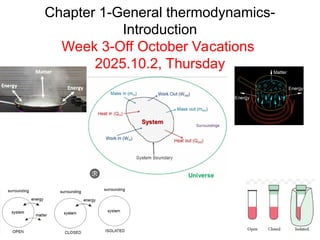
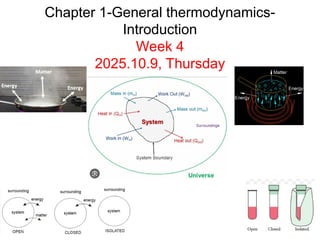
System and surrounding
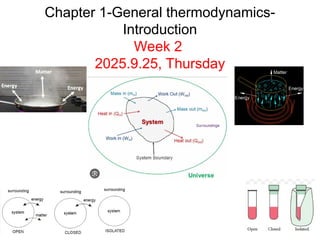
8
Thermodynamicsystem: System is defined as a part of the universe which is chosen
for thermodynamic study.
Surrounding: The region outside the system is known as surrounding.
Boundary: The actual or imaginary line which separates the system and surrounding is
known as boundary.
Universe: The combination of system and the surroundings together is usually referred
to as universe.
9.
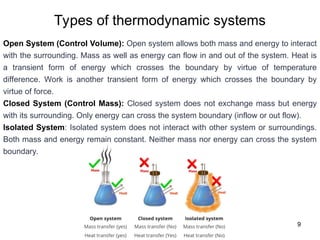
Types of thermodynamicsystems
9
Open System (Control Volume): Open system allows both mass and energy to interact
with the surrounding. Mass as well as energy can flow in and out of the system. Heat is
a transient form of energy which crosses the boundary by virtue of temperature
difference. Work is another transient form of energy which crosses the boundary by
virtue of force.
Closed System (Control Mass): Closed system does not exchange mass but energy
with its surrounding. Only energy can cross the system boundary (inflow or out flow).
Isolated System: Isolated system does not interact with other system or surroundings.
Both mass and energy remain constant. Neither mass nor energy can cross the system
boundary.
10.
Property of athermodynamic system
10
Any object can be described by attributes like weight, mass, volume, colour, shape, size,
etc. How can we describe a thermodynamic system? Some parameters or attributes are
used to describe a system. These parameters can be measured by instruments, or their
values can be calculated. These parameters that describe the characteristics of a
system are called properties of a system.
• Intensive property
Properties that are independent of mass of the system are called Intensive property.
Intensive property does not change with the mass or size of the system contents.
Examples: temperature (T), pressure (P), density etc.
• Extensive Property
Extensive property is dependent on mass of the system. The value of the property is
sum of the value of the parts of the system. Extensive property is additive by nature.
Example volume(V), mass(m), weight(W), Internal Energy(U), Enthalpy(H), Heat
Capacity(C), Entropy(S), etc.
11.
Property of athermodynamic system
11
Specific Property
It is a special case of intensive property. Expensive property per unit mass is called
specific property. For example, volume is dependent on the mass or size, so it is an
extensive property of the system. But specific volume (volume per unit mass, v = V/m) is
independent of mass or size, so specific volume is a special case of intensive property.
Similarly, Specific weight (w = W/m), specific integral energy (u = U/m), specific Enthalpy
(h = H/m), Specific Entropy (s = S/m) etc.
We use specific properties because they:
• Remove dependency on system size
• Allow easy use of tables and charts
• Enable generalization to any mass of material
• Simplify design and analysis in power plants, refrigeration, engines, etc.
12.
Property of athermodynamic system
12
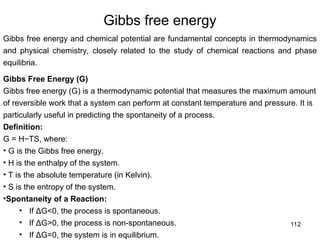
• By using specific properties, we can tabulate and apply data to any mass of a
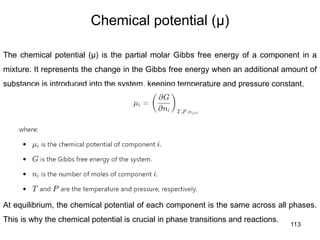
substance, whether it’s 1 g, 1 kg, or 1 ton.
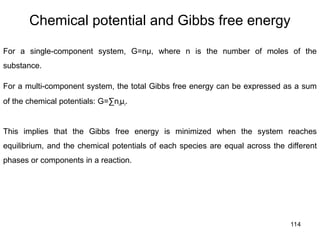
• For example, steam tables provide specific enthalpy (kJ/kg), which you can directly
multiply by your system’s mass to get the total enthalpy.
Specific weight (w = W/m = N/kg) → tells us how heavy a unit mass is under gravity.
• Example: Water at 4°C has w≈9.81 N/kg.
• Useful because it’s the same whether we have a drop of water or a full tank.
13.
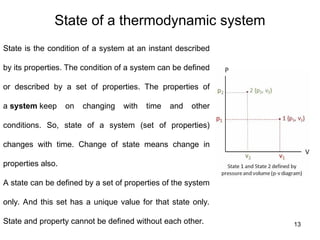
State of athermodynamic system
13
State is the condition of a system at an instant described
by its properties. The condition of a system can be defined
or described by a set of properties. The properties of
a system keep on changing with time and other
conditions. So, state of a system (set of properties)
changes with time. Change of state means change in
properties also.
A state can be defined by a set of properties of the system
only. And this set has a unique value for that state only.
State and property cannot be defined without each other.
14.
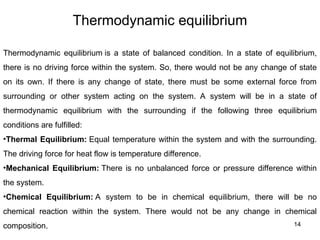
Thermodynamic equilibrium
14
Thermodynamic equilibriumis a state of balanced condition. In a state of equilibrium,
there is no driving force within the system. So, there would not be any change of state
on its own. If there is any change of state, there must be some external force from
surrounding or other system acting on the system. A system will be in a state of
thermodynamic equilibrium with the surrounding if the following three equilibrium
conditions are fulfilled:
•Thermal Equilibrium: Equal temperature within the system and with the surrounding.
The driving force for heat flow is temperature difference.
•Mechanical Equilibrium: There is no unbalanced force or pressure difference within
the system.
•Chemical Equilibrium: A system to be in chemical equilibrium, there will be no
chemical reaction within the system. There would not be any change in chemical
composition.
15.
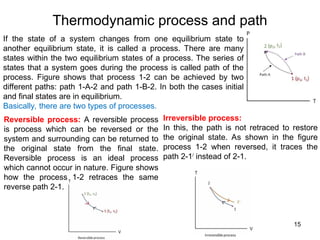
Thermodynamic process andpath
15
If the state of a system changes from one equilibrium state to
another equilibrium state, it is called a process. There are many
states within the two equilibrium states of a process. The series of
states that a system goes during the process is called path of the
process. Figure shows that process 1-2 can be achieved by two
different paths: path 1-A-2 and path 1-B-2. In both the cases initial
and final states are in equilibrium.
Basically, there are two types of processes.
Reversible process: A reversible process
is process which can be reversed or the
system and surrounding can be returned to
the original state from the final state.
Reversible process is an ideal process
which cannot occur in nature. Figure shows
how the process 1-2 retraces the same
reverse path 2-1.
Irreversible process:
In this, the path is not retraced to restore
the original state. As shown in the figure
process 1-2 when reversed, it traces the
path 2-1/
instead of 2-1.
16.
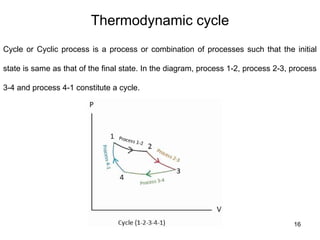
Thermodynamic cycle
16
Cycle orCyclic process is a process or combination of processes such that the initial
state is same as that of the final state. In the diagram, process 1-2, process 2-3, process
3-4 and process 4-1 constitute a cycle.
17.
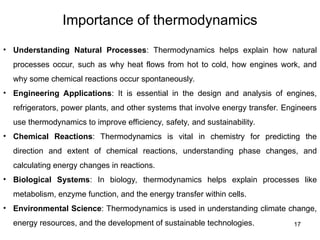
Importance of thermodynamics
17
•Understanding Natural Processes: Thermodynamics helps explain how natural
processes occur, such as why heat flows from hot to cold, how engines work, and
why some chemical reactions occur spontaneously.
• Engineering Applications: It is essential in the design and analysis of engines,
refrigerators, power plants, and other systems that involve energy transfer. Engineers
use thermodynamics to improve efficiency, safety, and sustainability.
• Chemical Reactions: Thermodynamics is vital in chemistry for predicting the
direction and extent of chemical reactions, understanding phase changes, and
calculating energy changes in reactions.
• Biological Systems: In biology, thermodynamics helps explain processes like
metabolism, enzyme function, and the energy transfer within cells.
• Environmental Science: Thermodynamics is used in understanding climate change,
energy resources, and the development of sustainable technologies.
18.
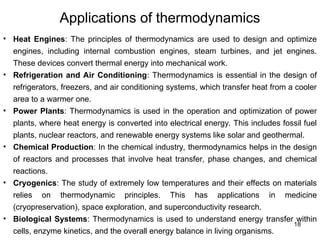
Applications of thermodynamics
18
•Heat Engines: The principles of thermodynamics are used to design and optimize
engines, including internal combustion engines, steam turbines, and jet engines.
These devices convert thermal energy into mechanical work.
• Refrigeration and Air Conditioning: Thermodynamics is essential in the design of
refrigerators, freezers, and air conditioning systems, which transfer heat from a cooler
area to a warmer one.
• Power Plants: Thermodynamics is used in the operation and optimization of power
plants, where heat energy is converted into electrical energy. This includes fossil fuel
plants, nuclear reactors, and renewable energy systems like solar and geothermal.
• Chemical Production: In the chemical industry, thermodynamics helps in the design
of reactors and processes that involve heat transfer, phase changes, and chemical
reactions.
• Cryogenics: The study of extremely low temperatures and their effects on materials
relies on thermodynamic principles. This has applications in medicine
(cryopreservation), space exploration, and superconductivity research.
• Biological Systems: Thermodynamics is used to understand energy transfer within
cells, enzyme kinetics, and the overall energy balance in living organisms.
19.
Thermodynamics-Concluding remarks
19
Thermodynamics isa critical field of study with wide-ranging applications in science,
engineering, and everyday life. Its principles help us understand and harness energy,
design efficient systems, and explore the fundamental nature of the universe.
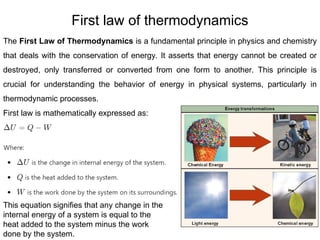
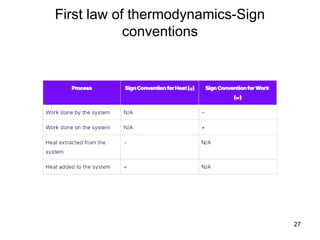
First law ofthermodynamics
21
The First Law of Thermodynamics is a fundamental principle in physics and chemistry
that deals with the conservation of energy. It asserts that energy cannot be created or
destroyed, only transferred or converted from one form to another. This principle is
crucial for understanding the behavior of energy in physical systems, particularly in
thermodynamic processes.
First law is mathematically expressed as:
This equation signifies that any change in the
internal energy of a system is equal to the
heat added to the system minus the work
done by the system.
22.
First law ofthermodynamics
22
The First Law of Thermodynamics essentially restates the law of conservation of energy
for thermodynamic systems. It indicates that energy can change forms (from heat to
work, or to changes in internal energy), but the total energy remains constant. This law is
foundational to many processes in physics, chemistry, engineering, and even biological
systems.
The First Law of Thermodynamics dictates that the total change in internal energy
remains zero because energy cannot be created or destroyed.
23.
First law ofthermodynamics
23
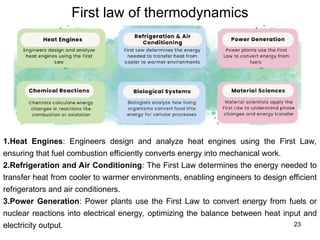
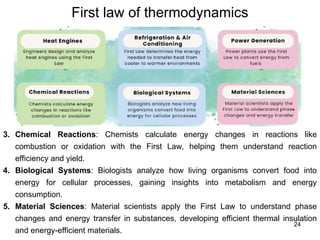
1.Heat Engines: Engineers design and analyze heat engines using the First Law,
ensuring that fuel combustion efficiently converts energy into mechanical work.
2.Refrigeration and Air Conditioning: The First Law determines the energy needed to
transfer heat from cooler to warmer environments, enabling engineers to design efficient
refrigerators and air conditioners.
3.Power Generation: Power plants use the First Law to convert energy from fuels or
nuclear reactions into electrical energy, optimizing the balance between heat input and
electricity output.
24.
First law ofthermodynamics
24
3. Chemical Reactions: Chemists calculate energy changes in reactions like
combustion or oxidation with the First Law, helping them understand reaction
efficiency and yield.
4. Biological Systems: Biologists analyze how living organisms convert food into
energy for cellular processes, gaining insights into metabolism and energy
consumption.
5. Material Sciences: Material scientists apply the First Law to understand phase
changes and energy transfer in substances, developing efficient thermal insulation
and energy-efficient materials.
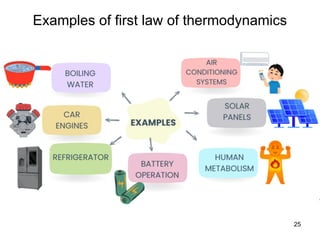
Examples of firstlaw of thermodynamics
26
• Boiling Water: You heat water to add energy, increasing its internal energy and
temperature until it boils.
• Car Engines: An engine burns fuel to convert energy into mechanical work,
propelling the car forward.
• Refrigerators: The refrigerator extracts heat from inside and releases it outside,
using energy to maintain a cool internal temperature.
• Battery Operation: A battery transforms stored chemical energy into electrical
energy, powering devices like flashlights or phones.
• Human Metabolism: Your body converts food into energy to support daily activities
and essential bodily functions.
• Solar Panels: Solar panels absorb sunlight and convert it into electrical energy,
demonstrating the transformation of radiant energy into electricity.
• Air Conditioning Systems: An air conditioner extracts heat from a room and expels
it outside, using work to transfer thermal energy.
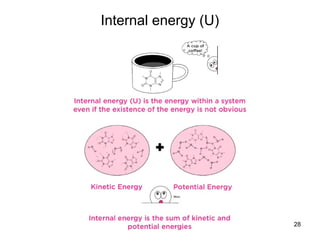
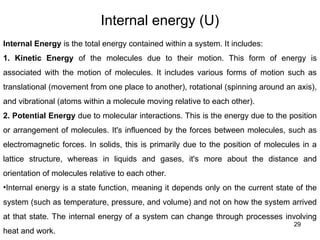
Internal energy (U)
29
InternalEnergy is the total energy contained within a system. It includes:
1. Kinetic Energy of the molecules due to their motion. This form of energy is
associated with the motion of molecules. It includes various forms of motion such as
translational (movement from one place to another), rotational (spinning around an axis),
and vibrational (atoms within a molecule moving relative to each other).
2. Potential Energy due to molecular interactions. This is the energy due to the position
or arrangement of molecules. It's influenced by the forces between molecules, such as
electromagnetic forces. In solids, this is primarily due to the position of molecules in a
lattice structure, whereas in liquids and gases, it's more about the distance and
orientation of molecules relative to each other.
•Internal energy is a state function, meaning it depends only on the current state of the
system (such as temperature, pressure, and volume) and not on how the system arrived
at that state. The internal energy of a system can change through processes involving
heat and work.
30.
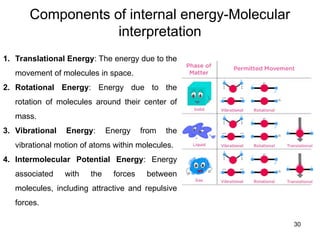
Components of internalenergy-Molecular
interpretation
30
1. Translational Energy: The energy due to the
movement of molecules in space.
2. Rotational Energy: Energy due to the
rotation of molecules around their center of
mass.
3. Vibrational Energy: Energy from the
vibrational motion of atoms within molecules.
4. Intermolecular Potential Energy: Energy
associated with the forces between
molecules, including attractive and repulsive
forces.
31.
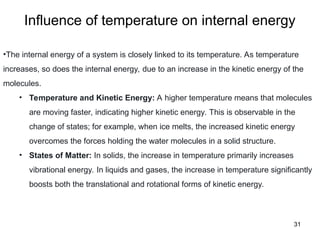
Influence of temperatureon internal energy
31
•The internal energy of a system is closely linked to its temperature. As temperature
increases, so does the internal energy, due to an increase in the kinetic energy of the
molecules.
• Temperature and Kinetic Energy: A higher temperature means that molecules
are moving faster, indicating higher kinetic energy. This is observable in the
change of states; for example, when ice melts, the increased kinetic energy
overcomes the forces holding the water molecules in a solid structure.
• States of Matter: In solids, the increase in temperature primarily increases
vibrational energy. In liquids and gases, the increase in temperature significantly
boosts both the translational and rotational forms of kinetic energy.
32.
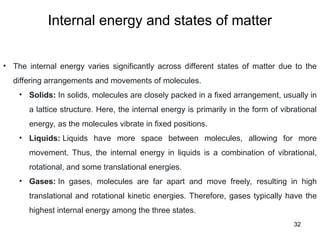
Internal energy andstates of matter
32
• The internal energy varies significantly across different states of matter due to the
differing arrangements and movements of molecules.
• Solids: In solids, molecules are closely packed in a fixed arrangement, usually in
a lattice structure. Here, the internal energy is primarily in the form of vibrational
energy, as the molecules vibrate in fixed positions.
• Liquids: Liquids have more space between molecules, allowing for more
movement. Thus, the internal energy in liquids is a combination of vibrational,
rotational, and some translational energies.
• Gases: In gases, molecules are far apart and move freely, resulting in high
translational and rotational kinetic energies. Therefore, gases typically have the
highest internal energy among the three states.
33.
Changes in internalenergy
33
• Internal energy changes when a system undergoes either a physical or chemical
change. This change can occur due to heating or doing work.
• Physical Changes: These include phase changes like melting, boiling, and
freezing. During these changes, the internal energy changes due to a shift in the
balance between kinetic and potential energies. For instance, during melting, the
increase in kinetic energy overcomes the potential energy holding the solid
structure.
• Chemical Changes: In chemical reactions, the breaking and forming of bonds
involve changes in potential energy, affecting the internal energy of the
substances involved.
34.
Methods of changinginternal energy
34
There are two primary ways to change
the internal energy of a system: heating
and doing work.
•Heating: Adding heat to a system
increases its internal energy by
increasing the kinetic energy of its
molecules. This is evident in heating
processes, where adding heat to water
increases its temperature and
eventually leads to boiling.
•Work: Work can be done on a system
or by a system, leading to a change in
internal energy. For example,
compressing a gas does work on the
system, increasing its internal energy.
35.
Measurement and quantificationof internal
energy
35
• Measuring internal energy directly is challenging because it is a sum of various forms
of microscopic energies. Therefore, it is often quantified indirectly.
• Indirect Measurement: By measuring other properties like temperature,
pressure, and volume, and applying the principles of thermodynamics, the
internal energy of a system can be inferred.
36.
Heat and work
36
Heat(Q)
Heat is a form of energy transfer between a system and its surroundings due to a
temperature difference. When heat is added to a system, it can increase the internal
energy, cause a phase change, or perform work (such as expansion against an external
pressure).
Heat and Temperature
•Temperature is a measure of the average kinetic energy of the particles in a
substance. While heat involves the transfer of energy due to temperature difference,
temperature itself is a measure of the energy state of the particles within the substance.
Work (W)
Work is another form of energy transfer, which occurs when a force is applied over a
distance. In thermodynamics, the most common form of work is pressure-volume work:
When a system expands (ΔV>0), it does work on its surroundings, and W is positive.
Conversely, when the system is compressed (ΔV<0), work is done on the system, and
W is negative.
37.
Applications of thefirst law of
thermodynamics
37
• Isothermal Processes: In an isothermal process, the temperature remains constant
(ΔT=0). For an ideal gas, since U depends only on temperature, ΔU=0. Therefore,
Q=W, meaning all the heat added to the system is used to do work.
• Adiabatic Processes: In an adiabatic process, no heat is exchanged with the
surroundings (Q=0). The first law simplifies to ΔU=−W. Thus, any work done by the
system decreases its internal energy.
• Isochoric Processes: In an isochoric process, the volume remains constant (ΔV=0),
so no work is done (W=0). The first law simplifies to ΔU=Q, meaning all the heat
added to the system changes its internal energy.
• Isobaric Processes: In an isobaric process, the pressure remains constant. Here,
both heat and work contribute to the change in internal energy.
38.
First law ofthermodynamics-Limitations
38
1. Cannot Predict Energy Direction: The First Law asserts that energy cannot be
created or destroyed. It does not, however, indicate the direction in which energy
transformations occur. Therefore, you cannot predict the spontaneous flow of heat or
determine process feasibility.
2. Lacks Information on Efficiency: The First Law quantifies energy changes but
does not account for the quality or efficiency of energy conversion. As a result, it
cannot distinguish between useful work and energy lost as waste heat.
3. No Information on Entropy: The First Law does not address entropy changes,
which play a crucial role in determining process spontaneity. Consequently, it cannot
explain why some processes occur naturally while others require external
intervention.
4. Does Not Apply to Open Systems: The First Law focuses on closed systems that
do not exchange energy or matter. Thus, it is less applicable when analyzing open
systems that continuously exchange energy and matter with their surroundings.
39.
First law ofthermodynamics-Limitations
39
While the First Law is universally applicable, it does not dictate the direction of energy
transfer or the efficiency of energy conversion. These aspects are governed by the
Second Law of Thermodynamics, which introduces the concept of entropy and explains
why certain processes are irreversible and why not all heat can be converted into work.
5. Fails to Consider Irreversibility: The First Law describes energy conservation but
overlooks irreversible processes that increase entropy and reduce the system’s
ability to perform useful work. Thus, you cannot explain why practical systems never
reach 100% efficiency.
Second law ofthermodynamics
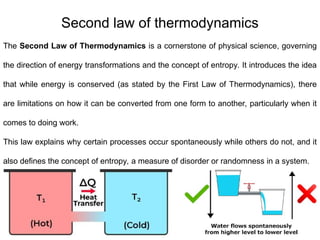
42
The Second Law of Thermodynamics is a cornerstone of physical science, governing
the direction of energy transformations and the concept of entropy. It introduces the idea
that while energy is conserved (as stated by the First Law of Thermodynamics), there
are limitations on how it can be converted from one form to another, particularly when it
comes to doing work.
This law explains why certain processes occur spontaneously while others do not, and it
also defines the concept of entropy, a measure of disorder or randomness in a system.
Statements of thesecond law of
thermodynamics
44
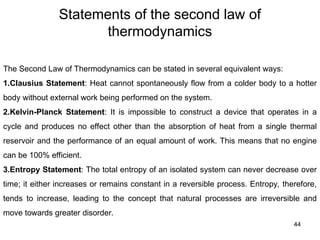
The Second Law of Thermodynamics can be stated in several equivalent ways:
1.Clausius Statement: Heat cannot spontaneously flow from a colder body to a hotter
body without external work being performed on the system.
2.Kelvin-Planck Statement: It is impossible to construct a device that operates in a
cycle and produces no effect other than the absorption of heat from a single thermal
reservoir and the performance of an equal amount of work. This means that no engine
can be 100% efficient.
3.Entropy Statement: The total entropy of an isolated system can never decrease over
time; it either increases or remains constant in a reversible process. Entropy, therefore,
tends to increase, leading to the concept that natural processes are irreversible and
move towards greater disorder.
45.
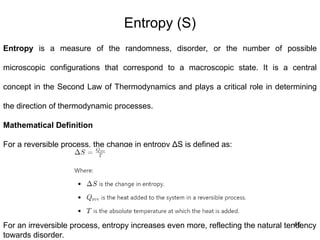
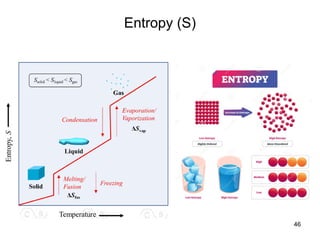
Entropy (S)
45
Entropy isa measure of the randomness, disorder, or the number of possible
microscopic configurations that correspond to a macroscopic state. It is a central
concept in the Second Law of Thermodynamics and plays a critical role in determining
the direction of thermodynamic processes.
Mathematical Definition
For a reversible process, the change in entropy ΔS is defined as:
For an irreversible process, entropy increases even more, reflecting the natural tendency
towards disorder.
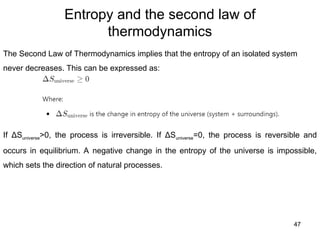
Entropy and thesecond law of
thermodynamics
47
The Second Law of Thermodynamics implies that the entropy of an isolated system
never decreases. This can be expressed as:
If ΔSuniverse>0, the process is irreversible. If ΔSuniverse=0, the process is reversible and
occurs in equilibrium. A negative change in the entropy of the universe is impossible,
which sets the direction of natural processes.
48.
Implications of thesecond law of
thermodynamics
48
• Irreversibility of Natural Processes: The Second Law explains why many
processes are irreversible. For example, when heat flows from a hot object to a cold
one, it cannot spontaneously flow back without external work. This irreversibility is
due to the increase in entropy.
• Heat Engines and Refrigerators: The Second Law sets limits on the efficiency of
heat engines and the performance of refrigerators and heat pumps. In a heat engine,
not all the heat absorbed can be converted into work; some must be released as
waste heat, leading to an increase in entropy. For refrigerators, work must be done to
extract heat from a cold reservoir and expel it to a hot one, which also results in an
overall increase in entropy.
• Spontaneous Processes: The Second Law determines the direction of spontaneous
processes. For example, gas will spontaneously expand to fill a container, and a
mixture of two substances will spontaneously mix. These processes increase the
entropy of the system, making them spontaneous.
• Thermodynamic Equilibrium: At thermodynamic equilibrium, the entropy of a
system is maximized for the given constraints. This means that at equilibrium, no net
macroscopic flows of matter or energy occur, and the system is in a state of
maximum disorder.
49.
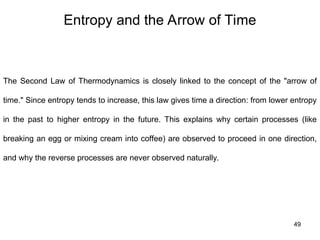
Entropy and theArrow of Time
49
The Second Law of Thermodynamics is closely linked to the concept of the "arrow of
time." Since entropy tends to increase, this law gives time a direction: from lower entropy
in the past to higher entropy in the future. This explains why certain processes (like
breaking an egg or mixing cream into coffee) are observed to proceed in one direction,
and why the reverse processes are never observed naturally.
50.
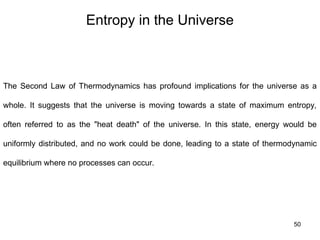
Entropy in theUniverse
50
The Second Law of Thermodynamics has profound implications for the universe as a
whole. It suggests that the universe is moving towards a state of maximum entropy,
often referred to as the "heat death" of the universe. In this state, energy would be
uniformly distributed, and no work could be done, leading to a state of thermodynamic
equilibrium where no processes can occur.
51.
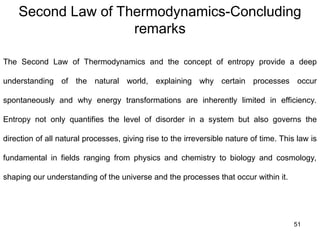
Second Law ofThermodynamics-Concluding
remarks
51
The Second Law of Thermodynamics and the concept of entropy provide a deep
understanding of the natural world, explaining why certain processes occur
spontaneously and why energy transformations are inherently limited in efficiency.
Entropy not only quantifies the level of disorder in a system but also governs the
direction of all natural processes, giving rise to the irreversible nature of time. This law is
fundamental in fields ranging from physics and chemistry to biology and cosmology,
shaping our understanding of the universe and the processes that occur within it.
53
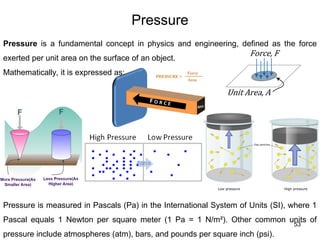
Pressure is afundamental concept in physics and engineering, defined as the force
exerted per unit area on the surface of an object.
Mathematically, it is expressed as:
Pressure
Pressure is measured in Pascals (Pa) in the International System of Units (SI), where 1
Pascal equals 1 Newton per square meter (1 Pa = 1 N/m²). Other common units of
pressure include atmospheres (atm), bars, and pounds per square inch (psi).
54.
54
Example of pressurein real life
• While cutting fruit or a vegetable, a sharp knife is used instead of a blunt one so that
the pressure applied on the fruit is more and the fruits cut easily.
• The nails that are nailed on the wall are very pointy at the end in order to put more
pressure on the wall.
• Porters put a round piece of cloth on their heads in order to increase the area and the
pressure is less so that heavyweights can be applied.
55.
55
Types of pressure
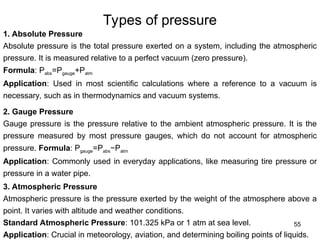
1.Absolute Pressure
Absolute pressure is the total pressure exerted on a system, including the atmospheric
pressure. It is measured relative to a perfect vacuum (zero pressure).
Formula: Pabs=Pgauge+Patm
Application: Used in most scientific calculations where a reference to a vacuum is
necessary, such as in thermodynamics and vacuum systems.
2. Gauge Pressure
Gauge pressure is the pressure relative to the ambient atmospheric pressure. It is the
pressure measured by most pressure gauges, which do not account for atmospheric
pressure. Formula: Pgauge=Pabs−Patm
Application: Commonly used in everyday applications, like measuring tire pressure or
pressure in a water pipe.
3. Atmospheric Pressure
Atmospheric pressure is the pressure exerted by the weight of the atmosphere above a
point. It varies with altitude and weather conditions.
Standard Atmospheric Pressure: 101.325 kPa or 1 atm at sea level.
Application: Crucial in meteorology, aviation, and determining boiling points of liquids.
56.
56
Types of pressure
4.Differential Pressure
Differential pressure is the difference in pressure between two points in a system. It is
used to measure flow rates, pressure drops, and other related phenomena.
Formula: ΔP=P1−P2
Application: Common in fluid dynamics, HVAC systems, and filtration processes.
5. Static Pressure
Static pressure is the pressure exerted by a fluid at rest or when there is no relative
motion between the fluid and the system.
Application: Essential in fluid statics, used in calculating the pressure at a certain depth
in a liquid or in pipelines.
6. Dynamic Pressure
Dynamic pressure is the pressure associated with the movement of a fluid. It is related to
the fluid's velocity and is a component of total pressure in a flowing system.
Formula: Pdynamic=1/2(ρv2
), where ρ is the fluid density and v is the fluid velocity.
Application: Used in Bernoulli's equation and in the analysis of aerodynamic forces on
objects like aircraft wings.
57.
57
Types of pressure
7.Total Pressure
Total pressure (or stagnation pressure) is the sum of static pressure and dynamic
pressure. It represents the pressure a fluid would have if it were brought to a complete
stop. Formula: Ptotal=Pstatic+Pdynamic
Application: Important in aerodynamics and fluid dynamics, particularly in the design of
nozzles and ducts.
8. Vapor Pressure
Vapor pressure is the pressure exerted by a vapor in equilibrium with its liquid or solid
phase at a given temperature.
Application: Critical in phase change processes, like boiling and condensation, and in
understanding the behavior of volatile substances.
9. Partial Pressure
Partial pressure is the pressure that a single component of a mixture of gases would
exert if it occupied the entire volume alone.
Formula: Pi=Xi P
⋅ total
, where Piis the partial pressure, Xi is the mole fraction of the gas,
and Ptotalis the total pressure.
Application: Used in gas mixtures, chemical reactions involving gases, and in
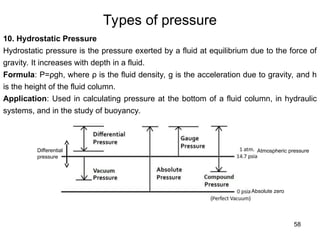
58.
58
Types of pressure
10.Hydrostatic Pressure
Hydrostatic pressure is the pressure exerted by a fluid at equilibrium due to the force of
gravity. It increases with depth in a fluid.
Formula: P=ρgh, where ρ is the fluid density, g is the acceleration due to gravity, and h
is the height of the fluid column.
Application: Used in calculating pressure at the bottom of a fluid column, in hydraulic
systems, and in the study of buoyancy.
Absolute zero
Atmospheric pressure
Differential
pressure
59.
59
Thermodynamic laws involvingpressure
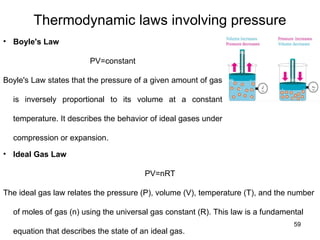
• Ideal Gas Law
PV=nRT
The ideal gas law relates the pressure (P), volume (V), temperature (T), and the number
of moles of gas (n) using the universal gas constant (R). This law is a fundamental
equation that describes the state of an ideal gas.
• Boyle's Law
PV=constant
Boyle's Law states that the pressure of a given amount of gas
is inversely proportional to its volume at a constant
temperature. It describes the behavior of ideal gases under
compression or expansion.
60.
60
Thermodynamic laws involvingpressure
• First Law of Thermodynamics:
ΔU=Q−W
Pressure is involved in the work term (W), which is often expressed as W=PΔV for
processes at constant pressure. This law states that the change in internal energy
(ΔU) of a system is equal to the heat added (Q) minus the work done by the system.
• Second Law of Thermodynamics: This law governs the direction of thermodynamic
processes and the concept of entropy. While pressure does not appear explicitly in
the fundamental equation, it plays a role in the entropy changes during phase
transitions and in determining the spontaneity of processes.
61.
61
Limitations of pressurein thermodynamics
• Non-Ideal Behavior: At very high pressures or low temperatures, real gases do not
follow the ideal gas law. Deviations occur due to intermolecular forces, and more
complex equations of state, like the Van der Waals equation, are needed.
• Measurement Challenges: Accurately measuring pressure in extremely high or low
ranges (e.g., deep-sea environments, outer space) can be challenging due to the
limitations of sensors and instruments.
• Complex Systems: In systems with varying composition, such as mixtures of gases
or multiphase systems, the relationship between pressure, temperature, and volume
becomes more complex, requiring advanced thermodynamic models.
• Dynamic Processes: In rapidly changing or non-equilibrium processes, the
assumption of uniform pressure throughout a system may not hold, complicating the
analysis and prediction of system behavior.
62.
62
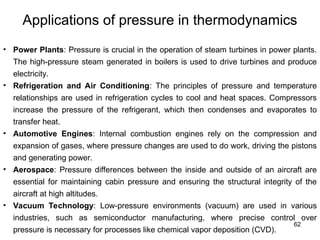
Applications of pressurein thermodynamics
• Power Plants: Pressure is crucial in the operation of steam turbines in power plants.
The high-pressure steam generated in boilers is used to drive turbines and produce
electricity.
• Refrigeration and Air Conditioning: The principles of pressure and temperature
relationships are used in refrigeration cycles to cool and heat spaces. Compressors
increase the pressure of the refrigerant, which then condenses and evaporates to
transfer heat.
• Automotive Engines: Internal combustion engines rely on the compression and
expansion of gases, where pressure changes are used to do work, driving the pistons
and generating power.
• Aerospace: Pressure differences between the inside and outside of an aircraft are
essential for maintaining cabin pressure and ensuring the structural integrity of the
aircraft at high altitudes.
• Vacuum Technology: Low-pressure environments (vacuum) are used in various
industries, such as semiconductor manufacturing, where precise control over
pressure is necessary for processes like chemical vapor deposition (CVD).
63.
63
Pressure-Concluding remarks
Pressure isintegral to understanding and applying thermodynamic principles across a
wide range of scientific and engineering fields. Its role in energy transfer, phase
changes, and the behavior of gases and liquids under different conditions underscores
its importance, while its limitations highlight the complexity of real-world applications.
65
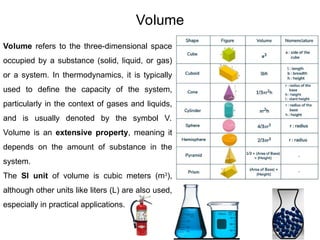
Volume
Volume refers tothe three-dimensional space
occupied by a substance (solid, liquid, or gas)
or a system. In thermodynamics, it is typically
used to define the capacity of the system,
particularly in the context of gases and liquids,
and is usually denoted by the symbol V.
Volume is an extensive property, meaning it
depends on the amount of substance in the
system.
The SI unit of volume is cubic meters (m3
),
although other units like liters (L) are also used,
especially in practical applications.
66.
66
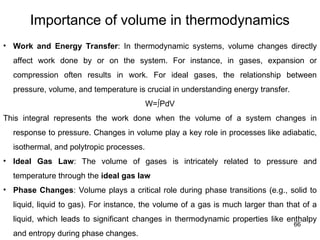
Importance of volumein thermodynamics
• Work and Energy Transfer: In thermodynamic systems, volume changes directly
affect work done by or on the system. For instance, in gases, expansion or
compression often results in work. For ideal gases, the relationship between
pressure, volume, and temperature is crucial in understanding energy transfer.
W=∫PdV
This integral represents the work done when the volume of a system changes in
response to pressure. Changes in volume play a key role in processes like adiabatic,
isothermal, and polytropic processes.
• Ideal Gas Law: The volume of gases is intricately related to pressure and
temperature through the ideal gas law
• Phase Changes: Volume plays a critical role during phase transitions (e.g., solid to
liquid, liquid to gas). For instance, the volume of a gas is much larger than that of a
liquid, which leads to significant changes in thermodynamic properties like enthalpy
and entropy during phase changes.
67.
67
Laws of thermodynamicsand volume
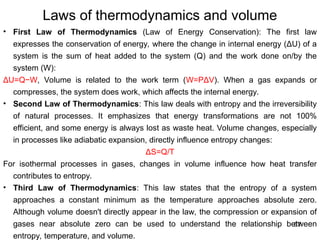
• First Law of Thermodynamics (Law of Energy Conservation): The first law
expresses the conservation of energy, where the change in internal energy (ΔU) of a
system is the sum of heat added to the system (Q) and the work done on/by the
system (W):
ΔU=Q−W, Volume is related to the work term (W=PΔV). When a gas expands or
compresses, the system does work, which affects the internal energy.
• Second Law of Thermodynamics: This law deals with entropy and the irreversibility
of natural processes. It emphasizes that energy transformations are not 100%
efficient, and some energy is always lost as waste heat. Volume changes, especially
in processes like adiabatic expansion, directly influence entropy changes:
ΔS=Q/T
For isothermal processes in gases, changes in volume influence how heat transfer
contributes to entropy.
• Third Law of Thermodynamics: This law states that the entropy of a system
approaches a constant minimum as the temperature approaches absolute zero.
Although volume doesn't directly appear in the law, the compression or expansion of
gases near absolute zero can be used to understand the relationship between
entropy, temperature, and volume.
68.
68
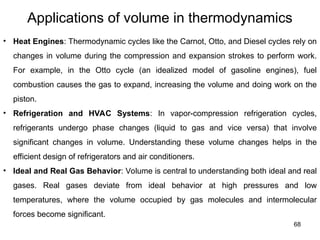
Applications of volumein thermodynamics
• Heat Engines: Thermodynamic cycles like the Carnot, Otto, and Diesel cycles rely on
changes in volume during the compression and expansion strokes to perform work.
For example, in the Otto cycle (an idealized model of gasoline engines), fuel
combustion causes the gas to expand, increasing the volume and doing work on the
piston.
• Refrigeration and HVAC Systems: In vapor-compression refrigeration cycles,
refrigerants undergo phase changes (liquid to gas and vice versa) that involve
significant changes in volume. Understanding these volume changes helps in the
efficient design of refrigerators and air conditioners.
• Ideal and Real Gas Behavior: Volume is central to understanding both ideal and real
gases. Real gases deviate from ideal behavior at high pressures and low
temperatures, where the volume occupied by gas molecules and intermolecular
forces become significant.
69.
69
Applications of volumein thermodynamics
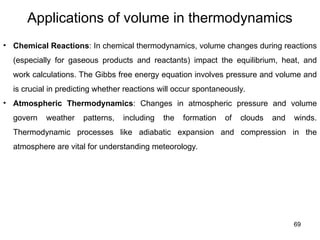
• Chemical Reactions: In chemical thermodynamics, volume changes during reactions
(especially for gaseous products and reactants) impact the equilibrium, heat, and
work calculations. The Gibbs free energy equation involves pressure and volume and
is crucial in predicting whether reactions will occur spontaneously.
• Atmospheric Thermodynamics: Changes in atmospheric pressure and volume
govern weather patterns, including the formation of clouds and winds.
Thermodynamic processes like adiabatic expansion and compression in the
atmosphere are vital for understanding meteorology.
70.
70
Limitations of volumein thermodynamics
• Assumption of Ideal Behavior: Most thermodynamic equations, such as the ideal
gas law, assume ideal behavior. However, real gases deviate from this assumption,
especially at high pressures and low temperatures. In such cases, more complex
models like the van der Waals equation are needed to accurately describe gas
behavior.
• Isothermal vs. Adiabatic Processes: Volume changes in isothermal processes
(constant temperature) behave differently from those in adiabatic processes (no heat
transfer). In adiabatic processes, volume changes can significantly alter temperature,
but the complexity of solving these equations for real-world systems presents
challenges.
• Phase Change Complexity: When a substance undergoes a phase change (e.g.,
boiling, condensation), the relationship between pressure, temperature, and volume
becomes non-linear and complex. Predicting volume changes during such transitions
requires specialized knowledge and cannot be handled by basic thermodynamic
equations.
71.
71
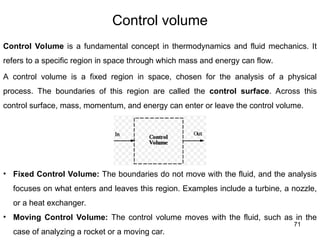
Control volume
Control Volumeis a fundamental concept in thermodynamics and fluid mechanics. It
refers to a specific region in space through which mass and energy can flow.
A control volume is a fixed region in space, chosen for the analysis of a physical
process. The boundaries of this region are called the control surface. Across this
control surface, mass, momentum, and energy can enter or leave the control volume.
• Fixed Control Volume: The boundaries do not move with the fluid, and the analysis
focuses on what enters and leaves this region. Examples include a turbine, a nozzle,
or a heat exchanger.
• Moving Control Volume: The control volume moves with the fluid, such as in the
case of analyzing a rocket or a moving car.
72.
72
Volume-Concluding remarks
Volume isa fundamental property in thermodynamics, playing a key role in energy
transfer, work, and phase transitions. Its importance is reflected in both the theoretical
laws of thermodynamics and their practical applications in engines, refrigeration,
atmospheric science, and more. However, certain limitations, like ideal gas assumptions
and the near-incompressibility of solids and liquids, necessitate advanced models for a
complete understanding.
73.
73
Phase diagrams
A puresubstance may exist in any of the three phases: solid, liquid, and vapour, at
certain temperatures and pressures. When its temperature or pressure changes, a
substance may transition from one phase to another. For example, liquid water at 1 atm
turns into ice when its temperature drops to the freezing point of 0 o
C. The equilibrium
state of a pure substance and its phase transitions are commonly illustrated in phase
diagrams.
75
PV diagram
The PVdiagram is a graphical representation of the relationship between the pressure
(P) and volume (V) of a thermodynamic system, particularly for gases, during various
processes. The diagram is fundamental in thermodynamics for analyzing the behavior of
systems under various conditions, and it plays a crucial role in visualizing the changes in
a system's state during processes such as compression, expansion, or phase
transitions.
PV diagrams originate from the work of James Watt and Sadi Carnot, pioneers in the
development of thermodynamics. Watt’s steam engine brought attention to the
relationship between pressure and volume in real systems, while Carnot laid the
groundwork for modern thermodynamic cycles, introducing the concept of reversible
processes and Carnot cycles, which are central to understanding efficiency.
76.
76
PV diagram
For anideal gas, the relationship between pressure, volume, and temperature is
governed by the ideal gas law: PV=nRT, where: P is the pressure, V is the volume, n is
the number of moles of gas, R is the universal gas constant, and T is the temperature.
In a PV diagram, different thermodynamic processes (e.g., isothermal, isobaric,
adiabatic, and isochoric) are represented by different curves (often called paths), and
the area under these curves can represent the work done by or on the system during a
process.
78
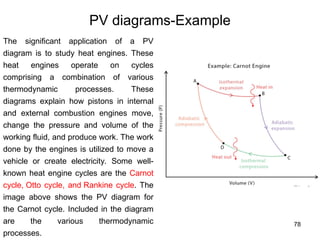
PV diagrams-Example
The significantapplication of a PV
diagram is to study heat engines. These
heat engines operate on cycles
comprising a combination of various
thermodynamic processes. These
diagrams explain how pistons in internal
and external combustion engines move,
change the pressure and volume of the
working fluid, and produce work. The work
done by the engines is utilized to move a
vehicle or create electricity. Some well-
known heat engine cycles are the Carnot
cycle, Otto cycle, and Rankine cycle. The
image above shows the PV diagram for
the Carnot cycle. Included in the diagram
are the various thermodynamic
processes.
79.
79
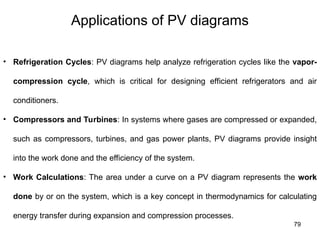
Applications of PVdiagrams
• Refrigeration Cycles: PV diagrams help analyze refrigeration cycles like the vapor-
compression cycle, which is critical for designing efficient refrigerators and air
conditioners.
• Compressors and Turbines: In systems where gases are compressed or expanded,
such as compressors, turbines, and gas power plants, PV diagrams provide insight
into the work done and the efficiency of the system.
• Work Calculations: The area under a curve on a PV diagram represents the work
done by or on the system, which is a key concept in thermodynamics for calculating
energy transfer during expansion and compression processes.
80.
80
Limitations of PVdiagrams
While PV diagrams are powerful tools, they have limitations:
•Ideal Gas Assumption: Many analyses based on PV diagrams assume ideal gas
behavior, which may not hold true for real gases, especially at high pressures or low
temperatures where non-ideal effects (e.g., interactions between gas molecules)
become significant.
•Complexity in Multicomponent Systems: PV diagrams are more challenging to use
when dealing with systems involving mixtures of gases or multicomponent phases, as
they don't readily depict the changes in chemical composition or phase behavior.
•Phase Change Processes: For phase change processes (e.g., boiling or
condensation), PV diagrams are less intuitive than other diagrams like T-s
(Temperature-Entropy) or h-s (Enthalpy-Entropy) diagrams, which provide clearer
insights into the heat transfer and phase transitions.
81.
81
Advanced research anddevelopments in PV
diagrams
• Metastable Phases and Critical Phenomena: PV diagrams are increasingly used to
study metastable states and critical phenomena (e.g., supercritical fluids). These
diagrams help researchers understand critical points where phase boundaries
vanish, and supercritical fluids exhibit properties of both liquids and gases, with
applications in supercritical fluid extraction and power generation.
• Applications in Renewable Energy: PV diagrams are used in the study and
optimization of thermodynamic cycles in renewable energy systems. For instance, in
concentrated solar power (CSP) plants, PV diagrams help improve the efficiency of
Rankine cycles or advanced cycles like the supercritical CO cycle
₂ , used to
convert solar energy into electricity.
82.
82
PV diagrams-Concluding remarks
PVdiagrams remain a fundamental tool in thermodynamics, providing valuable insights
into the behavior of gases and the performance of thermodynamic systems. While the
basic theory of PV diagrams has long been established, advanced research continues to
expand their applicability, particularly in understanding real gases, critical phenomena,
and systems at the nanoscale. Their applications in heat engines, refrigeration cycles,
and power generation make them essential for engineering and scientific analysis,
despite limitations when dealing with complex or non-ideal systems. Advances in
molecular simulations and renewable energy systems continue to push the boundaries
of how PV diagrams are utilized in cutting-edge research.
84
TV diagram
The TVdiagram is a graphical representation that depicts the relationship between
temperature (T) and volume (V) of a thermodynamic system. It is particularly useful for
studying the behavior of substances, especially gases and phase-changing substances
like water, during thermodynamic processes where temperature and volume are key
variables.
In the TV diagram:
•The x-axis represents the specific volume (V), which is the volume per unit mass of
the substance.
•The y-axis represents the temperature (T) of the system.
For an ideal gas, the relationship between temperature, pressure, and volume is
described by the ideal gas law: PV=nRT
By holding the pressure constant, one can analyze how temperature and volume vary,
which can be plotted as a curve on the TV diagram.
85.
85
TV diagram
The TVdiagram has its roots in the study of phase transitions and the behavior of gases
and liquids. Early thermodynamicists, including Rudolf Clausius and James Clerk
Maxwell, explored the behavior of matter under various conditions of temperature and
pressure, leading to the development of concepts like phase diagrams.
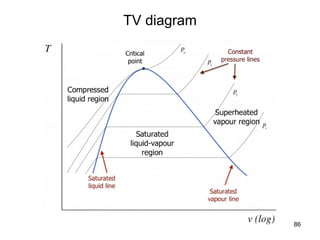
87
TV diagram
• Inmany thermodynamic cycles, a working fluid experiences phase changes between
liquid and vapour in the subcritical zone, such as water in a steam power plant and
R134a in a vapour-compression refrigeration system. The liquid-vapour phase
change can be illustrated in the T−v diagram. In diagrams, we can clearly see the
three regions: compressed liquid region, saturated liquid-vapour region, and
superheated vapour region. The curve that separates the compressed liquid region
and saturated liquid-vapour region is called the saturated liquid line. Any point on the
saturated liquid line represents a saturated liquid state. In a similar fashion, the curve
that lies between the saturated liquid-vapour region and the superheated vapour
region is called the saturated vapour line. Any point on the saturated vapour line
represents a saturated vapour state. The two saturation lines meet at the critical
point.
• The liquid state is commonly called compressed liquid or subcooled liquid, and the
vapour state is commonly called superheated vapour. In the liquid-vapour, two-
phase region, the corresponding isothermal and isobaric processes coincide and
remain as horizontal lines. This indicates that, during the phase change process, both
temperature and pressure remain constant, i.e., T=Tsat and P=Psat.
88.
88
Applications of TVdiagrams
• Phase Change Analysis: TV diagrams are essential for understanding phase
transitions, such as melting, vaporization, and sublimation. They help visualize critical
temperatures, boiling points, and the relationship between volume and temperature in
different phases (solid, liquid, gas).
• Refrigeration and HVAC: TV diagrams are used in the design and optimization of
refrigeration cycles and air conditioning systems. They help engineers understand the
behavior of refrigerants, ensuring efficient phase changes.
• Power Generation: In thermodynamic cycles such as the Rankine cycle (used in
steam power plants) and Brayton cycle (used in gas turbines), TV diagrams help in
analyzing the temperature and volume changes at various points in the cycle. This is
particularly useful for optimizing the efficiency of the system.
• Material Science: TV diagrams are used to study the thermal properties of materials,
particularly during phase transitions like melting or solidification. This is important for
designing materials that can withstand specific thermal conditions in industries such
as aerospace, metallurgy, and chemical engineering.
• Supercritical Fluids: In processes where substances are brought to their
supercritical state (e.g., supercritical CO extraction), the TV diagram helps visualize
₂
how the volume and temperature behave as the fluid crosses the critical point,
transitioning from liquid-like to gas-like behavior.
89.
89
Limitations of TVdiagrams
• Real Gas Behavior: The TV diagram is often based on idealized models of gas
behavior, but real gases exhibit deviations, especially near critical points and at high
pressures. For real gases, corrections must be made using models like the Van der
Waals equation to account for intermolecular forces.
• Multicomponent Systems: TV diagrams become less intuitive for mixtures of gases
or systems with multiple phases. In such cases, phase diagrams (e.g., PV or T-s
diagrams) may provide more useful insights by representing additional variables like
pressure or entropy.
• Phase Boundary Representation: For complex substances, the precise depiction of
phase boundaries (e.g., the liquid-vapor boundary or solid-liquid boundary) on a TV
diagram can be challenging, as they require extensive experimental data to
accurately represent the equilibrium curves.
90.
90
TV diagrams-Concluding remarks
TheTV diagram is a valuable tool in thermodynamics for understanding and visualizing
the relationship between temperature and volume during various processes, particularly
those involving phase changes. From applications in refrigeration, power generation, and
material science to advanced research in critical phenomena and molecular simulations,
the TV diagram continues to play a key role in both theoretical and applied
thermodynamics.
Despite its limitations in dealing with non-ideal gases and multicomponent systems, the
TV diagram is an essential part of the toolkit for engineers and scientists analyzing
thermodynamic systems. Ongoing research into extreme conditions, nanoscale
thermodynamics, and supercritical fluids ensures that the TV diagram will remain a
critical tool for understanding the behavior of substances in increasingly complex
systems.
92
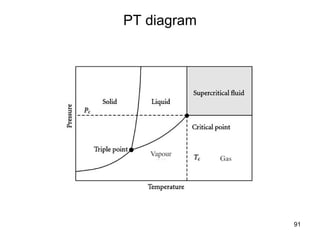
PT diagram
• Ageneric pressure-temperature, P−T diagram is included, from which we can
observe three single-phase regions, three curves representing the two-phase
mixtures, and two unique points: the triple point and the critical point. The single
phase regions are labeled as solid, liquid, and vapour or gas in the P−T diagram. The
liquid and vapour phases are often called compressed liquid and superheated vapour,
respectively.
• In the P−T diagram, the two-phase regions appear as curves separating different
single phases. The curve that lies between the liquid and vapour phases is
called vaporization line. Each point on the vaporization line represents an equilibrium
state of saturation; the substance is either a saturated liquid, a saturated vapour, or a
two-phase liquid-vapour mixture. The temperature and its corresponding pressure at
each point on the vaporization line are called saturation temperature, Tsat, and
saturation pressure, Psat, respectively. Each saturation temperature corresponds to a
unique saturation pressure, and vice versa. A liquid (or vapour) starts to evaporate (or
condense) when its temperature and pressure reach Tsat and Psat.
93.
93
PT diagram
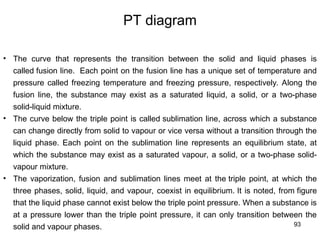
• Thecurve that represents the transition between the solid and liquid phases is
called fusion line. Each point on the fusion line has a unique set of temperature and
pressure called freezing temperature and freezing pressure, respectively. Along the
fusion line, the substance may exist as a saturated liquid, a solid, or a two-phase
solid-liquid mixture.
• The curve below the triple point is called sublimation line, across which a substance
can change directly from solid to vapour or vice versa without a transition through the
liquid phase. Each point on the sublimation line represents an equilibrium state, at
which the substance may exist as a saturated vapour, a solid, or a two-phase solid-
vapour mixture.
• The vaporization, fusion and sublimation lines meet at the triple point, at which the
three phases, solid, liquid, and vapour, coexist in equilibrium. It is noted, from figure
that the liquid phase cannot exist below the triple point pressure. When a substance is
at a pressure lower than the triple point pressure, it can only transition between the
solid and vapour phases.
94.
94
PT diagram
• Thecritical point in the P−T diagram is where the vaporization line ends. The
pressure and temperature at the critical point are called critical pressure, Pc, and
critical temperature, Tc, respectively. A state above the critical point has a
pressure P>Pc and a temperature T>Tc; therefore, it is referred to as a supercritical
state. A substance at a supercritical state is called supercritical fluid, which has a
unique characteristic: no distinct liquid and gas phases can exist anymore in the
supercritical zone (conversely, subcritical zone is P<Pc).
95.
95
Applications of PTdiagrams
• Phase Transitions: PT diagrams are crucial for analyzing phase transitions, such as
melting, boiling, and sublimation. For example, the phase diagram of water shows
how ice melts into liquid water or evaporates into vapor
• Refrigeration and HVAC: PT diagrams are central to understanding the phase
behavior of refrigerants used in air conditioning and refrigeration cycles.
• Material Science: PT diagrams are used to study the thermal stability and phase
behavior of materials, particularly metals, polymers, and ceramics. These diagrams
help in designing materials that can withstand high temperatures or pressures, such
as in aerospace or automotive applications.
• Supercritical Fluids: PT diagrams are used to analyze substances at or near their
critical point, where they enter the supercritical fluid phase. Supercritical CO , for
₂
example, is widely used in extraction processes (e.g., decaffeinating coffee) and as a
working fluid in supercritical power cycles for efficient energy conversion.
96.
96
Limitations of PTdiagrams
• Single-Component Systems: PT diagrams are most useful for pure substances. For
mixtures or multi-component systems, the diagram becomes more complex, and
additional variables like composition or molar fraction are needed. In these cases,
ternary phase diagrams or P-x-T diagrams may be more appropriate for analyzing
phase behavior.
• Simplified Phase Boundaries: PT diagrams generally depict idealized phase
transitions in equilibrium. In real systems, especially under non-equilibrium conditions,
the phase boundaries can shift, making the PT diagram less accurate for predicting
real-world behavior without additional empirical data.
• Non-Ideal Gases: While PT diagrams are useful for understanding phase behavior,
they assume ideal gas behavior for gases, which is not always accurate at high
pressures or low temperatures where non-ideal effects, such as molecular
interactions, become significant.
97.
97
PT diagrams-Concluding remarks
ThePT diagram is an essential tool in thermodynamics, offering valuable insights into
the phase behavior of substances across different pressures and temperatures. It is
critical for studying phase transitions, identifying critical and triple points, and optimizing
processes in fields such as refrigeration, power generation, material science, and
geology.
Although PT diagrams have limitations, particularly when dealing with complex mixtures
or non-equilibrium conditions, they remain fundamental to understanding and designing
systems involving phase changes. Ongoing research into supercritical fluids, multi-
component systems, and materials under extreme conditions ensures that the PT
diagram will continue to play a vital role in both applied thermodynamics and advanced
scientific research. As the field of thermodynamics evolves, PT diagrams will likely be
further refined and expanded to accommodate the growing complexity of modern
materials and systems.
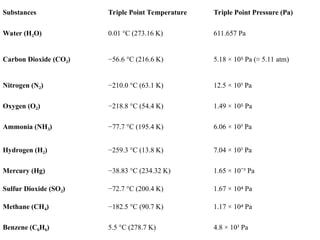
Substances Triple PointTemperature Triple Point Pressure (Pa)
Water (H O)
₂ 0.01 °C (273.16 K) 611.657 Pa
Carbon Dioxide (CO )
₂ −56.6 °C (216.6 K) 5.18 × 10 Pa (≈ 5.11 atm)
⁵
Nitrogen (N )
₂ −210.0 °C (63.1 K) 12.5 × 10³ Pa
Oxygen (O )
₂ −218.8 °C (54.4 K) 1.49 × 10 Pa
⁵
Ammonia (NH )
₃ −77.7 °C (195.4 K) 6.06 × 10³ Pa
Hydrogen (H )
₂ −259.3 °C (13.8 K) 7.04 × 10³ Pa
Mercury (Hg) −38.83 °C (234.32 K) 1.65 × 10 ³ Pa
⁻
Sulfur Dioxide (SO )
₂ −72.7 °C (200.4 K) 1.67 × 10 Pa
⁴
Methane (CH )
₄ −182.5 °C (90.7 K) 1.17 × 10 Pa
⁴
Benzene (C H )
₆ ₆ 5.5 °C (278.7 K) 4.8 × 10³ Pa
102.
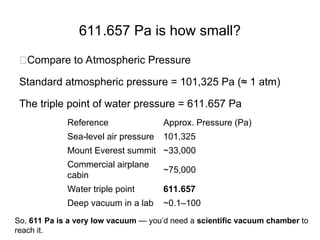
611.657 Pa ishow small?
🔹Compare to Atmospheric Pressure
Standard atmospheric pressure = 101,325 Pa (≈ 1 atm)
The triple point of water pressure = 611.657 Pa
Reference Approx. Pressure (Pa)
Sea-level air pressure 101,325
Mount Everest summit ~33,000
Commercial airplane
cabin
~75,000
Water triple point 611.657
Deep vacuum in a lab ~0.1–100
So, 611 Pa is a very low vacuum — you’d need a scientific vacuum chamber to
reach it.
104
Enthalpy
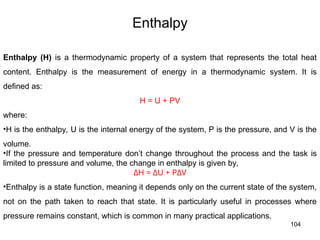
Enthalpy (H) isa thermodynamic property of a system that represents the total heat
content. Enthalpy is the measurement of energy in a thermodynamic system. It is
defined as:
H = U + PV
where:
•H is the enthalpy, U is the internal energy of the system, P is the pressure, and V is the
volume.
•If the pressure and temperature don’t change throughout the process and the task is
limited to pressure and volume, the change in enthalpy is given by,
ΔH = ΔU + PΔV
•Enthalpy is a state function, meaning it depends only on the current state of the system,
not on the path taken to reach that state. It is particularly useful in processes where
pressure remains constant, which is common in many practical applications.
105.
105
Types of enthalpy
1.Standard Enthalpy of Formation (ΔH∘
f)
Definition: The change in enthalpy when one mole of a compound is formed from its
elements in their standard states.
Example: The standard enthalpy of formation of water (H2O) is −285.8 kJ/mol. This
means when one mole of water is formed from hydrogen and oxygen gases, 285.8 kJ of
energy is released.
2. Standard Enthalpy of Combustion (ΔH∘
c
)
Definition: The enthalpy change when one mole of a substance is completely burned in
oxygen under standard conditions.
Example: The standard enthalpy of combustion of methane (CH4
) is −890.3 kJ/mol. This
indicates that burning one mole of methane in oxygen releases 890.3 kJ of energy.
106.
106
3. Enthalpy ofReaction (ΔHrxn)
Definition: The overall change in enthalpy during a chemical reaction.
Example: For the reaction N2(g)+3H2(g)→ 2NH3(g), the enthalpy of reaction is
−92.4 kJ/mol, indicating that the reaction releases 92.4 kJ of energy per mole of
nitrogen.
4. Enthalpy of Vaporization (ΔHvap)
Definition: The enthalpy change required to vaporize one mole of a liquid at constant
pressure.
Example: The enthalpy of vaporization of water is 40.7 kJ/mol. This means it takes 40.7
kJ to convert one mole of liquid water into steam at 100°C and 1 atm pressure.
5. Enthalpy of Fusion (ΔHfus
)
Definition: The enthalpy change required to melt one mole of a solid into a liquid at
constant pressure.
Example: The enthalpy of fusion of ice (water) is 6.01 kJ/mol. This indicates it takes
6.01 kJ to melt one mole of ice at 0°C.
Types of enthalpy
107.
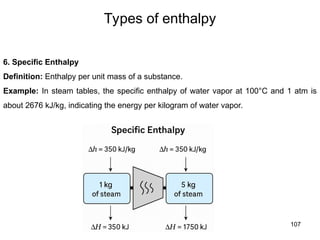
107
6. Specific Enthalpy
Definition:Enthalpy per unit mass of a substance.
Example: In steam tables, the specific enthalpy of water vapor at 100°C and 1 atm is
about 2676 kJ/kg, indicating the energy per kilogram of water vapor.
Types of enthalpy
108.
108
Importance of enthalpy
•Simplification of Energy Calculations: In processes occurring at constant pressure,
the change in enthalpy (ΔH) directly represents the heat exchanged with the
surroundings. This simplifies calculations, as it bypasses the need to account
separately for work done by or on the system.
• Chemical Reactions: Enthalpy is crucial in understanding chemical reactions,
particularly exothermic and endothermic reactions. The heat released or absorbed by
a reaction at constant pressure is directly related to the change in enthalpy.
• Phase Changes: Enthalpy is used to describe phase transitions, such as melting,
boiling, or sublimation, where the energy required or released is termed the latent
heat of the transition (e.g., enthalpy of fusion or vaporization).
• Engineering Applications: In engineering, particularly in the design of heat
exchangers, turbines, compressors, and other thermal systems, enthalpy helps
determine energy efficiency and work potential.
109.
109
Limitations of enthalpy
•Pressure Dependency: While enthalpy is useful in processes at constant pressure, it
becomes less straightforward in systems where pressure varies. Under such
conditions, internal energy and work need to be considered separately.
• No Direct Measure of Work: Enthalpy by itself does not directly account for the work
done by the system other than the work associated with pressure-volume changes.
For processes involving other forms of work (e.g., electrical work), additional
considerations are necessary.
• Limited Applicability in Non-Ideal Conditions: In non-ideal gases and systems
with significant non-mechanical work, the relationship between enthalpy, internal
energy, and heat is more complex, requiring more advanced equations of state and
corrections.
• No Insight into Spontaneity: Enthalpy alone does not determine whether a process
is spontaneous or favorable. For this, Gibbs free energy, which combines enthalpy
and entropy, is used.
110.
110
Applications of enthalpy
•Thermochemistry: Enthalpy is central to thermochemistry, where it is used to
calculate the heat involved in chemical reactions, whether in a lab or industrial setting.
• HVAC Systems: In heating, ventilation, and air conditioning (HVAC) systems,
enthalpy is used to design efficient heating and cooling processes, including the
calculation of energy loads and the performance of heat pumps.
• Power Generation: In power plants, particularly those involving steam turbines,
enthalpy changes are used to determine the efficiency of energy conversion from heat
to work.
• Refrigeration and Air Conditioning: Enthalpy is critical in the analysis of
refrigeration cycles, such as the vapor-compression cycle, where the efficiency of
cooling systems is assessed through enthalpy changes at various stages of the cycle.
• Phase Diagrams: Enthalpy is used in constructing phase diagrams, which map out
the conditions under which different phases of a substance exist, aiding in the
understanding of materials science and metallurgy.
112
Gibbs free energy
Gibbsfree energy and chemical potential are fundamental concepts in thermodynamics
and physical chemistry, closely related to the study of chemical reactions and phase
equilibria.
Gibbs Free Energy (G)
Gibbs free energy (G) is a thermodynamic potential that measures the maximum amount
of reversible work that a system can perform at constant temperature and pressure. It is
particularly useful in predicting the spontaneity of a process.
Definition:
G = H−TS, where:
• G is the Gibbs free energy.
• H is the enthalpy of the system.
• T is the absolute temperature (in Kelvin).
• S is the entropy of the system.
•Spontaneity of a Reaction:
• If ΔG<0, the process is spontaneous.
• If ΔG>0, the process is non-spontaneous.
• If ΔG=0, the system is in equilibrium.
113.
113
Chemical potential (μ)
Thechemical potential (μ) is the partial molar Gibbs free energy of a component in a
mixture. It represents the change in the Gibbs free energy when an additional amount of
substance is introduced into the system, keeping temperature and pressure constant.
At equilibrium, the chemical potential of each component is the same across all phases.
This is why the chemical potential is crucial in phase transitions and reactions.
114.
114
Chemical potential andGibbs free energy
For a single-component system, G=nμ, where n is the number of moles of the
substance.
For a multi-component system, the total Gibbs free energy can be expressed as a sum
of the chemical potentials: G=∑niμi.
This implies that the Gibbs free energy is minimized when the system reaches
equilibrium, and the chemical potentials of each species are equal across the different
phases or components in a reaction.
115.
115
Chemical potential andGibbs free energy-
Concluding remarks
In summary, Gibbs free energy is a criterion for spontaneity and equilibrium in
processes, while chemical potential is the driving force behind changes in the
composition of systems. Both concepts are essential for understanding and predicting
the behavior of chemical systems under various conditions.
117
Helmholtz free energy
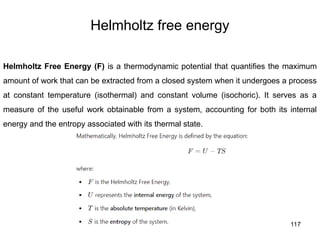
HelmholtzFree Energy (F) is a thermodynamic potential that quantifies the maximum
amount of work that can be extracted from a closed system when it undergoes a process
at constant temperature (isothermal) and constant volume (isochoric). It serves as a
measure of the useful work obtainable from a system, accounting for both its internal
energy and the entropy associated with its thermal state.
118.
118
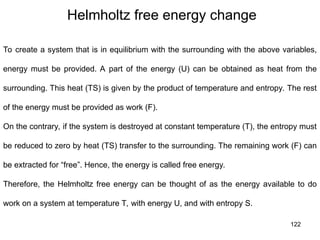
Helmholtz free energy
TheHelmholtz free energy is a state function that
characterizes the aspects of work. It measures the
valuable work obtained from a closed
thermodynamic system at a constant temperature.
At constant temperature or isothermal process, the
system exchanges heat with the surrounding, as
shown in the image below. Either, work is done on
the system and heat is released to the surrounding,
or work is done by the system and heat is absorbed
from the surrounding. Thus, Helmholtz free energy
is a measure of the amount of energy that goes to
create a system once the spontaneous energy
transfer from the surrounding to the system is
accounted for
119.
119
Background of Helmholtzfree energy
The concept of Helmholtz Free Energy was introduced by Hermann von Helmholtz in
1882 to express the balance between energy and entropy in thermodynamic systems. It
plays a central role in statistical mechanics and classical thermodynamics, as it connects
microscopic interactions of particles with macroscopic observables like pressure,
temperature, and work.
The Helmholtz Free Energy is particularly useful in systems that are kept at constant
temperature and volume, such as in laboratory experiments, where these variables can
be controlled. It is used to predict the equilibrium state of a system, and the minimization
of Helmholtz Free Energy corresponds to the equilibrium condition for a system under
isothermal, isochoric (constant volume) conditions. This potential is also essential when
deriving partition functions in statistical mechanics, linking the microscopic energy states
to thermodynamic observables.
120.
120
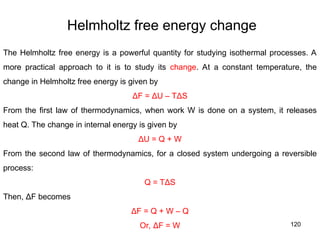
Helmholtz free energychange
The Helmholtz free energy is a powerful quantity for studying isothermal processes. A
more practical approach to it is to study its change. At a constant temperature, the
change in Helmholtz free energy is given by
ΔF = ΔU – TΔS
From the first law of thermodynamics, when work W is done on a system, it releases
heat Q. The change in internal energy is given by
ΔU = Q + W
From the second law of thermodynamics, for a closed system undergoing a reversible
process:
Q = TΔS
Then, ΔF becomes
ΔF = Q + W – Q
Or, ΔF = W
121.
121
Helmholtz free energychange
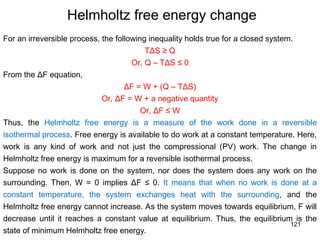
For an irreversible process, the following inequality holds true for a closed system.
TΔS ≥ Q
Or, Q – TΔS ≤ 0
From the ΔF equation,
ΔF = W + (Q – TΔS)
Or, ΔF = W + a negative quantity
Or, ΔF ≤ W
Thus, the Helmholtz free energy is a measure of the work done in a reversible
isothermal process. Free energy is available to do work at a constant temperature. Here,
work is any kind of work and not just the compressional (PV) work. The change in
Helmholtz free energy is maximum for a reversible isothermal process.
Suppose no work is done on the system, nor does the system does any work on the
surrounding. Then, W = 0 implies ΔF ≤ 0. It means that when no work is done at a
constant temperature, the system exchanges heat with the surrounding, and the
Helmholtz free energy cannot increase. As the system moves towards equilibrium, F will
decrease until it reaches a constant value at equilibrium. Thus, the equilibrium is the
state of minimum Helmholtz free energy.
122.
122
Helmholtz free energychange
To create a system that is in equilibrium with the surrounding with the above variables,
energy must be provided. A part of the energy (U) can be obtained as heat from the
surrounding. This heat (TS) is given by the product of temperature and entropy. The rest
of the energy must be provided as work (F).
On the contrary, if the system is destroyed at constant temperature (T), the entropy must
be reduced to zero by heat (TS) transfer to the surrounding. The remaining work (F) can
be extracted for “free”. Hence, the energy is called free energy.
Therefore, the Helmholtz free energy can be thought of as the energy available to do
work on a system at temperature T, with energy U, and with entropy S.
123.
123
Significance of Helmholtzfree energy
• Predicting Spontaneity: Helmholtz Free Energy is instrumental in determining
whether a process or reaction will occur spontaneously under constant temperature
and volume conditions. A decrease in F (ΔF<0) indicates that the process is
thermodynamically favorable.
• Equilibrium Conditions: At equilibrium, the Helmholtz Free Energy reaches a
minimum value for a given temperature and volume. This principle helps in identifying
the stable state of the system.
• Link to Work: F represents the maximum work that can be performed by the system,
excluding any work done against external pressures (since the volume is held
constant).
124.
124
Limitations of Helmholtzfree energy
• Constant Temperature and Volume: Helmholtz Free Energy is specifically
applicable to systems at constant temperature and volume. In practical cases where
pressure or temperature fluctuates, other potentials like the Gibbs Free Energy may
be more appropriate.
• Limited Applicability to Open Systems: The Helmholtz Free Energy does not
account for open systems where particle exchange occurs with the surroundings. For
such cases, the grand canonical potential or Gibbs Free Energy is more relevant.
• Inability to Directly Predict Phase Transitions: Although useful for calculating
energy changes, Helmholtz Free Energy is not always sufficient for analyzing phase
transitions (e.g., solid-liquid transitions), where changes in pressure and chemical
potential are critical.
• Not Suitable for Processes with Variable Volume: For processes involving variable
volume, such as expansions or compressions, the Helmholtz Free Energy is limited,
as it assumes a constant volume constraint.
125.
125
Applications of Helmholtzfree energy
• Statistical Mechanics: Helmholtz Free Energy is critical in statistical mechanics for
deriving the partition function, which relates microscopic states of a system to
macroscopic thermodynamic properties such as internal energy, entropy, and
pressure.
Example: In an ideal gas, the partition function can be used to calculate the Helmholtz
Free Energy, which helps determine properties like heat capacity and pressure at a
given temperature. This is essential for understanding the thermodynamics of gases
at constant volume.
• Solid-State Physics and Lattice Dynamics: Helmholtz Free Energy is used to study
the vibrational properties of solid materials, such as phonon contributions to the
internal energy, particularly at constant volume.
Example: In analyzing the thermal expansion of metals, Helmholtz Free Energy helps
determine the temperature dependence of vibrational modes in crystal lattices.
Minimizing this free energy provides insights into phase transitions and stability of
materials.
126.
126
Applications of Helmholtzfree energy
• Phase Stability and Chemical Reactions: Helmholtz Free Energy helps predict the
phase equilibrium and spontaneous direction of chemical reactions at constant
temperature and volume.
Example: In the reaction of gas mixtures inside a rigid, sealed container, the Helmholtz
Free Energy indicates whether the reaction will occur spontaneously. For example, in
the combustion of hydrogen in oxygen inside a confined space, the free energy
analysis helps assess the energy available to perform work.
• Isothermal Compression in Gas Systems: In thermodynamic processes like the
compression of gases at constant temperature, the Helmholtz Free Energy provides a
measure of the work that can be extracted from the system.
Example: Consider a piston compressing a gas in a cylinder at constant temperature.
The decrease in volume increases the Helmholtz Free Energy, and the difference
between the initial and final states gives the amount of work that can be done by or on
the system.
128
Helmholtz free energy-Concludingremarks
In summary, Helmholtz Free Energy provides a fundamental framework for analyzing
thermodynamic systems at constant temperature and volume. Despite its limitations, it is
invaluable in predicting system behavior in a range of physical, chemical, and biological
processes.