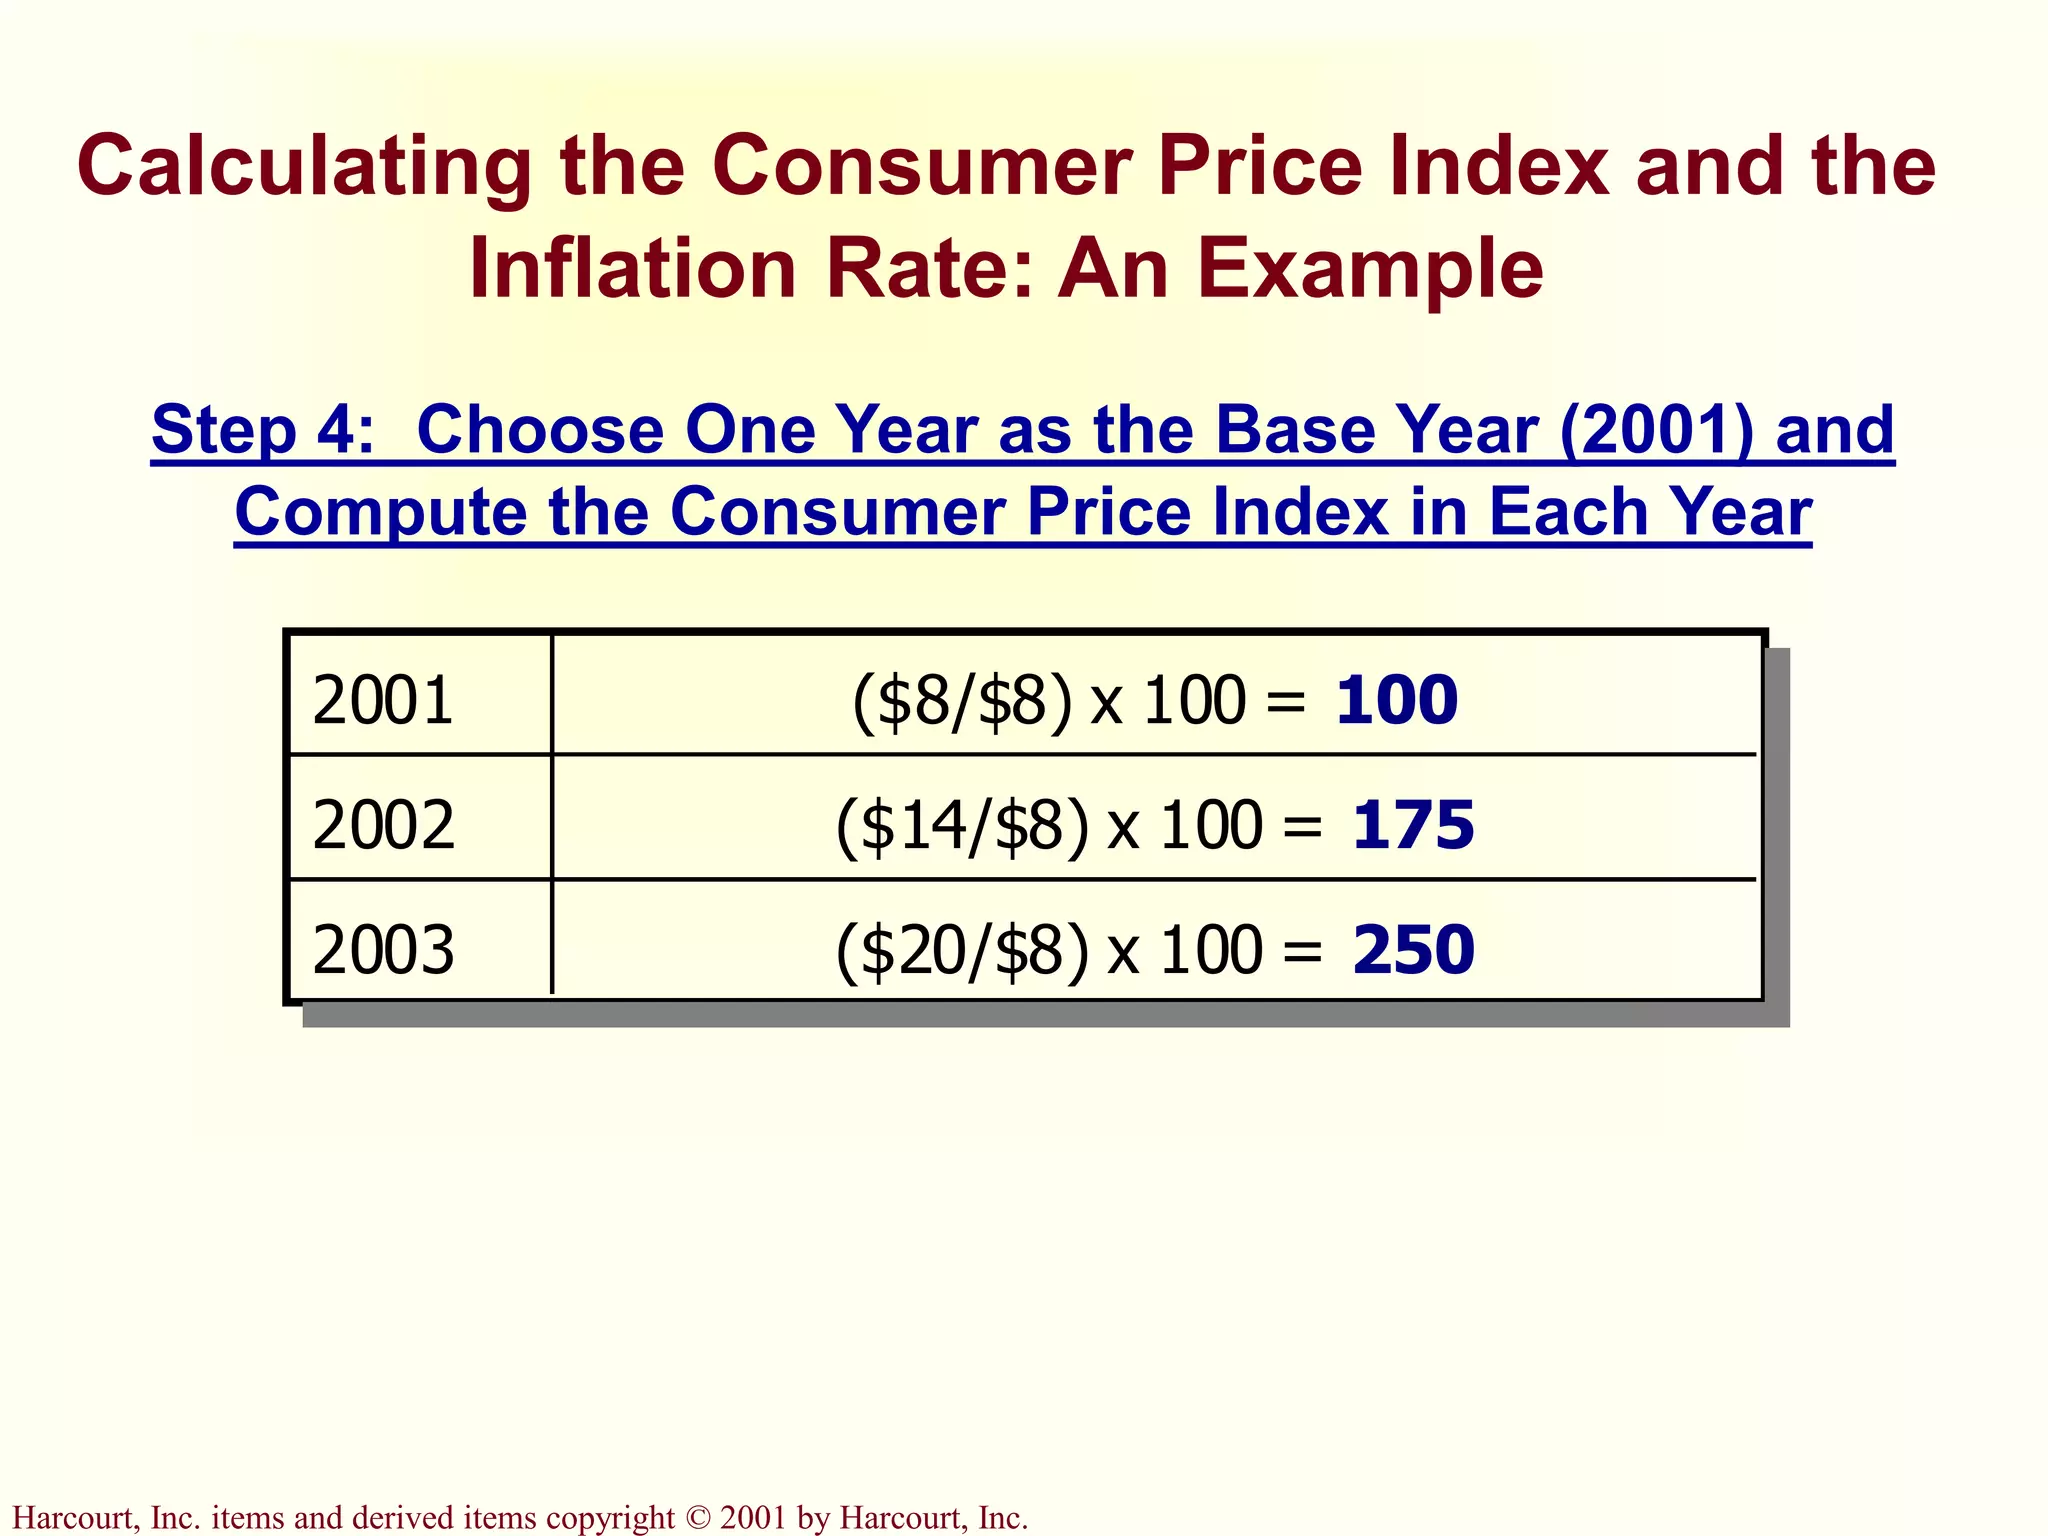
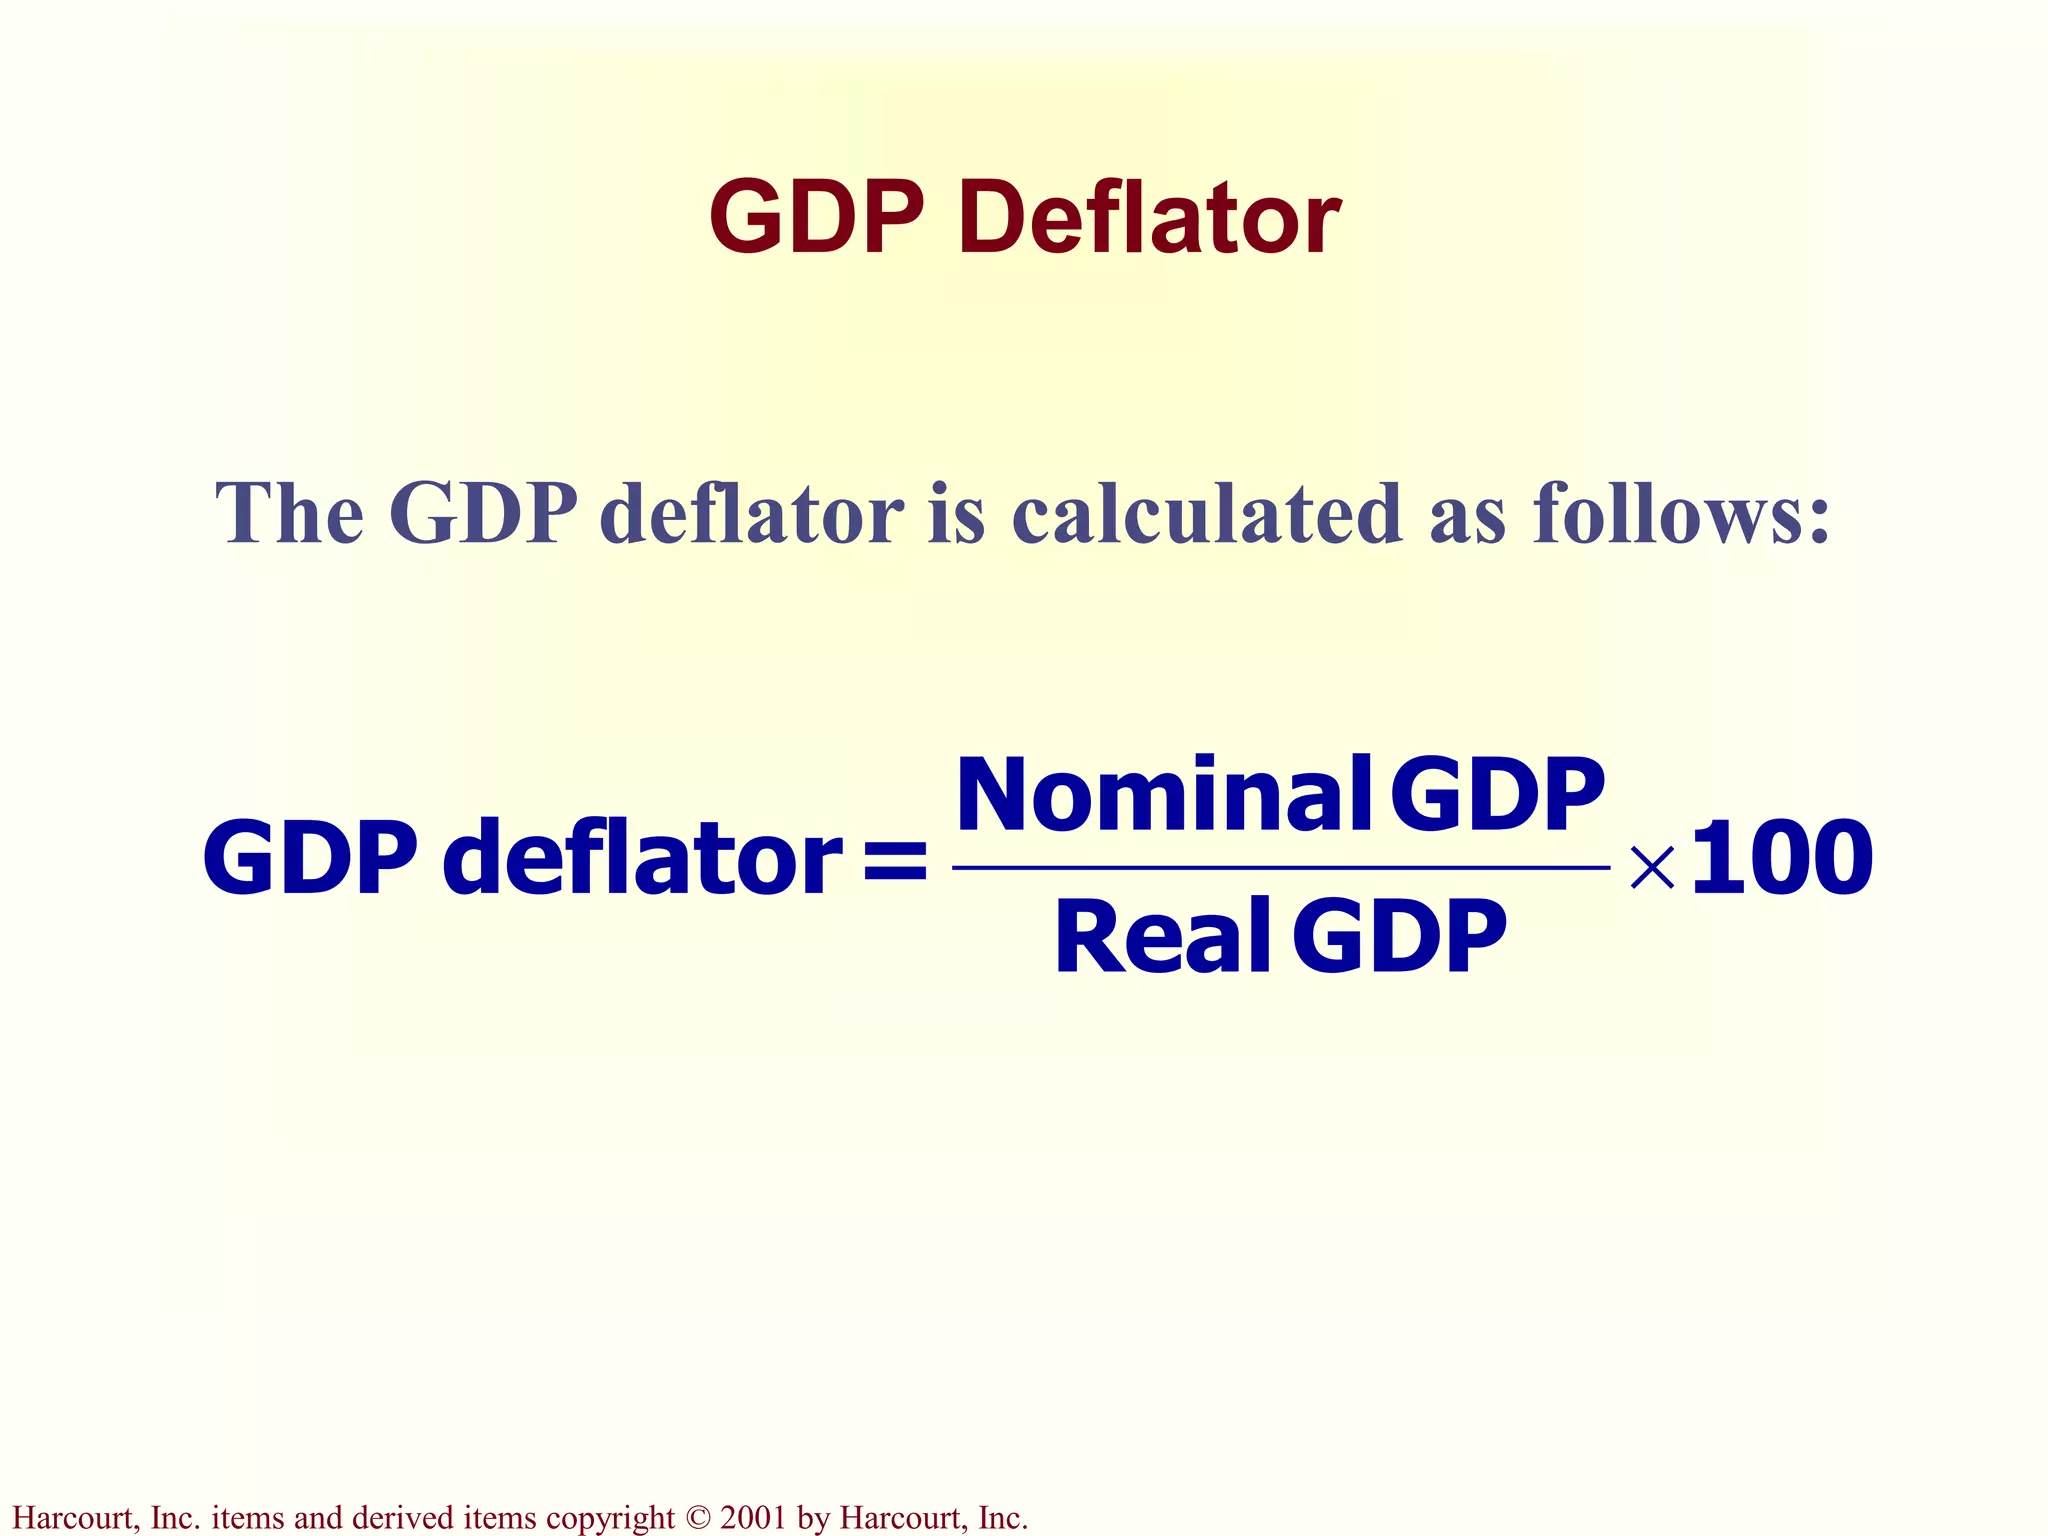
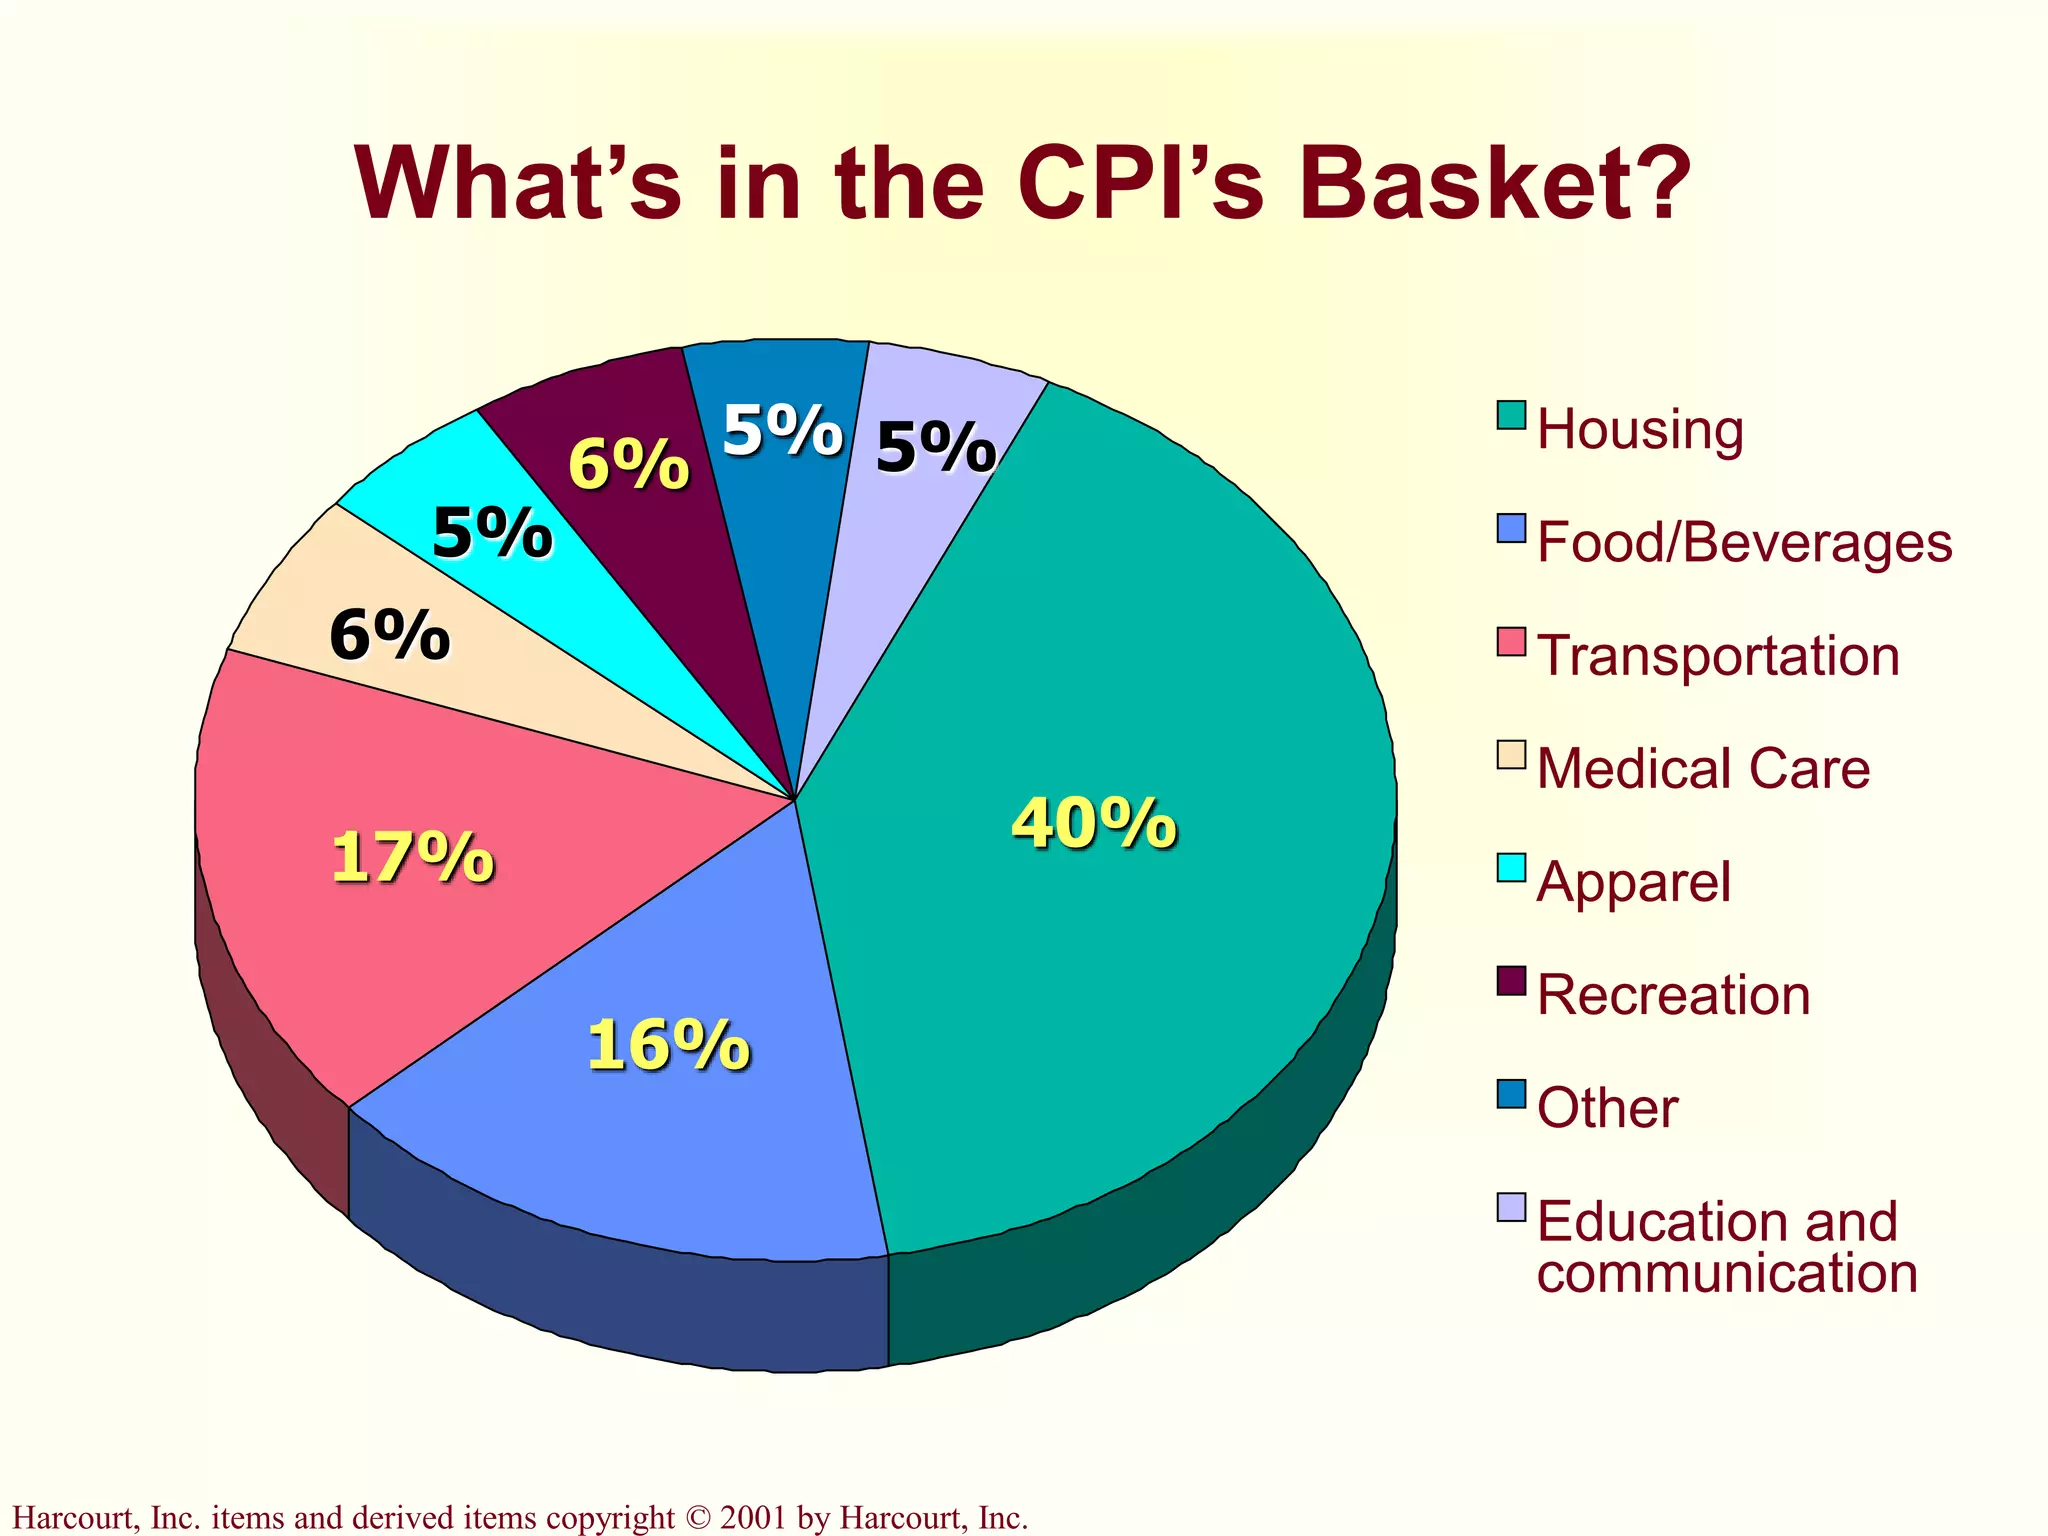
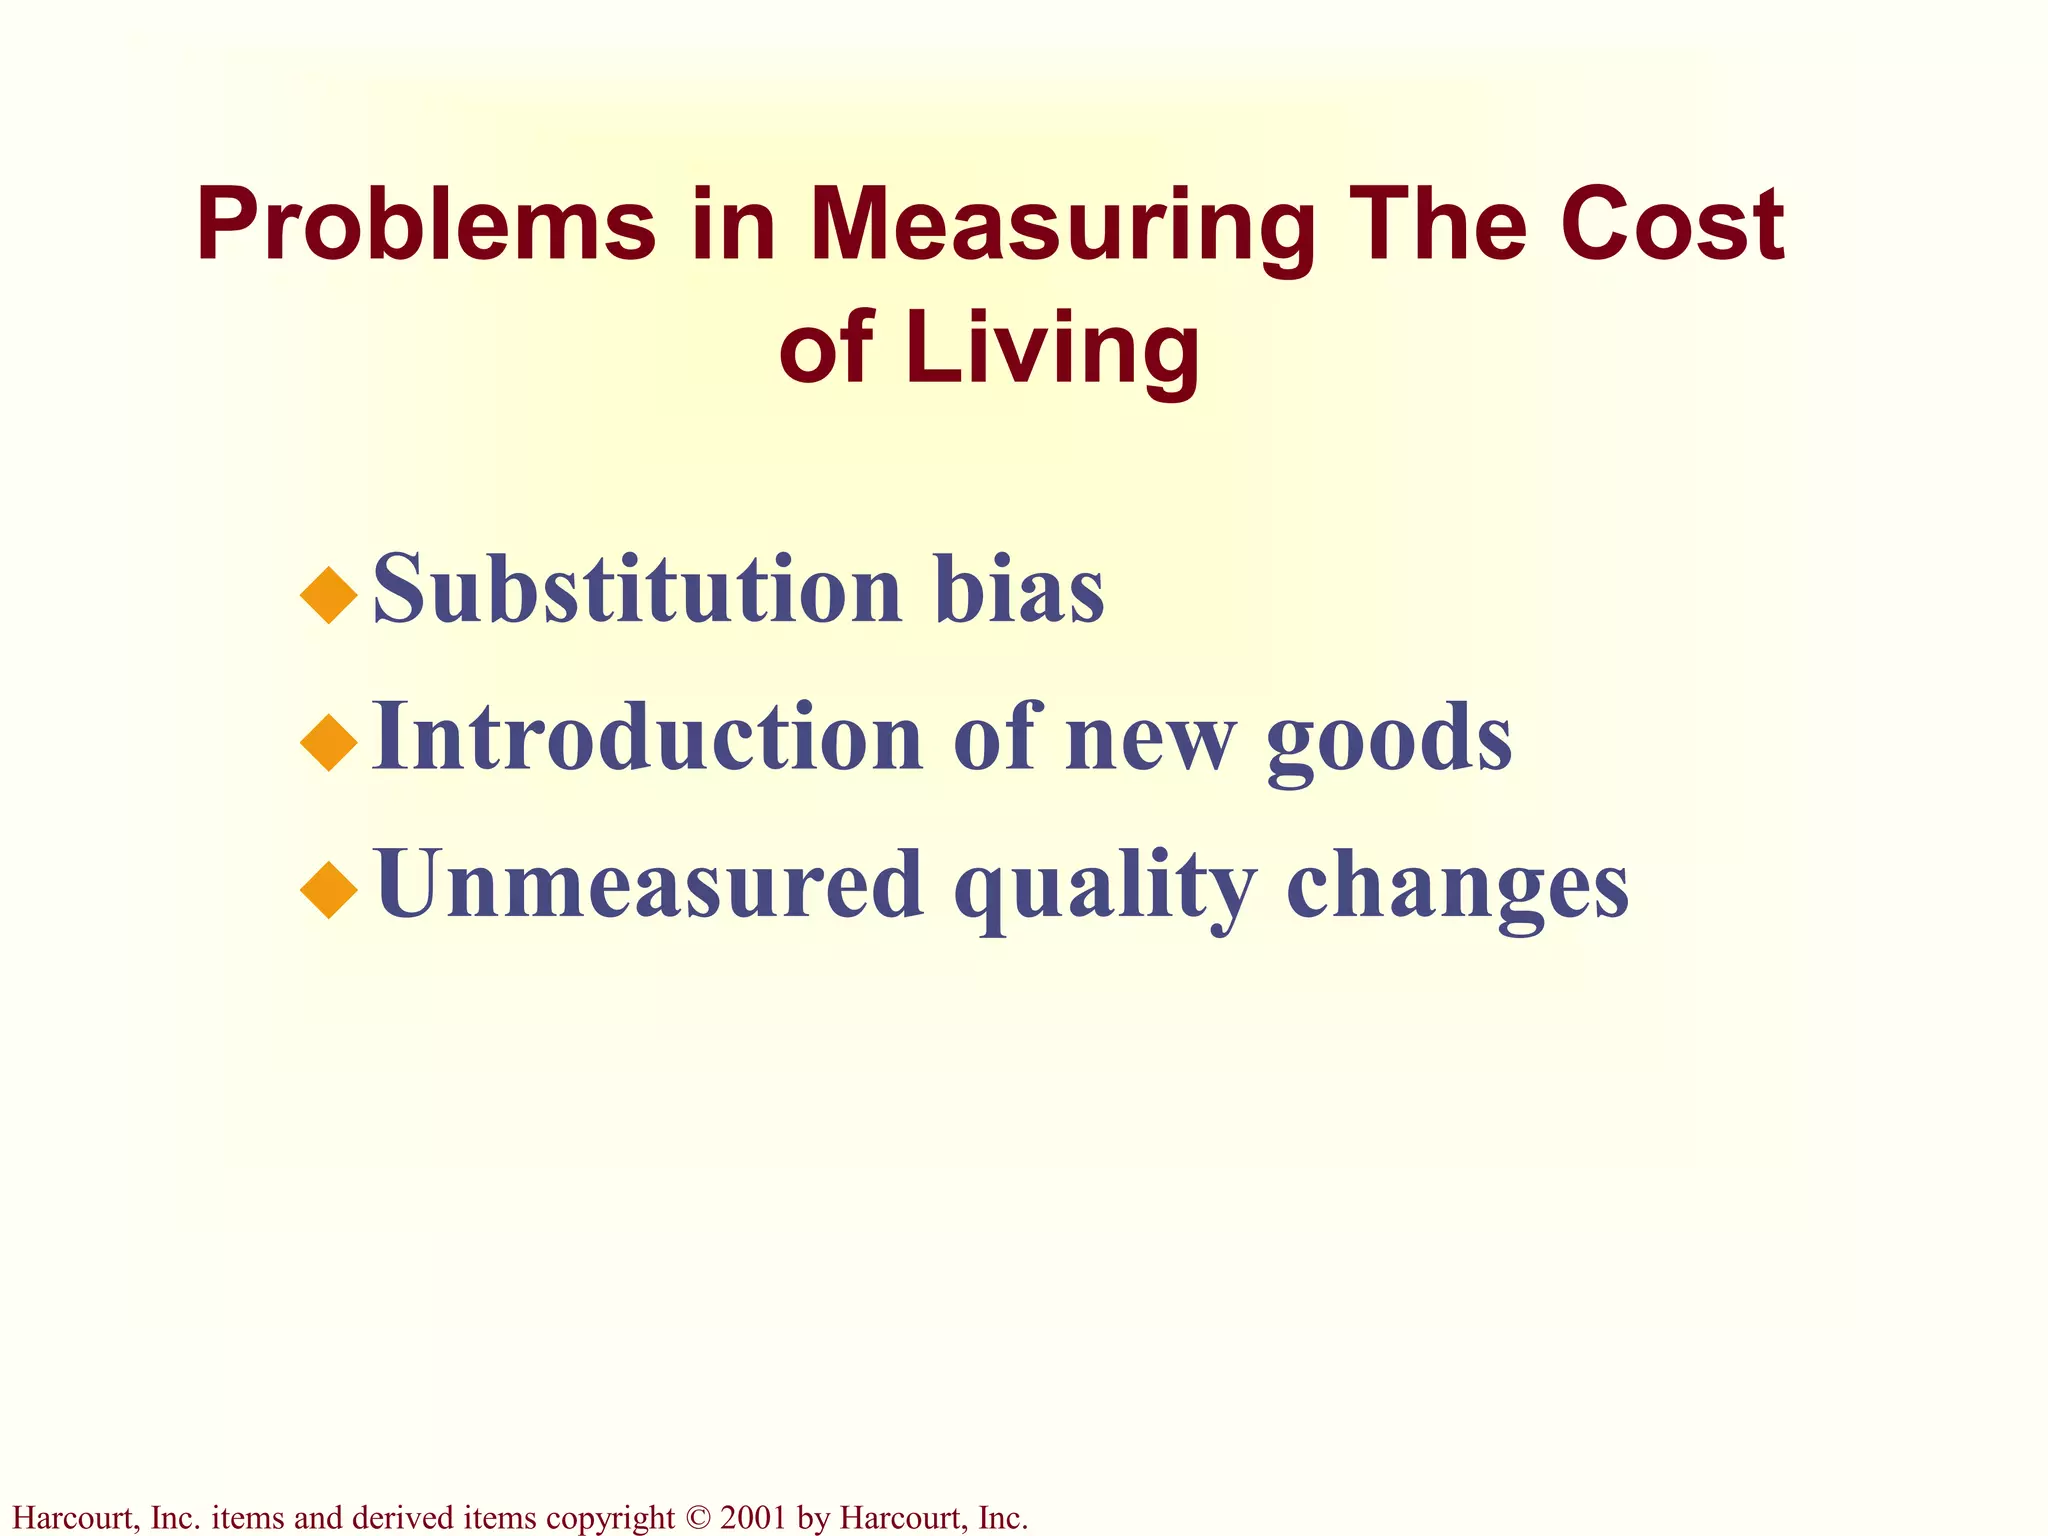
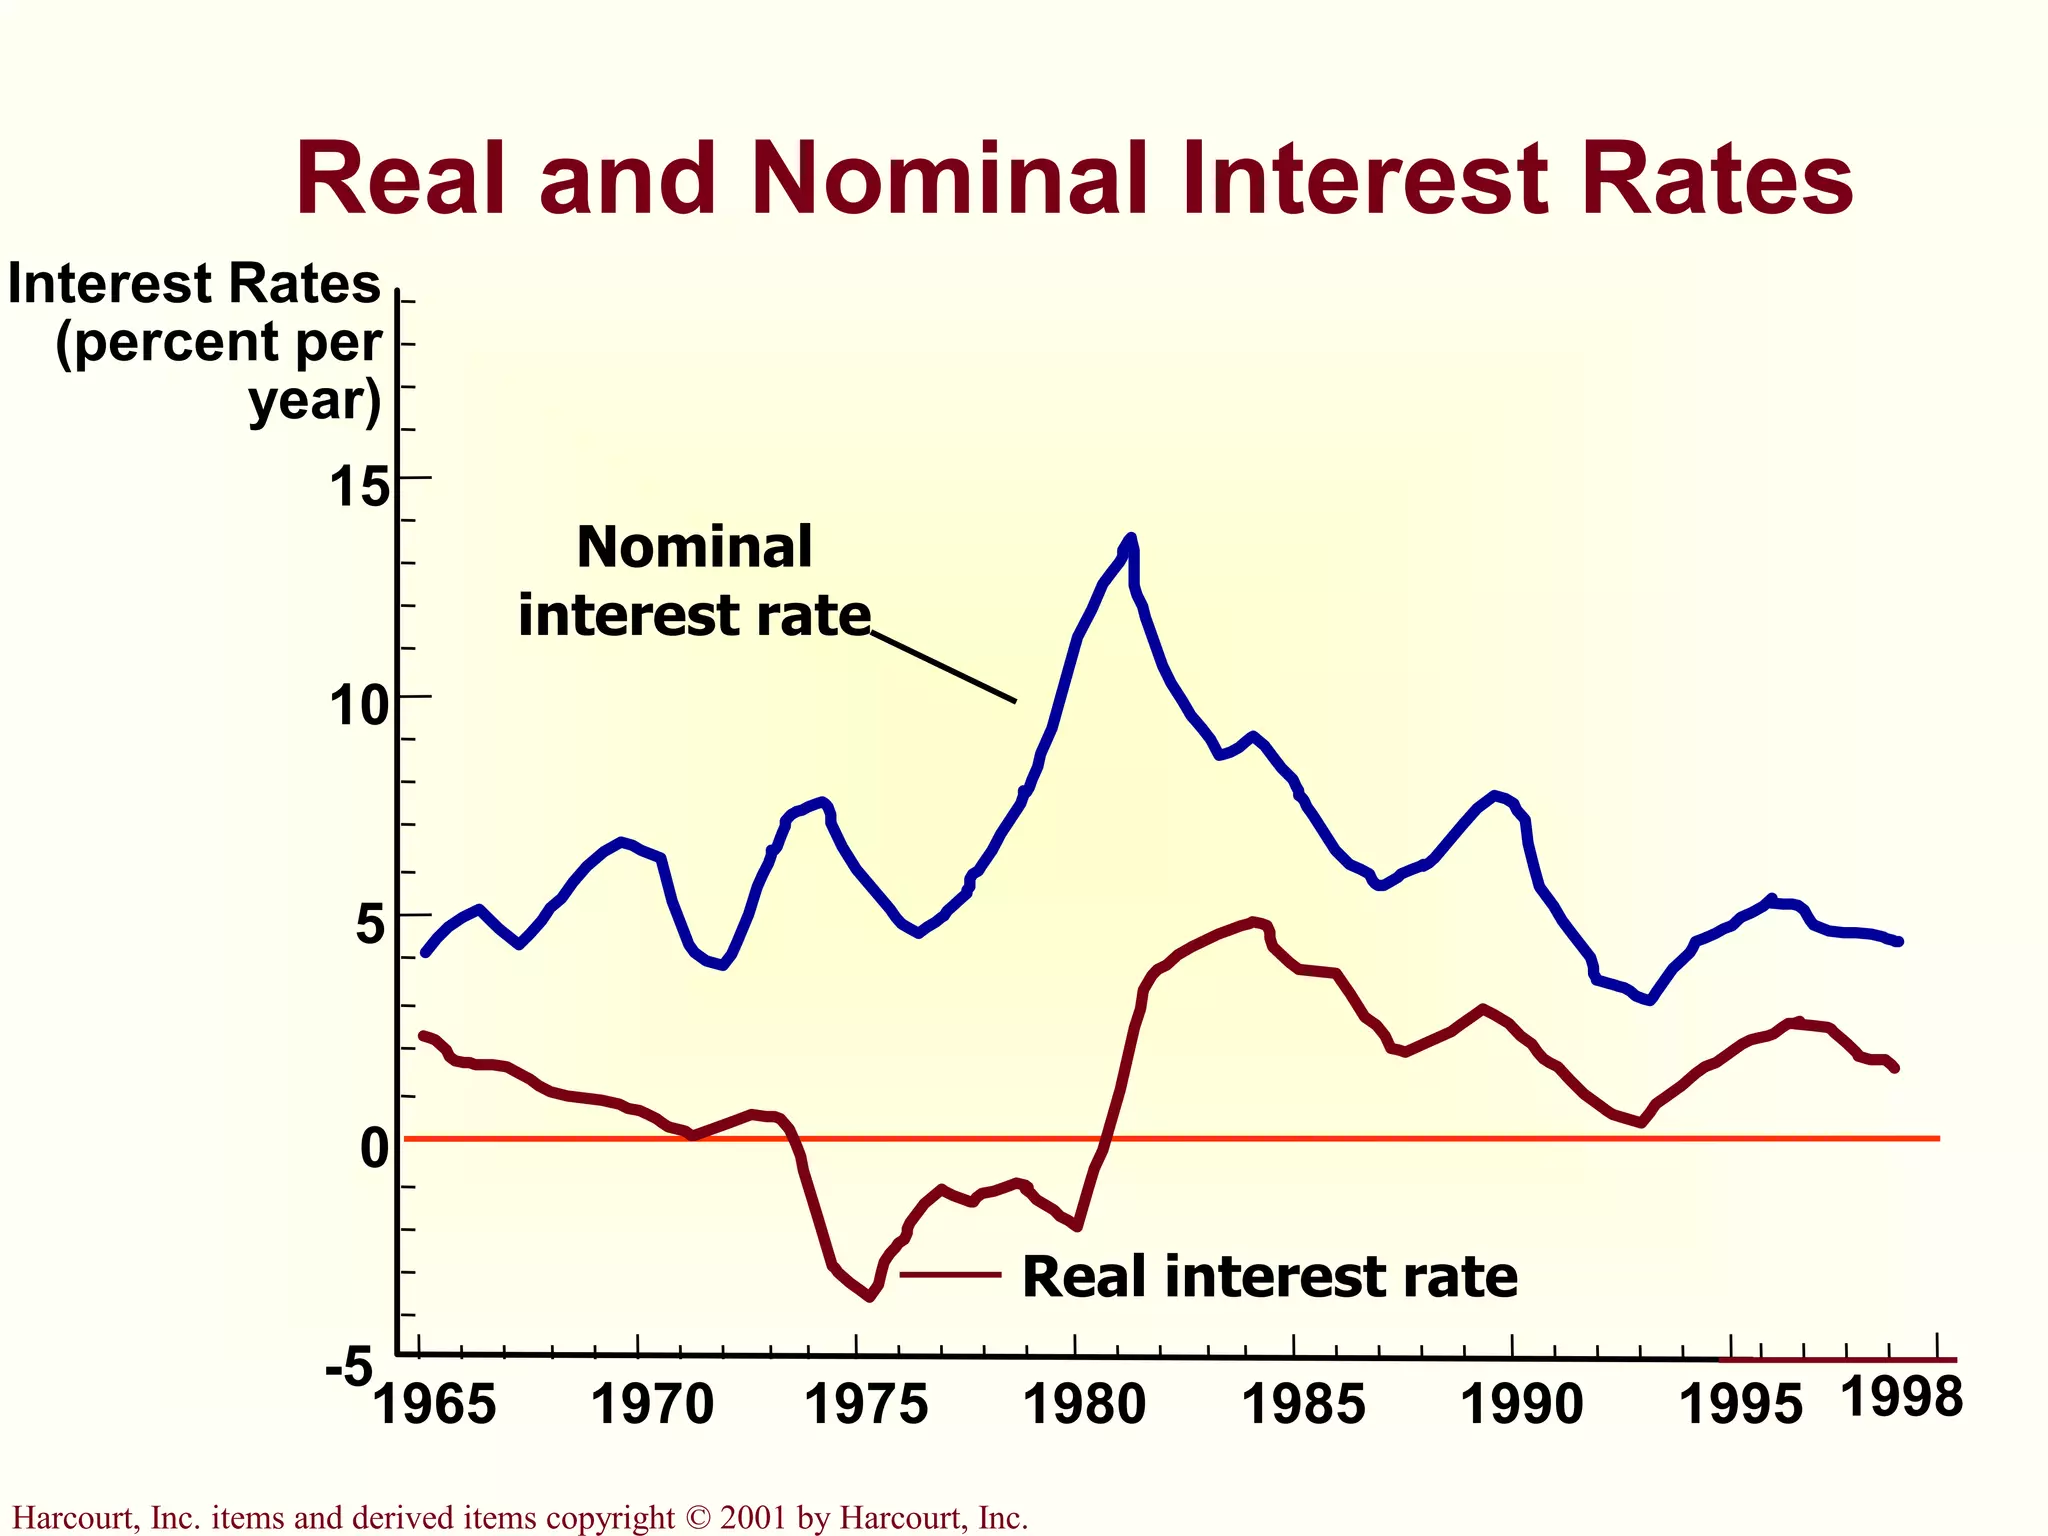
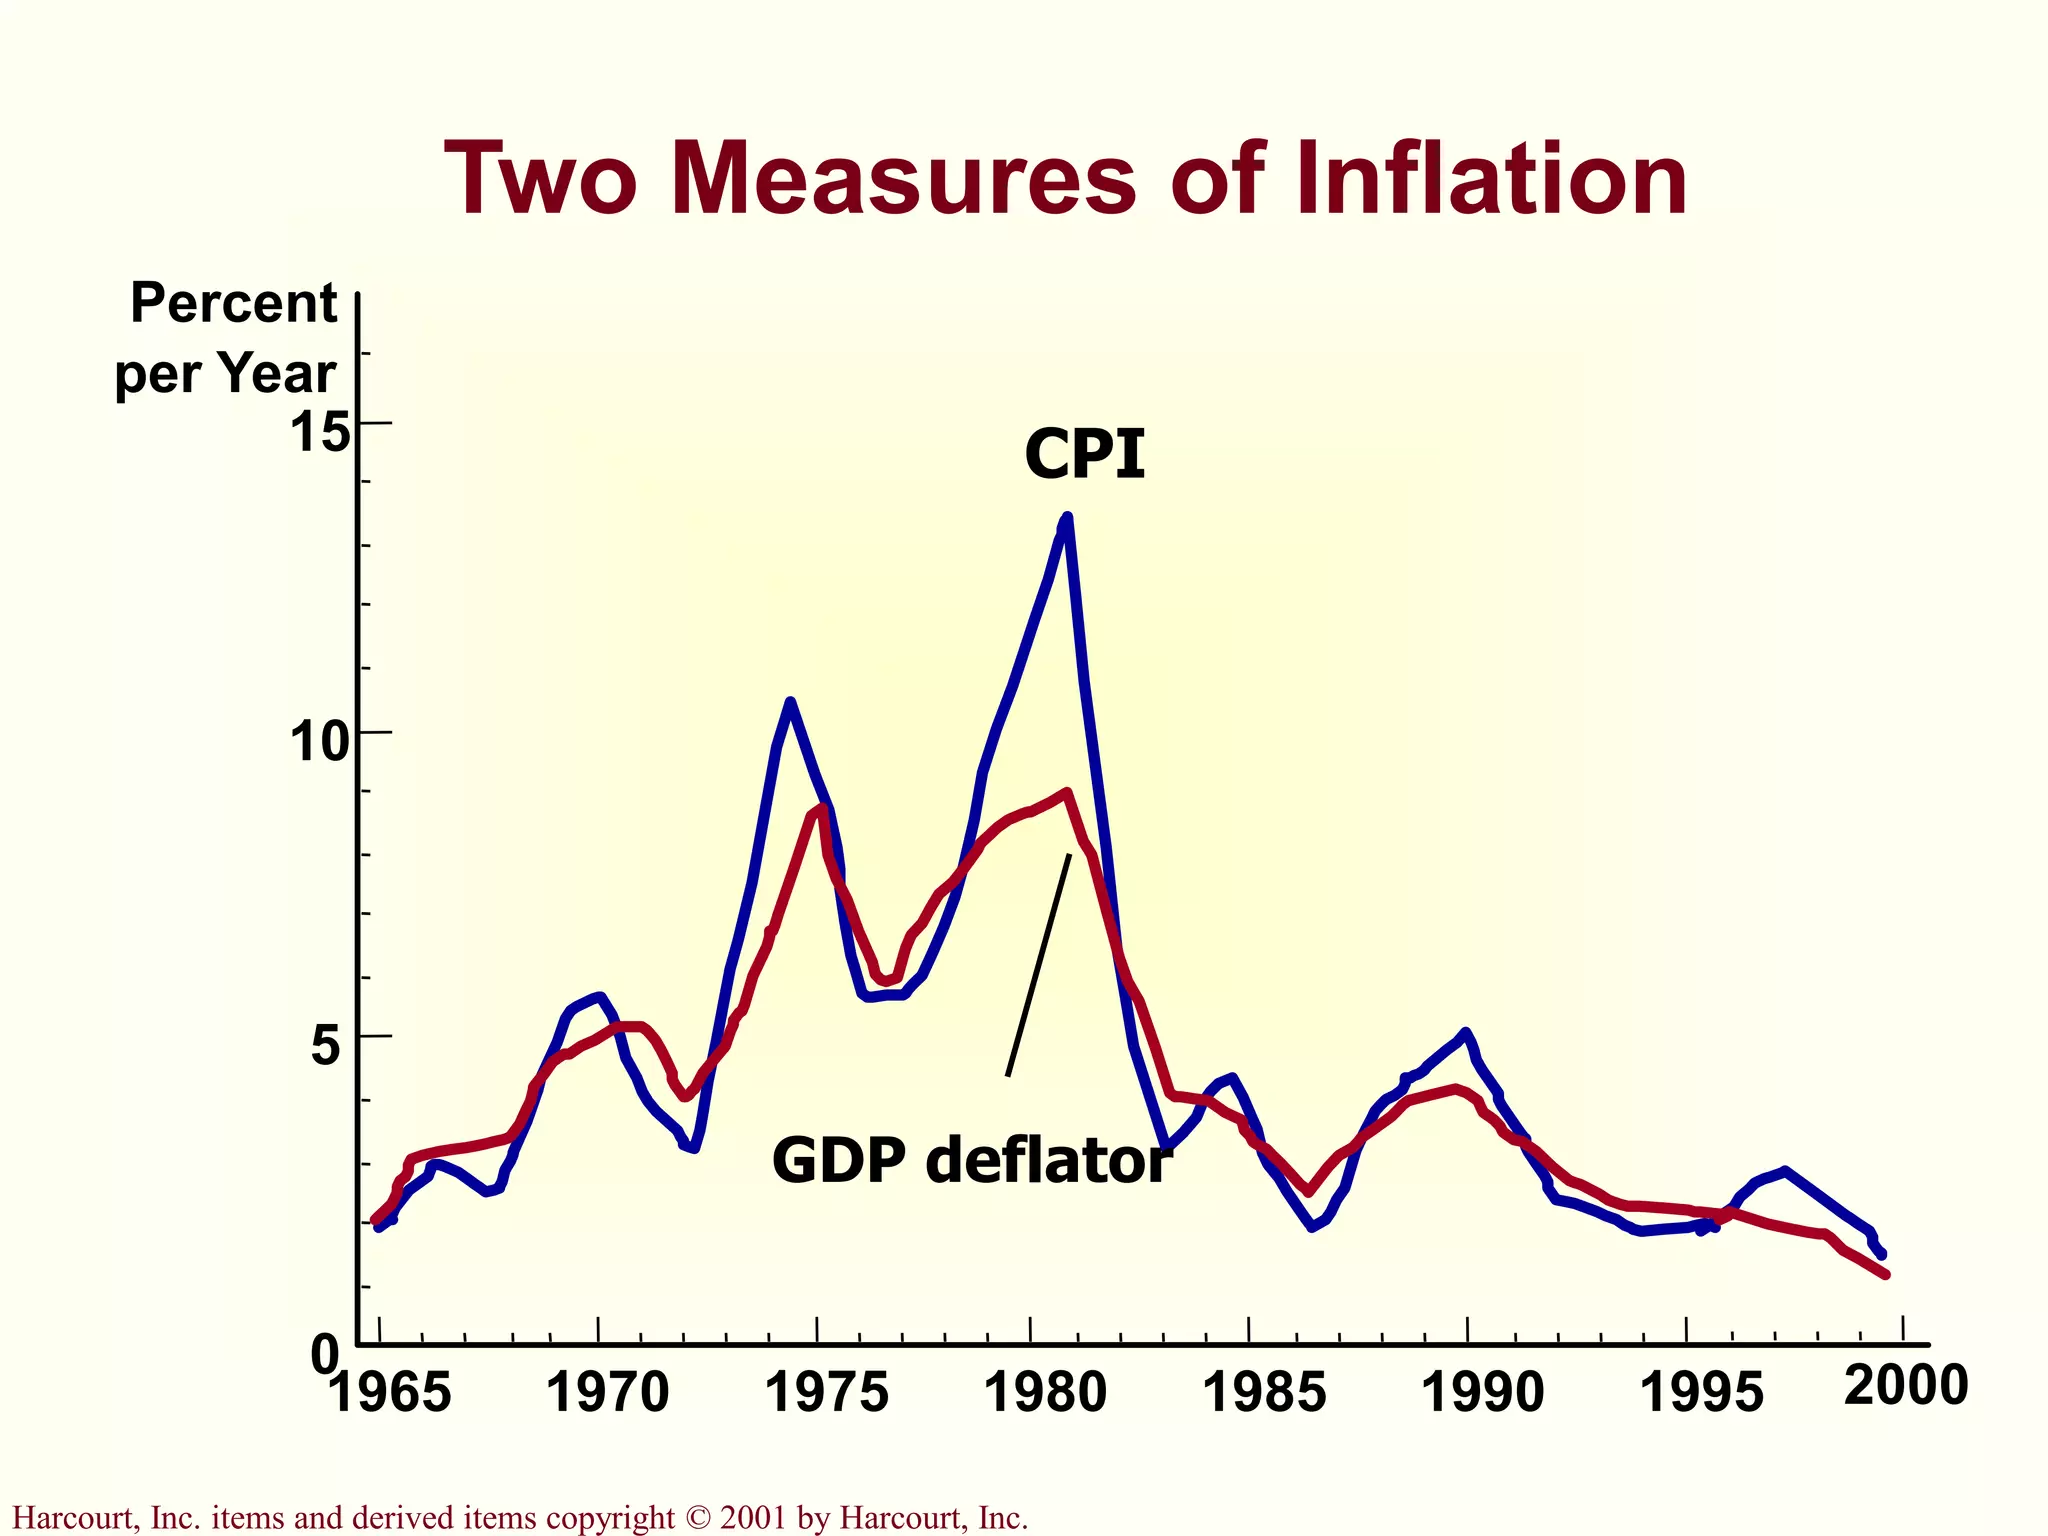
The document discusses how the Consumer Price Index (CPI) is used to measure inflation and changes in the cost of living over time. The CPI tracks the prices of goods and services in a fixed market basket that represents a typical consumer's purchases. It is calculated by the Bureau of Labor Statistics and reported monthly. While the CPI provides an important measure of inflation, it has limitations as it does not fully account for consumer substitution between goods, quality changes, or new products entering the market. The GDP deflator is an alternative price index that measures prices of all domestic production rather than consumer purchases.