

Uploaded byHjalmar van Marle
Change & Productivity in Europe
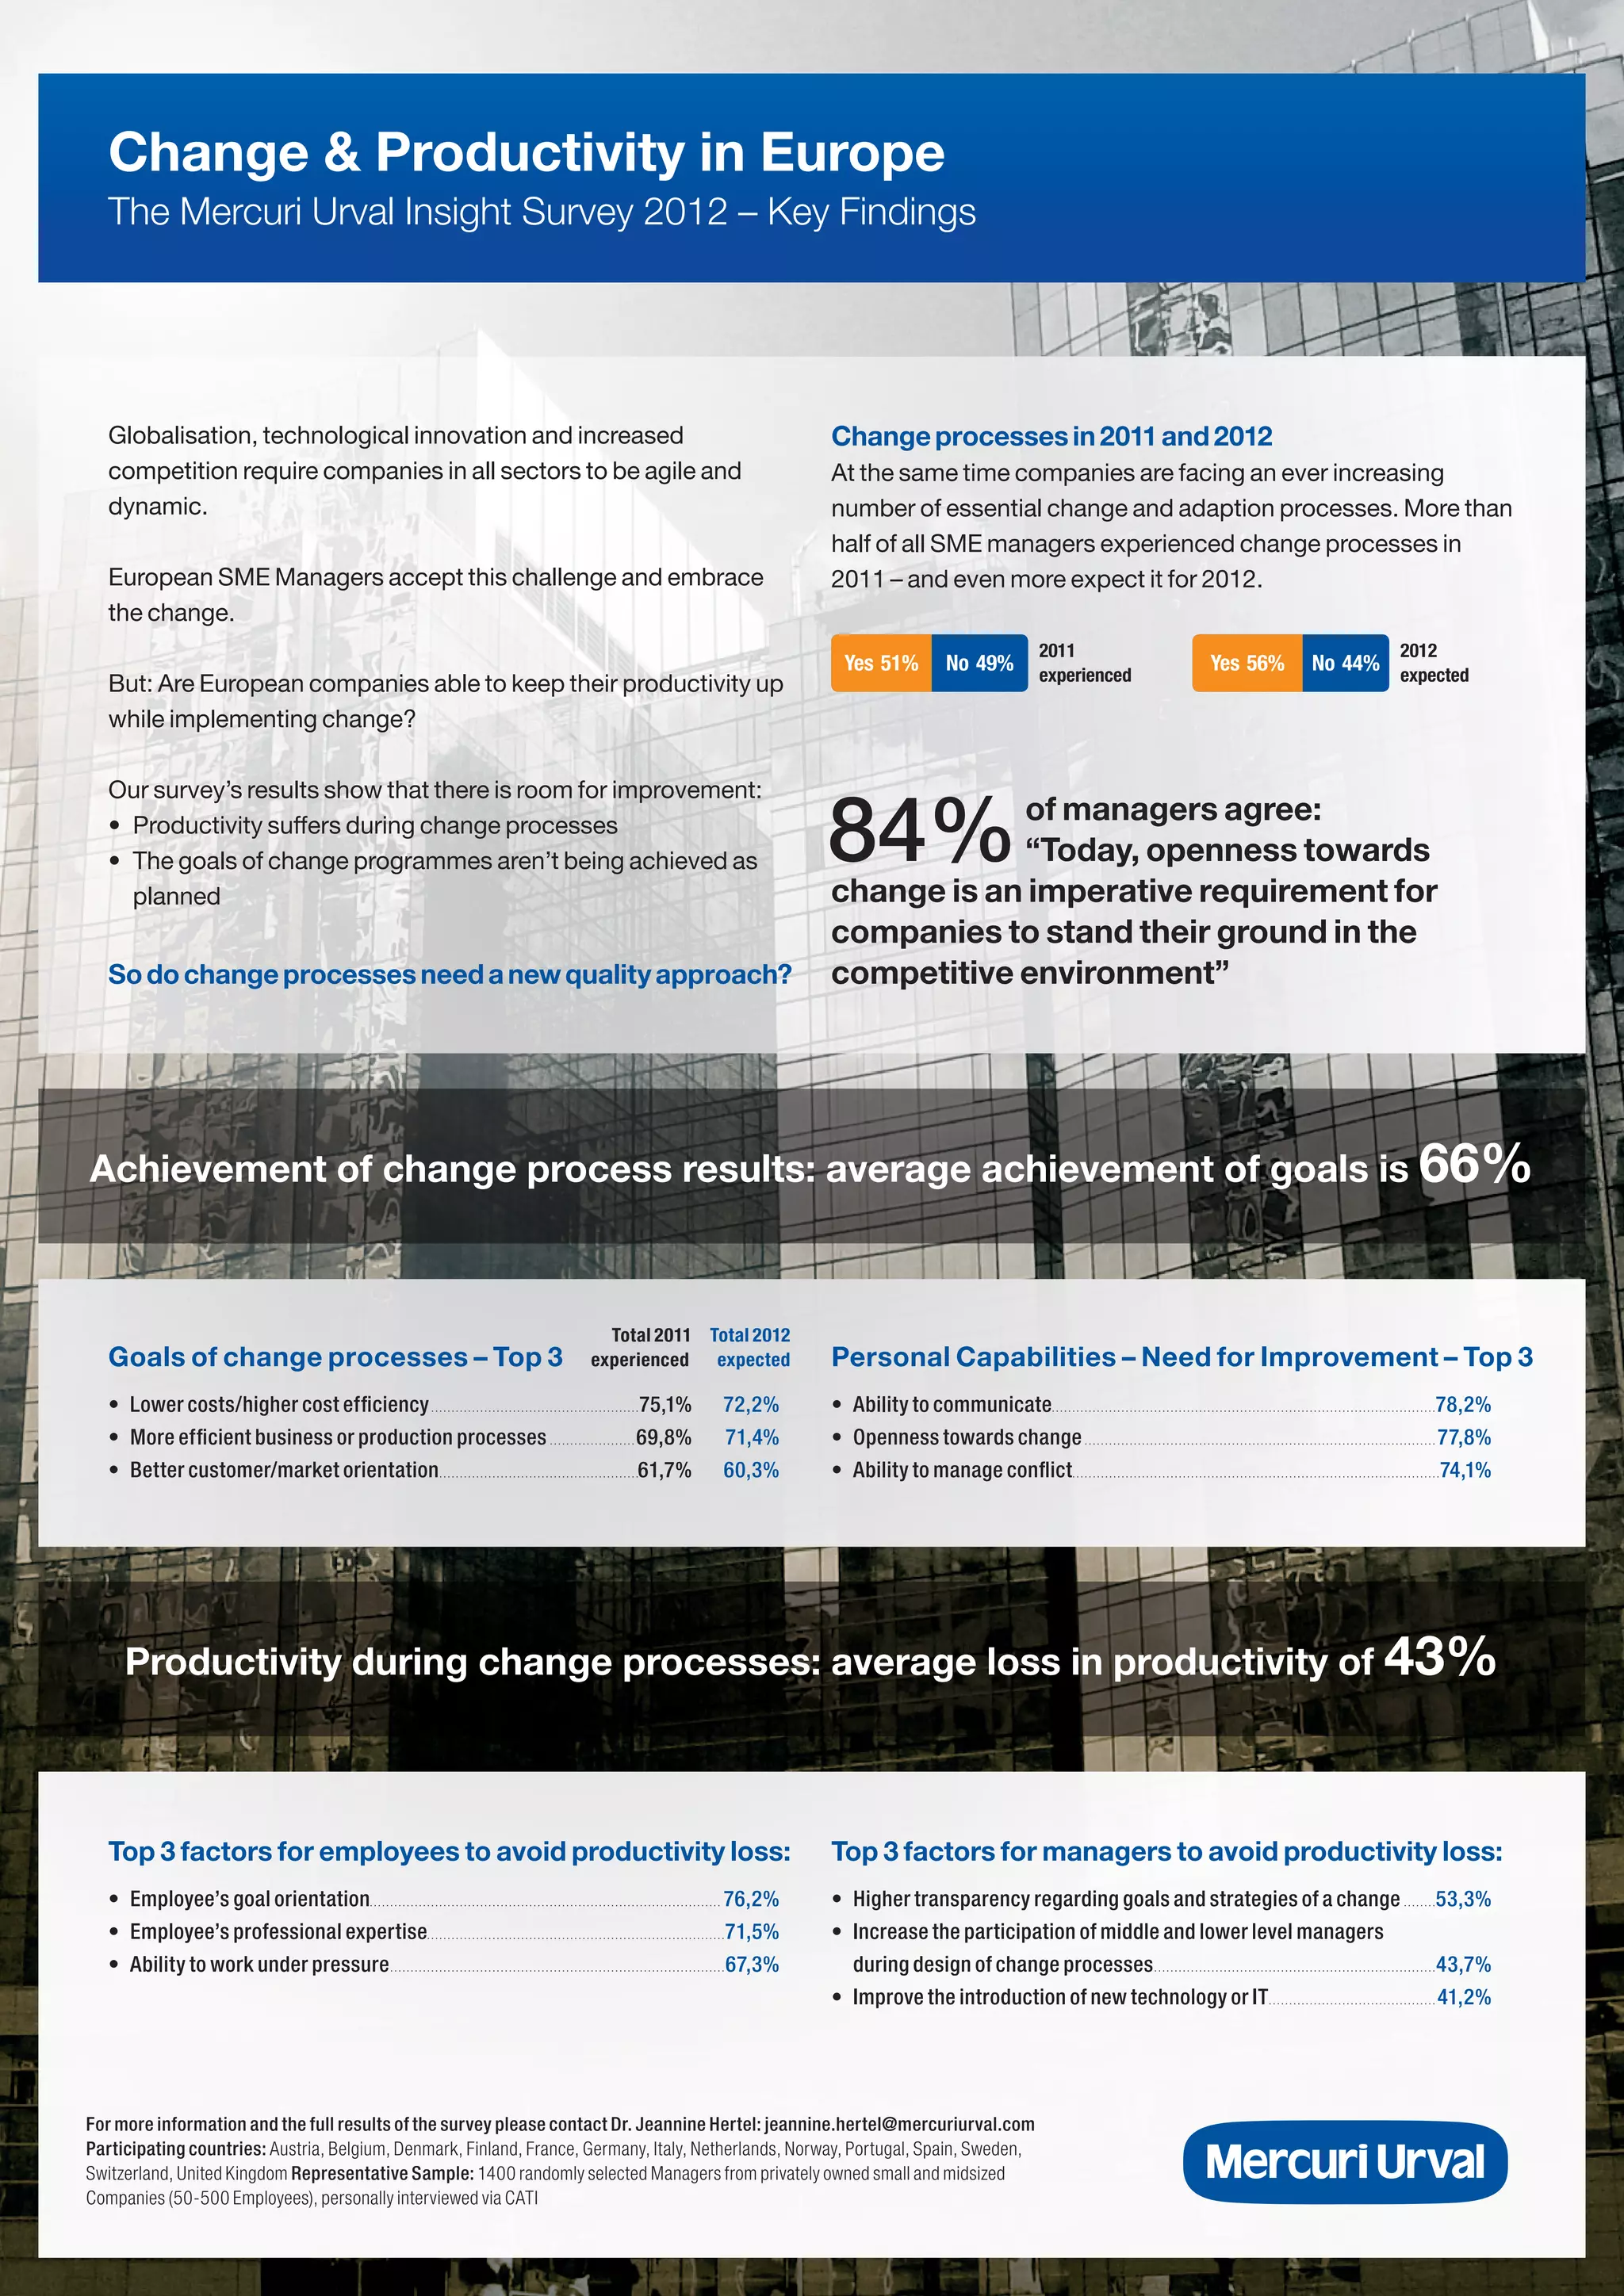
European companies face increasing pressure to change and adapt due to globalization, technology, and competition. Over half of European SME managers experienced change processes in 2011 and even more expect changes in 2012. However, productivity suffers during change and goals of change programs are only achieved 66% of the time on average. Managers agree that openness to change is needed but improving communication, embracing change, and managing conflict could help changes be implemented more effectively.


Change & Productivity in Europe
- 1. Change & Productivityin Europe The Mercuri Urval Insight Survey 2012 – Key Findings Globalisation, technological innovation and increased Change processes in 2011 and 2012 competition require companies in all sectors to be agile and At the same time companies are facing an ever increasing dynamic. number of essential change and adaption processes. More than half of all SME managers experienced change processes in European SME Managers accept this challenge and embrace 2011 – and even more expect it for 2012. the change. 2011 2012 Yes 51% No 49% Yes 56% No 44% experienced expected But: Are European companies able to keep their productivity up while implementing change? Our survey’s results show that there is room for improvement: • Productivity suffers during change processes • he goals of change programmes aren’t being achieved as T planned 84% of managers agree: “Today, openness towards change is an imperative requirement for companies to stand their ground in the So do change processes need a new quality approach? competitive environment” Achievement of change process results: average achievement of goals is 66% Total 2011 Total 2012 Goals of change processes – Top 3 experienced expected Personal Capabilities – Need for Improvement – Top 3 • ower costs/higher cost efficiency L . . . . . . . . . . . . . . . . . . . . . . . . . . . . . . . . . . . . . . . . . . . . . . . . . . . 75,1%. 72,2% • bility to communicate A . . . . . . . . . . . . . . . . . . . . . . . . . . . . . . . . . . . . . . . . . . . . . . . . . . . . . . . . . . . . . . . . . . . . . . . . . . . . . . . . . . . . . . . . . . . . . . 78,2% • ore efficient business or production processes M . . . . . . . . . . . . . . . . . . . . . . 69,8%. 71,4% • penness towards change O . . . . . . . . . . . . . . . . . . . . . . . . . . . . . . . . . . . . . . . . . . . . . . . . . . . . . . . . . . . . . . . . . . . . . . . . . . . . . . . . . . . . . . . 77,8% • etter customer/market orientation B . . . . . . . . . . . . . . . . . . . . . . . . . . . . . . . . . . . . . . . . . . . . . . . . . 61,7%. 60,3% • bility to manage conflict A . . . . . . . . . . . . . . . . . . . . . . . . . . . . . . . . . . . . . . . . . . . . . . . . . . . . . . . . . . . . . . . . . . . . . . . . . . . . . . . . . . . . . . . . . . 74,1% Productivity during change processes: average loss in productivity of 43% Top 3 factors for employees to avoid productivity loss: Top 3 factors for managers to avoid productivity loss: • mployee’s goal orientation E . . . . . . . . . . . . . . . . . . . . . . . . . . . . . . . . . . . . . . . . . . . . . . . . . . . . . . . . . . . . . . . . . . . . . . . . . . . . . . . . . . . . . . . 76,2% • igher transparency regarding goals and strategies of a change H . . . . . . . . 53,3% • mployee’s professional expertise E . . . . . . . . . . . . . . . . . . . . . . . . . . . . . . . . . . . . . . . . . . . . . . . . . . . . . . . . . . . . . . . . . . . . . . . . . 71,5% • ncrease the participation of middle and lower level managers I • Ability to work under pressure . . . . . . . . . . . . . . . . . . . . . . . . . . . . . . . . . . . . . . . . . . . . . . . . . . . . . . . . . . . . . . . . . . . . . . . . . . . . . . . . . . 67,3% during design of change processes . . . . . . . . . . . . . . . . . . . . . . . . . . . . . . . . . . . . . . . . . . . . . . . . . . . . . . . . . . . . . . . . . . . . . 43,7% • mprove the introduction of new technology or IT I . . . . . . . . . . . . . . . . . . . . . . . . . . . . . . . . . . . . . . . . . . 41,2% For more information and the full results of the survey please contact Dr. Jeannine Hertel: jeannine.hertel@mercuriurval.com Participating countries: Austria, Belgium, Denmark, Finland, France, Germany, Italy, Netherlands, Norway, Portugal, Spain, Sweden, Switzerland, United Kingdom Representative Sample: 1400 randomly selected Managers from privately owned small and midsized Companies (50-500 Employees), personally interviewed via CATI