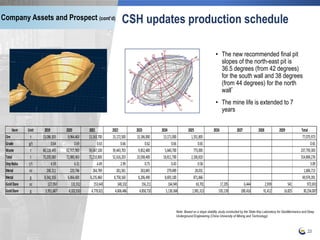
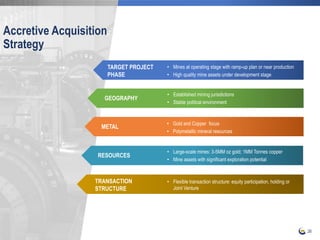
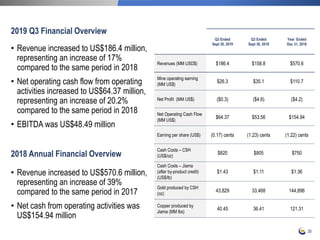
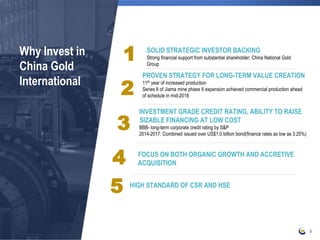
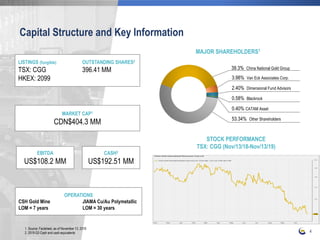
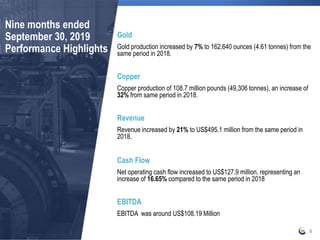
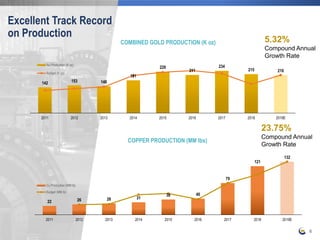
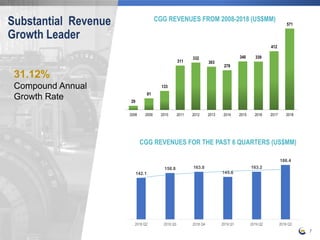
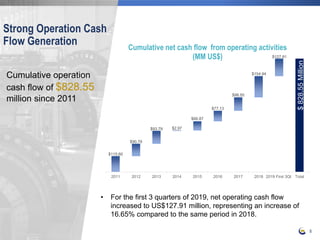
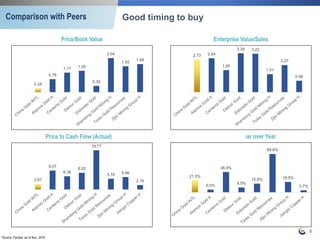
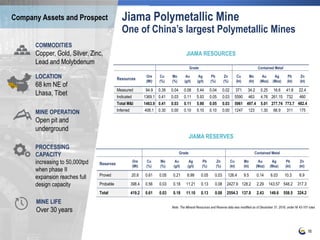
China Gold International Resources Corp. Ltd. presented information on its proven organic growth strategy and acquisition potential. The presentation discussed the company's strong track record of increased production and revenue over the past decade, solid investment grade credit rating, and focus on both organic growth and acquisitive growth. Details were provided on the company's key assets, including the Jiama copper-gold-polymetallic mine, as well as the company's future potential.

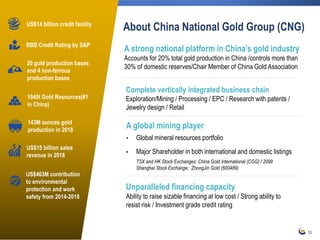
![17
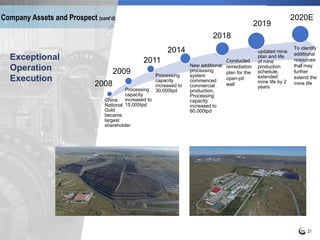
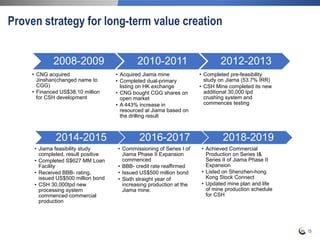
CGG
purchased
Jiama Mine
Pre-feasibility
study for
expansion
completed
Commercial
production on
Series I of
Phase II
Expansion
Commercial
production on
Series II of
Phase II
Expansion
Increasing ore
supply from
underground
mine2012
2010
2017
2018
2019
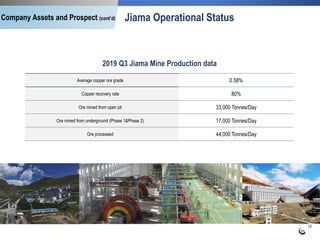
• During 2019, average metal recovery rates began to
improve and were higher compared to 2018, as the ratio
of oxide ore from the open pit has gradually decreased
• On track to deliver significant resource growth (resource
[Cu, M+I] from 1,373.5 kt to 5,961 kt, reserve [Cu, P+P]
from 879.1 kt to 2,554.3 kt)
Delivers solid
performance
during years
2020E
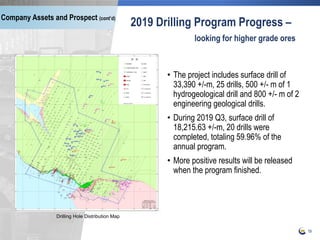
Drilling continue
to expand the
high grade
mineralization
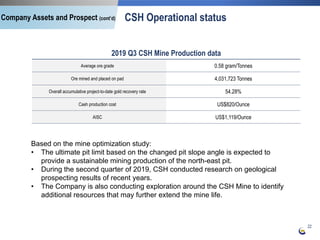
Company Assets and Prospect (cont’d)
2014
Feasibility study
for expansion
completed](https://image.slidesharecdn.com/cgg-presentation-2019q3v6-191204224729/85/Cgg-presentation-2019-q3-17-320.jpg)