Download to read offline


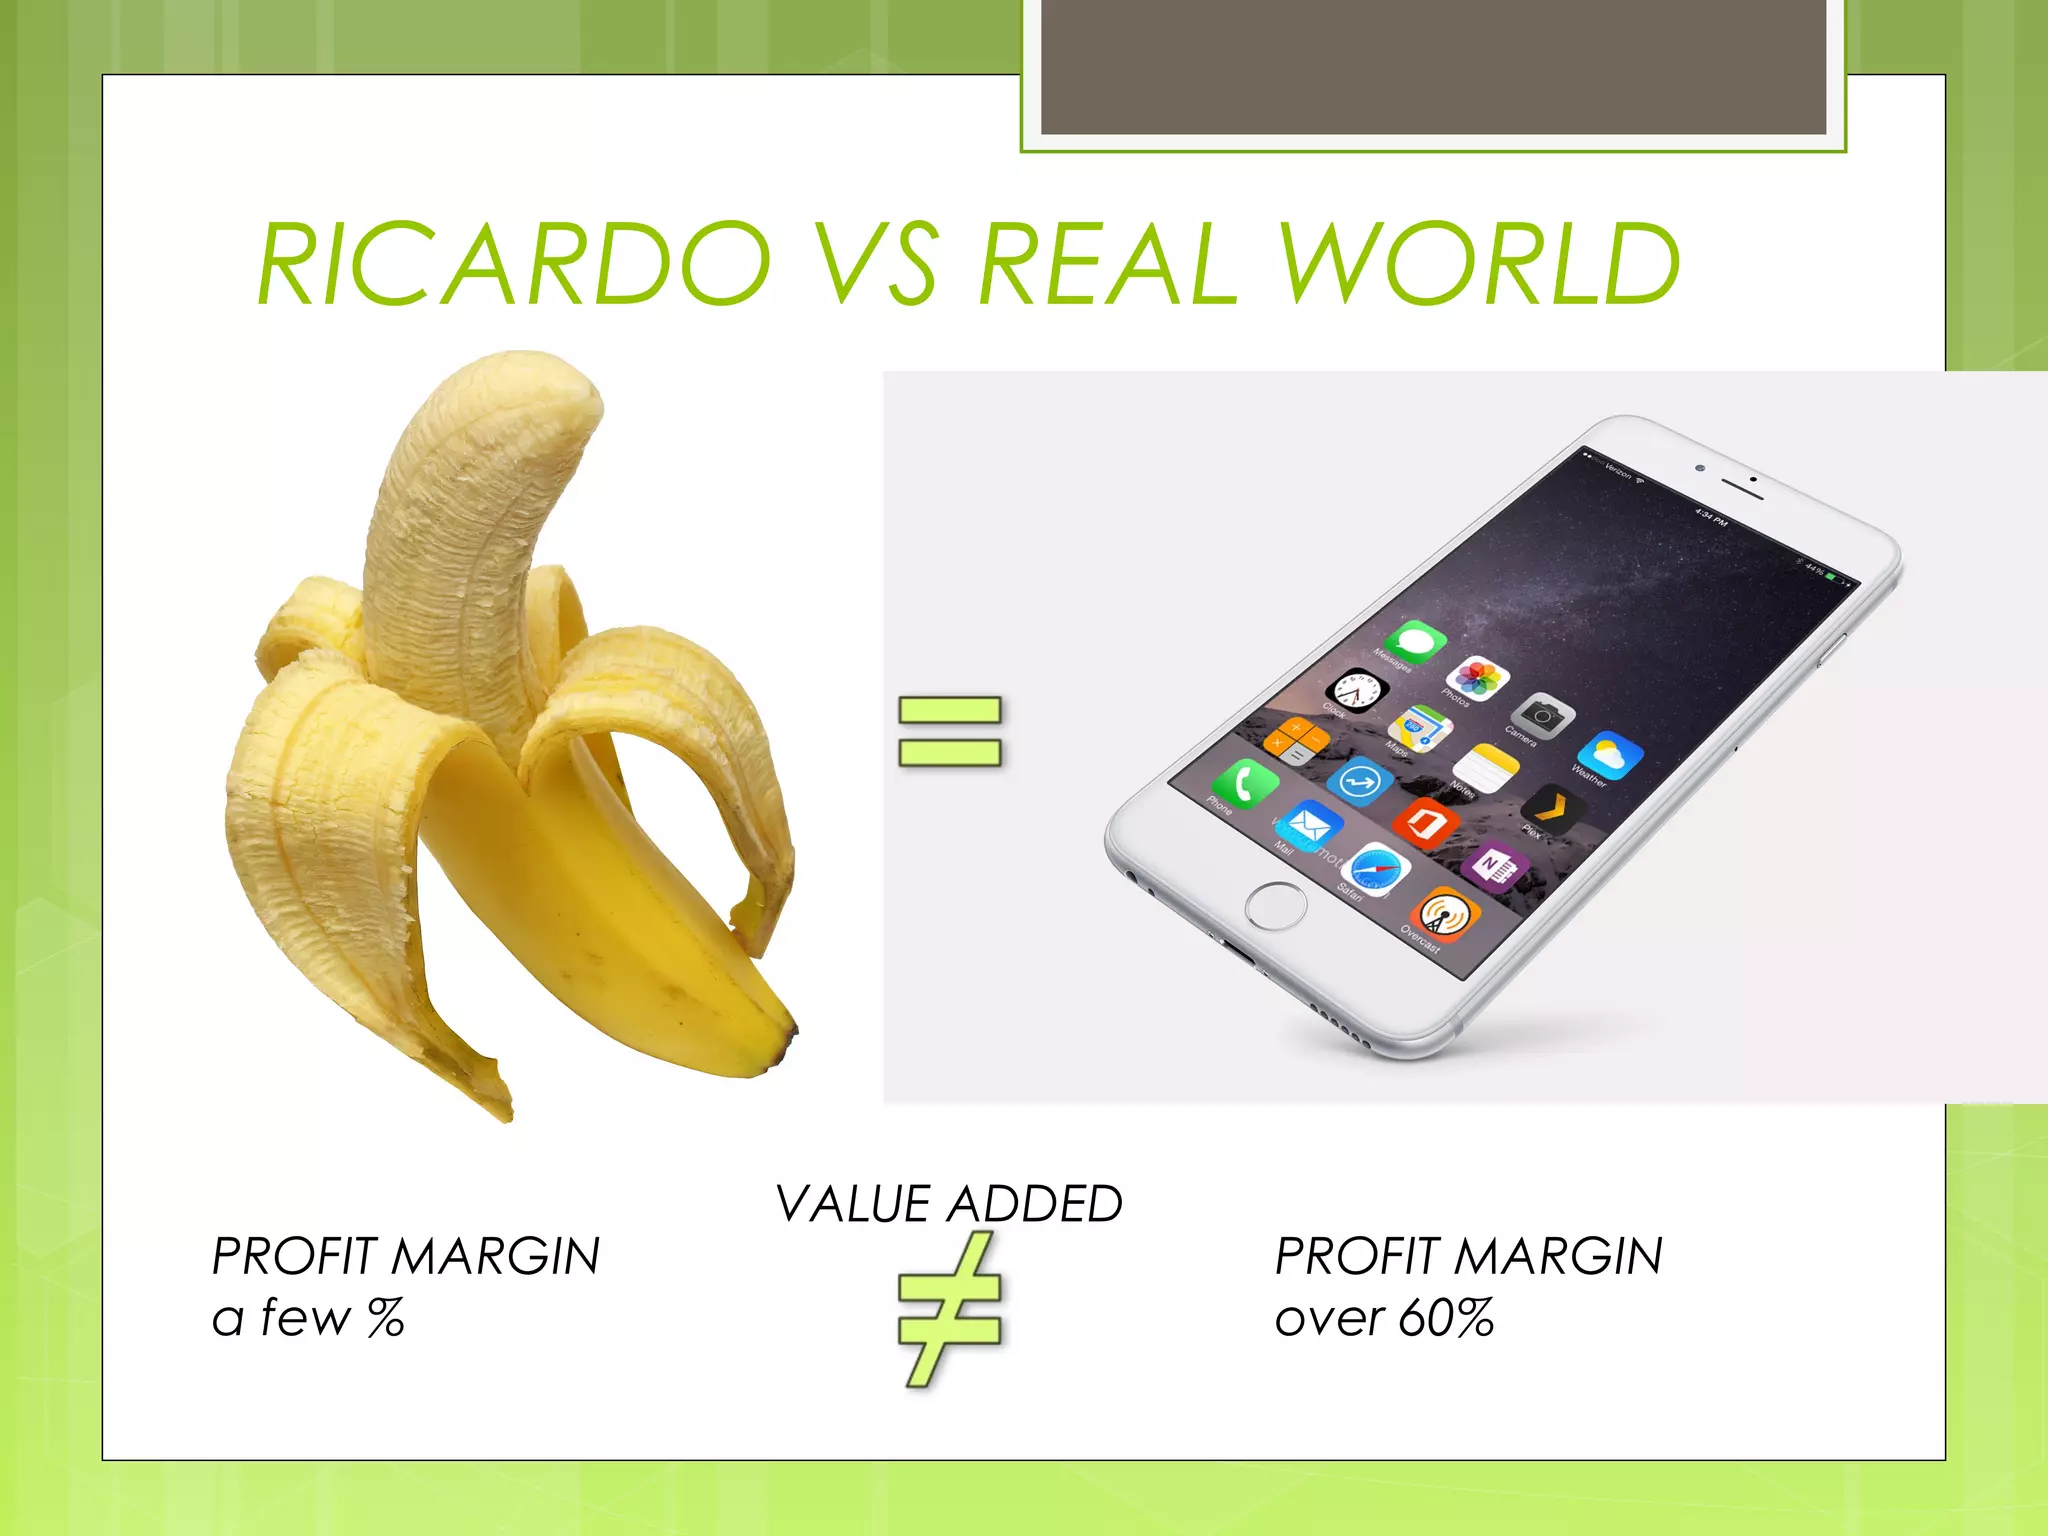


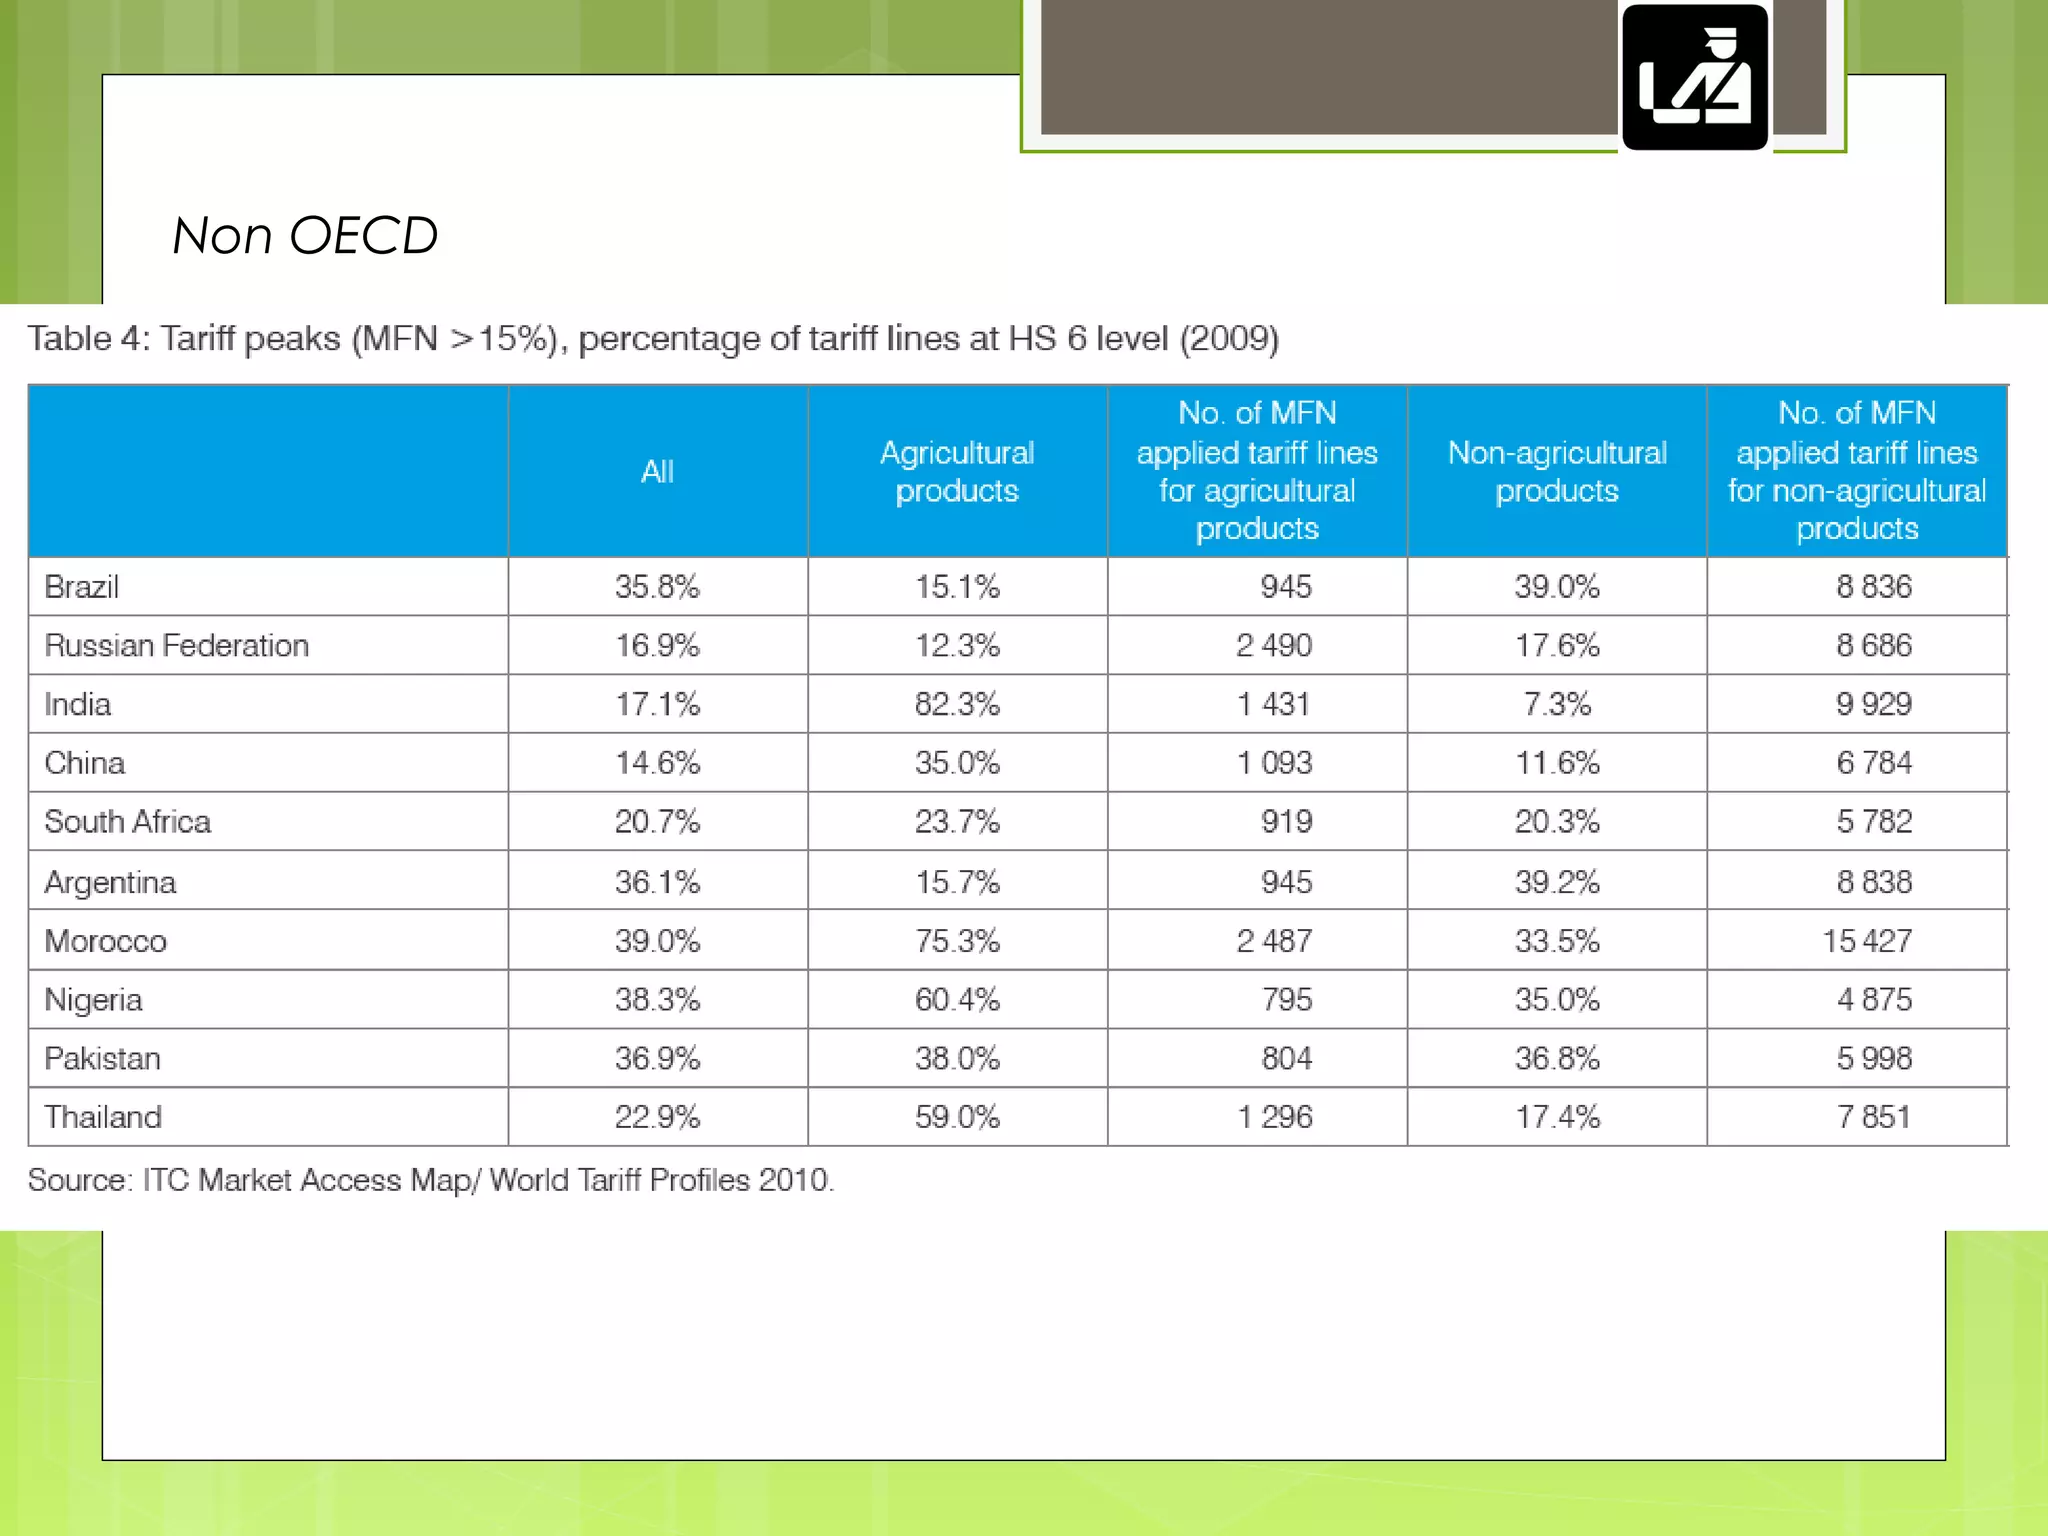

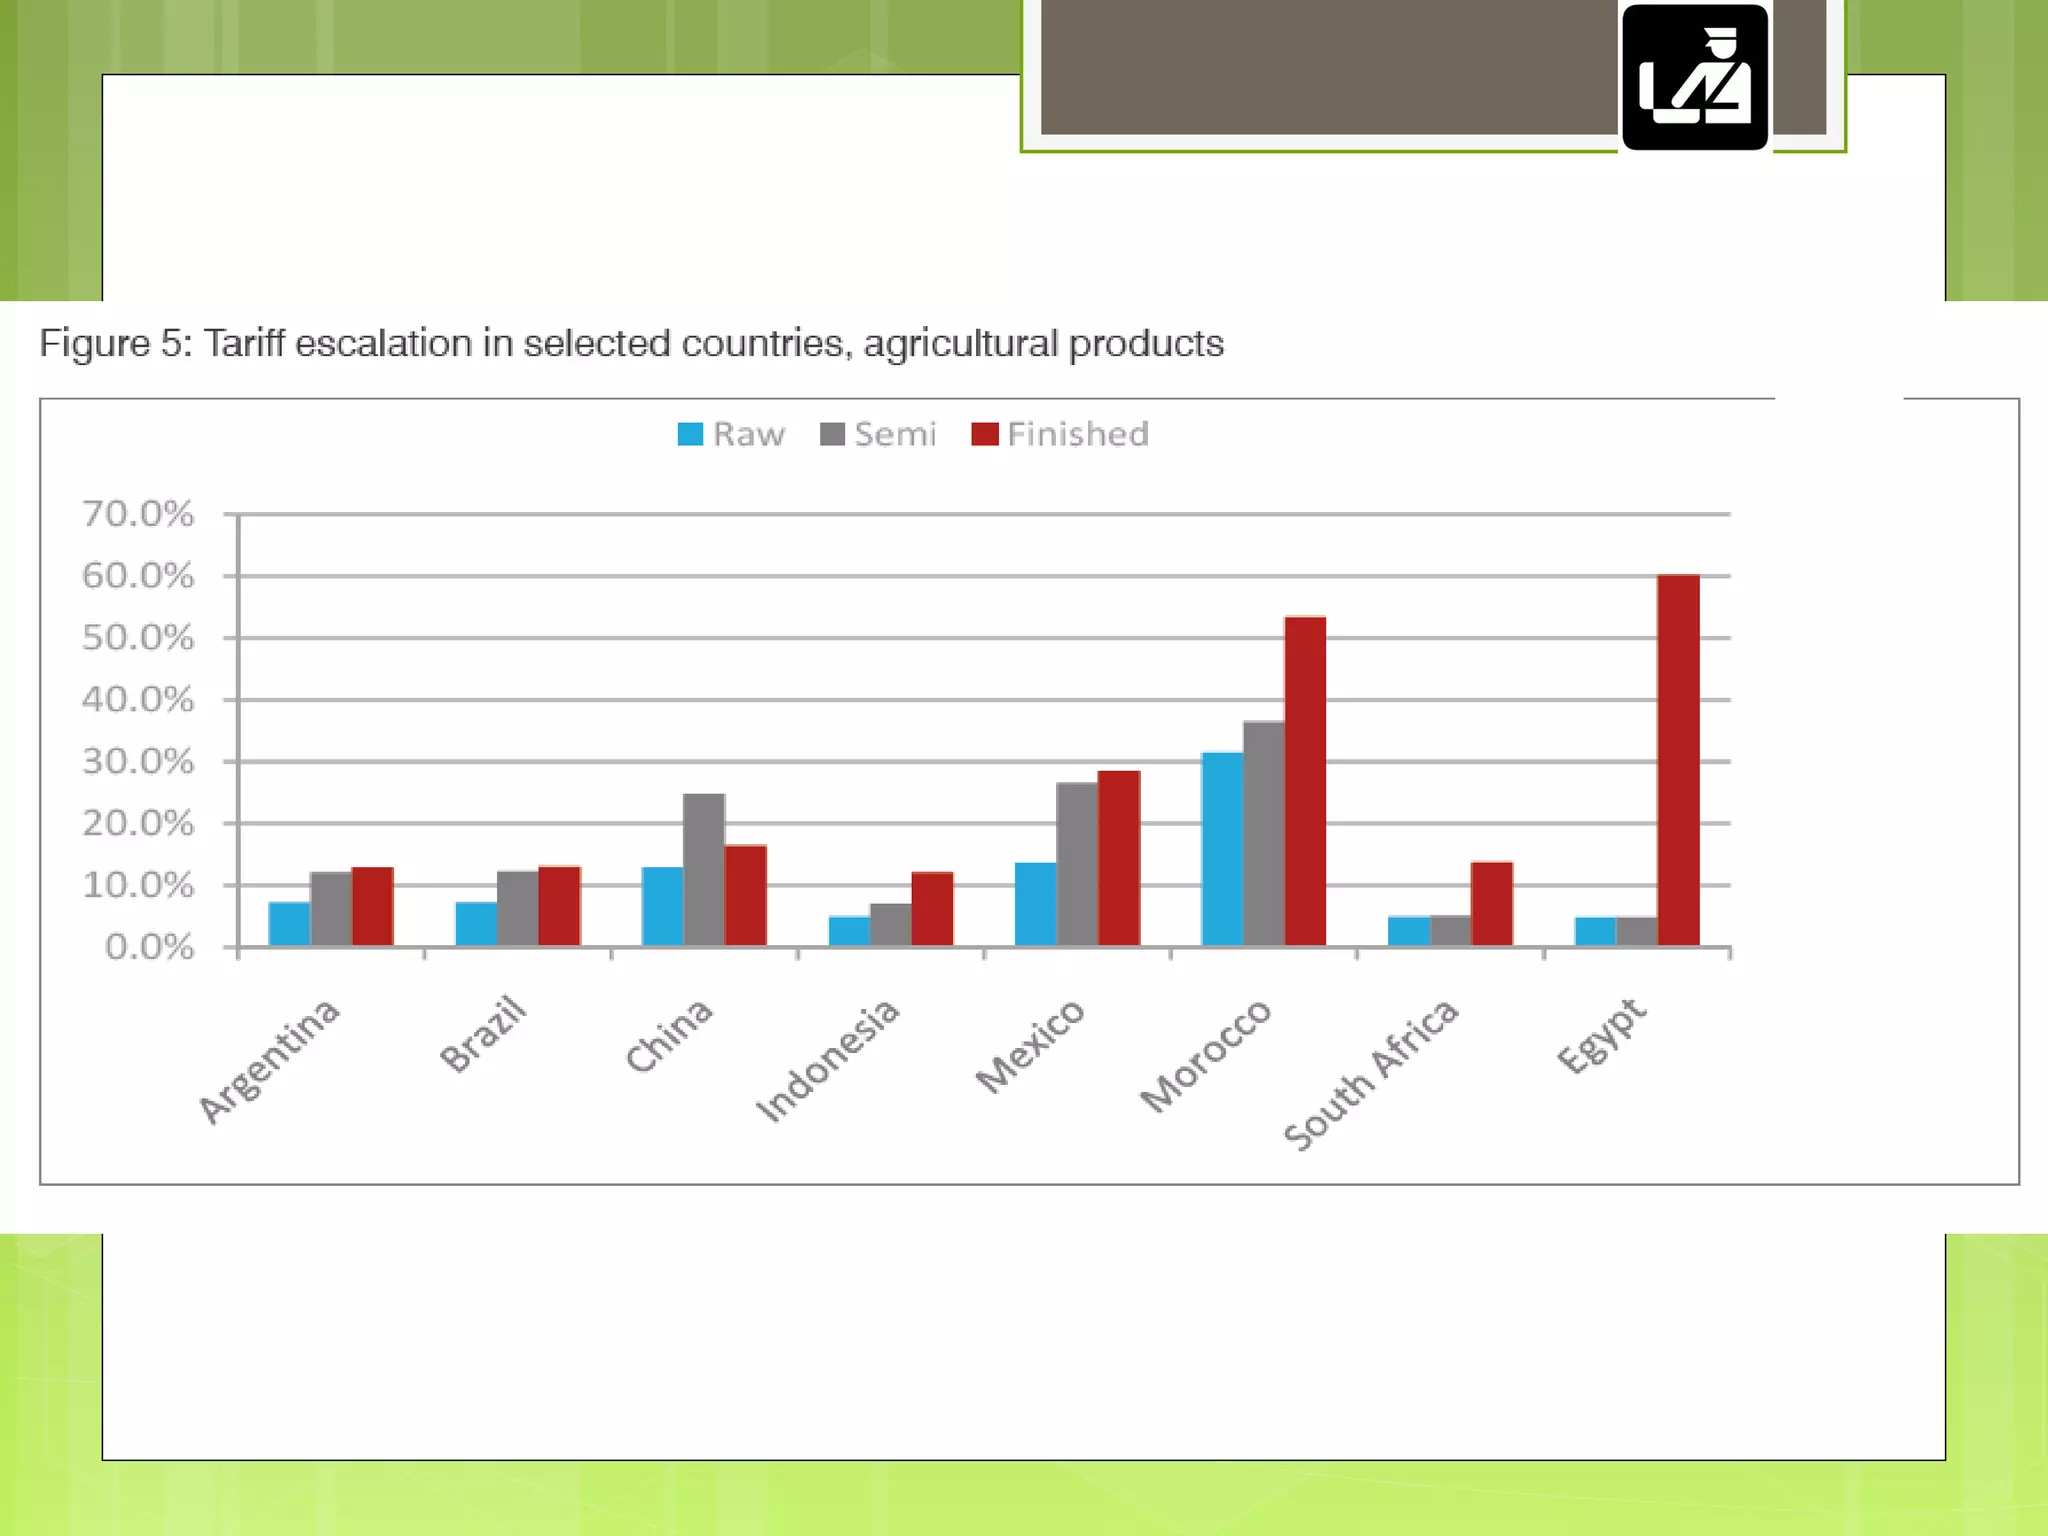
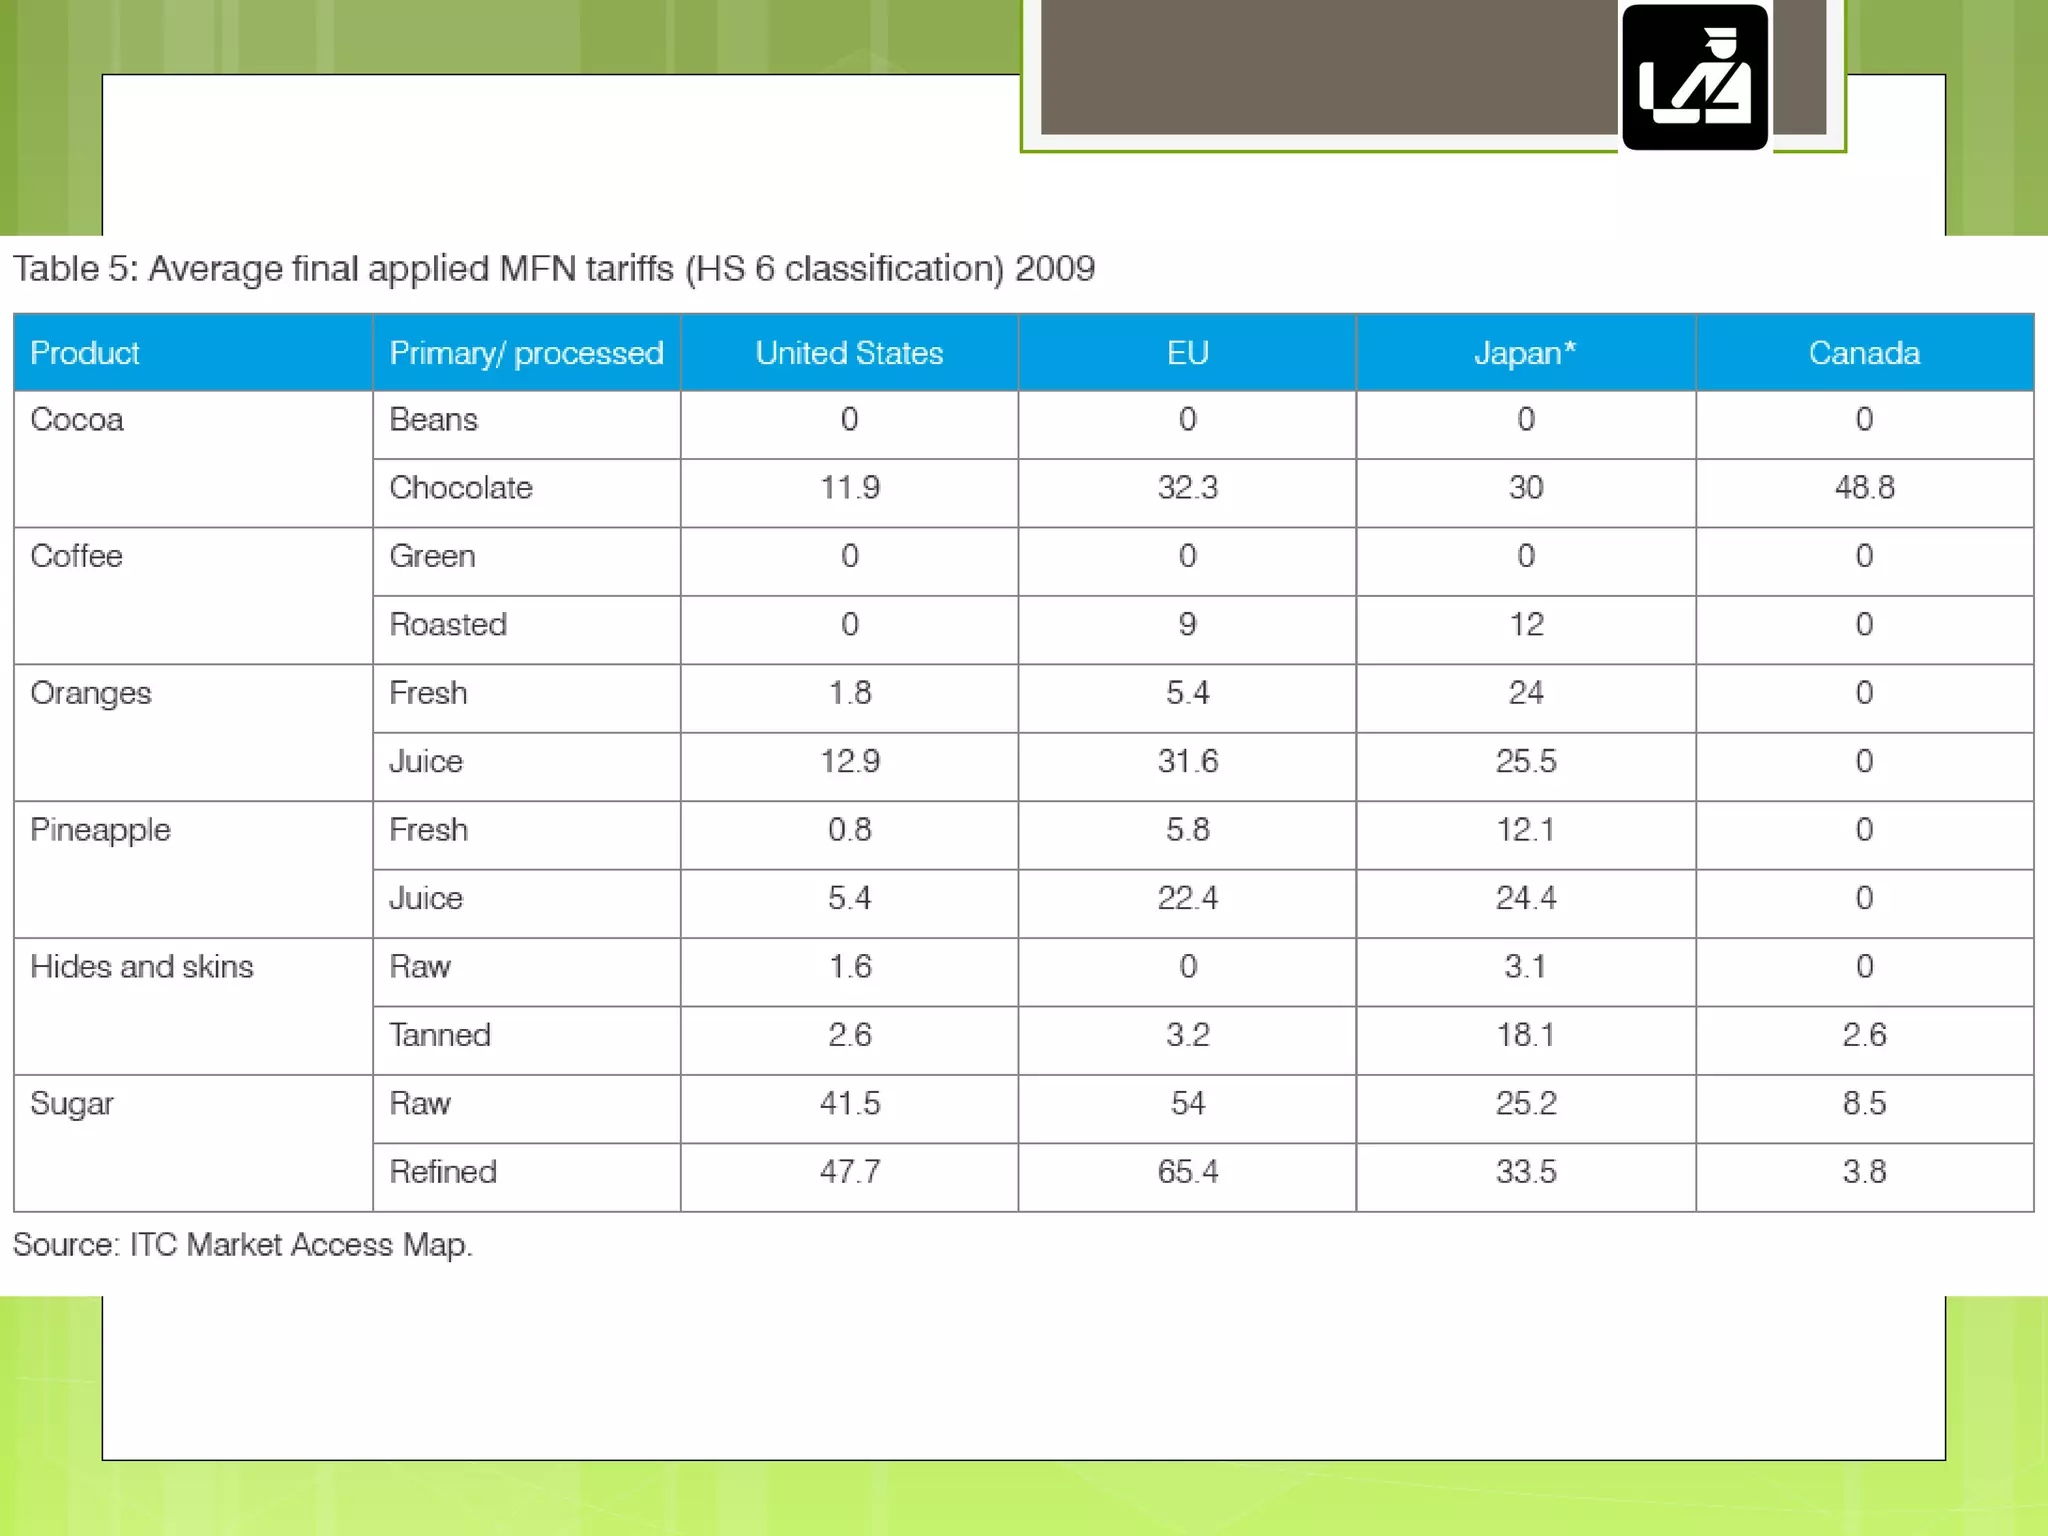

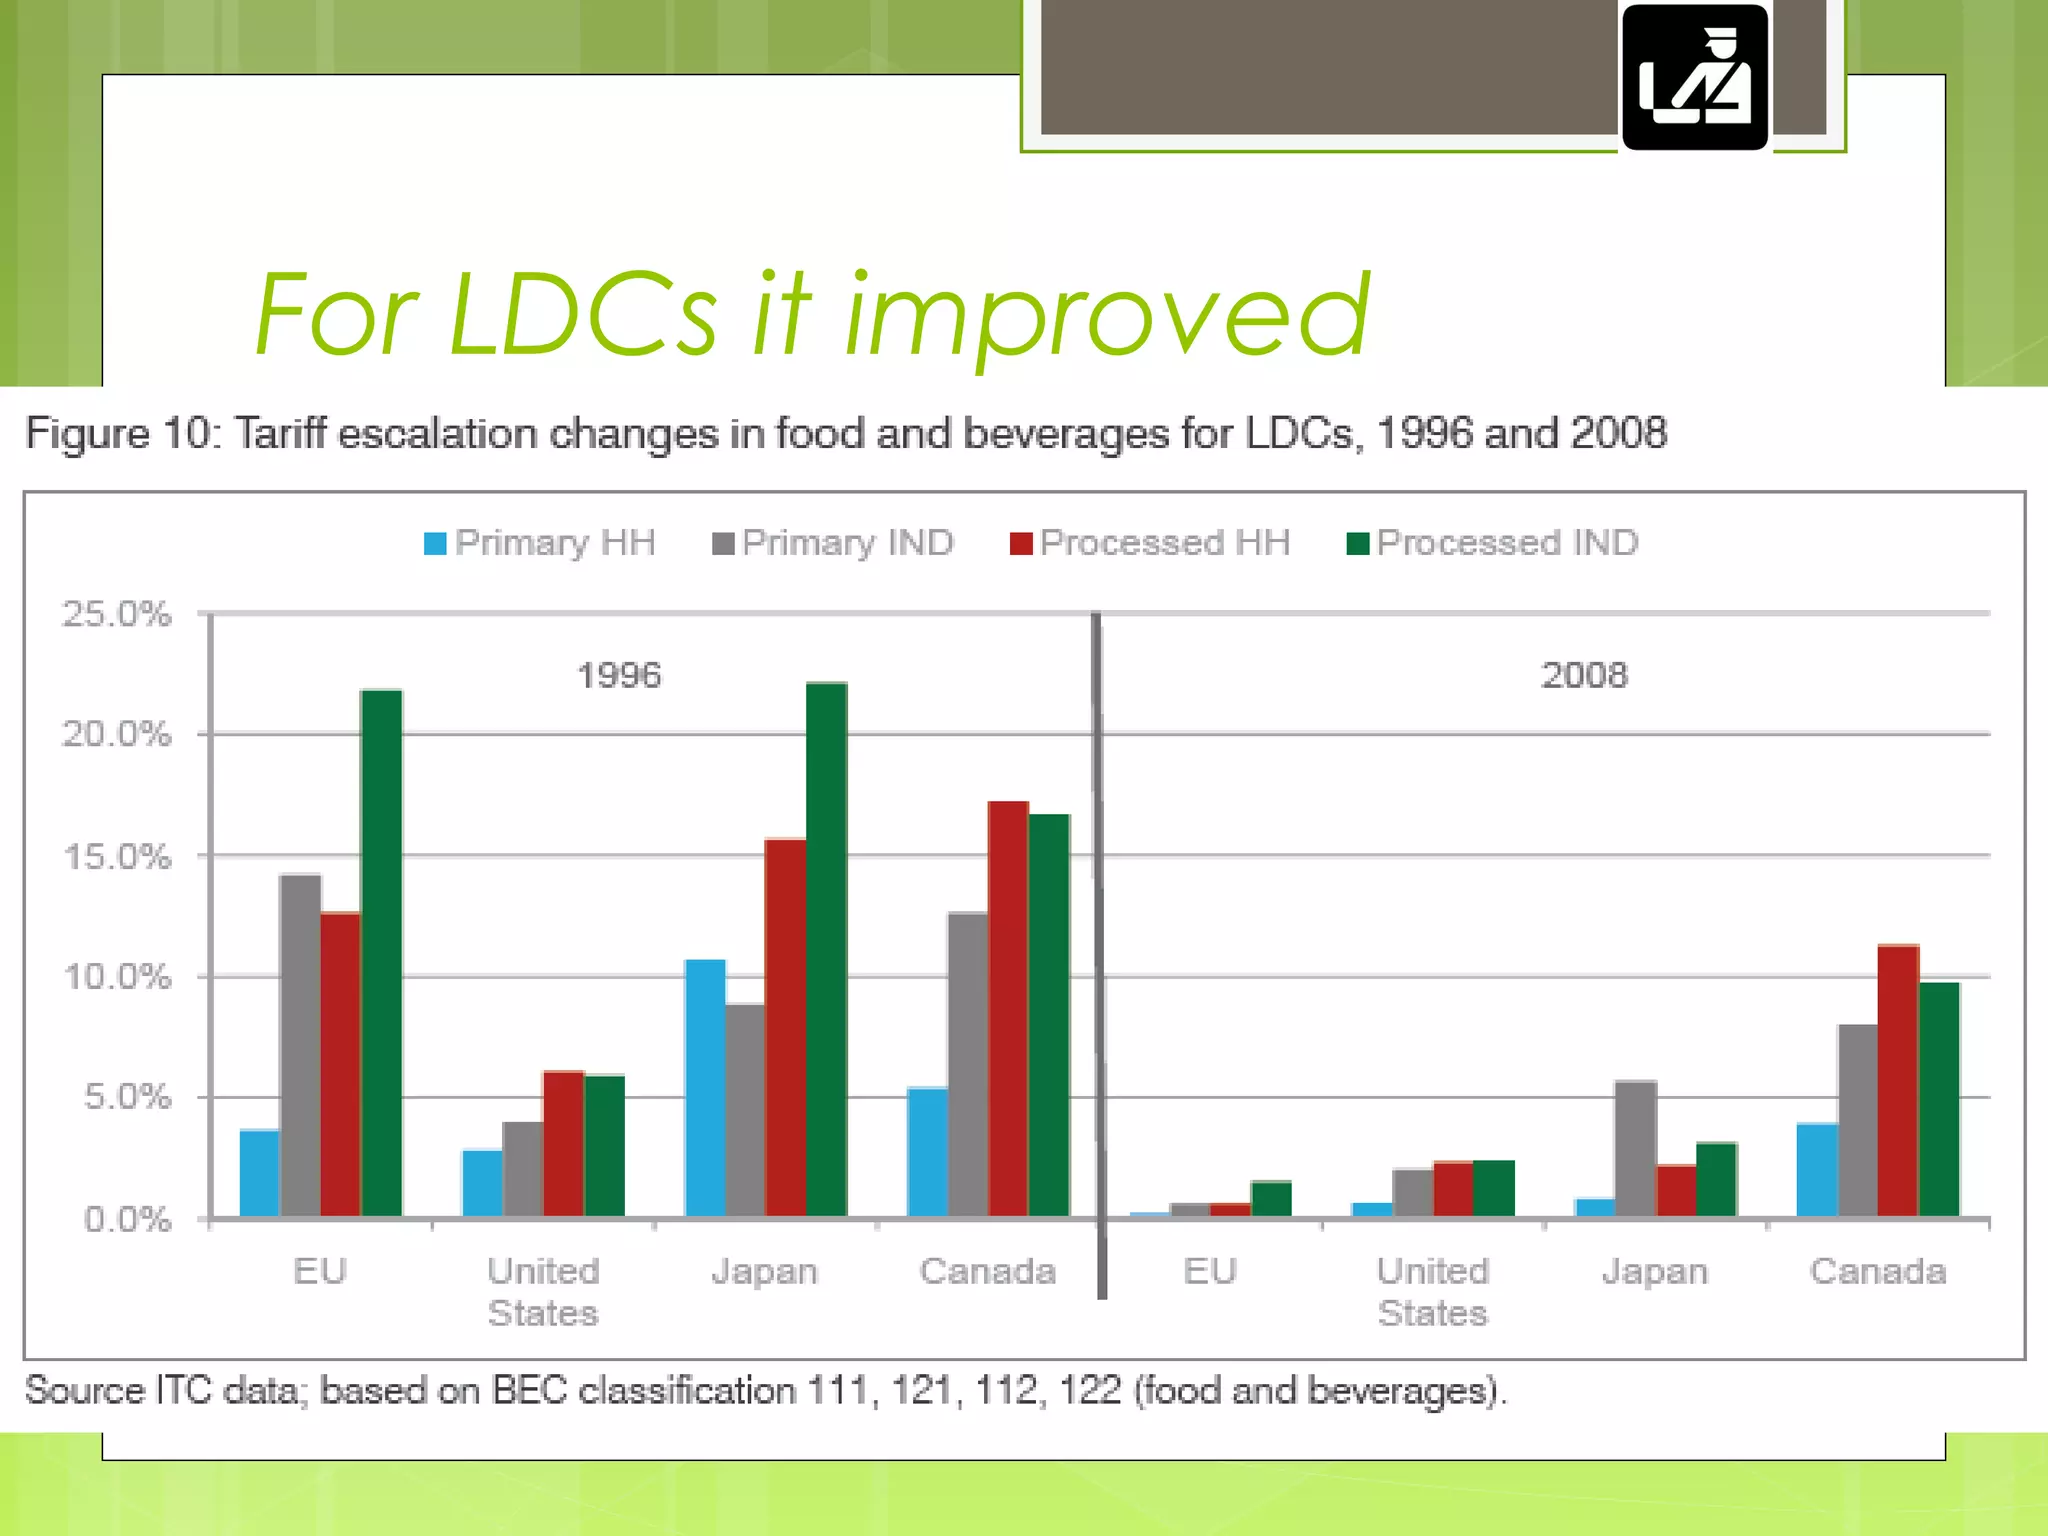


The document discusses issues related to international trade, including the theory of comparative advantage, limitations of trade models, barriers to trade such as tariffs and non-tariff barriers, and the impact of trade policies on developing countries. It notes that while free trade can expand global output, it also risks trapping countries in low-value production and limits opportunities for industrialization. Trade liberalization in agriculture has slowed due to policies in rich nations that affect world prices and new non-tariff barriers introduced.


![[Ronald p. morash] bridge to abstract mathematics](https://cdn.slidesharecdn.com/ss_thumbnails/ronaldp-161026020109-thumbnail.jpg?width=640&height=640&fit=bounds)


