Download to read offline
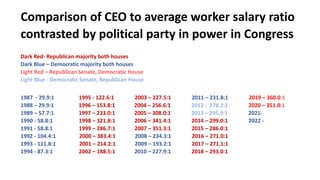

The document presents a comparison of CEO to average worker salary ratios from 1987 to 2022, highlighting fluctuations based on the political party in control of Congress. The data shows a significant increase in the salary ratio over the years, with the highest recorded ratio being 360.0:1 in 2019. Notably, the ratio changes with the majority party, indicating a potential correlation between political leadership and salary disparities.


