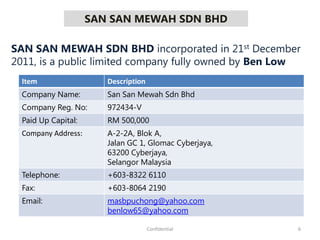
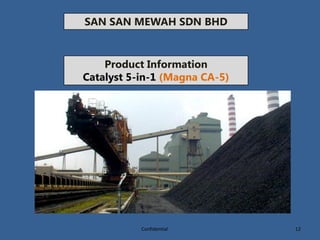
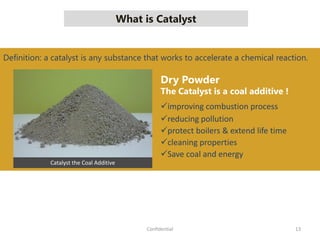
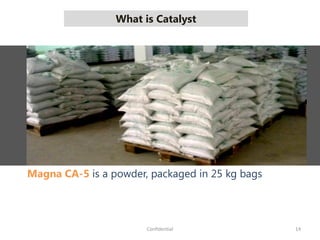
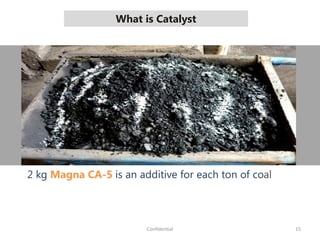
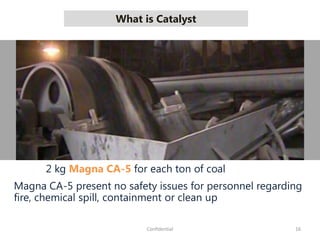
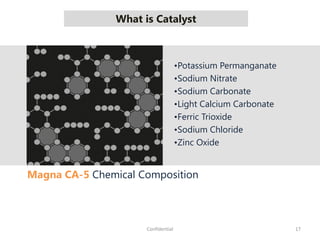
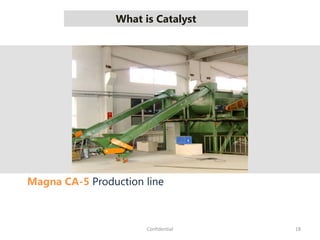
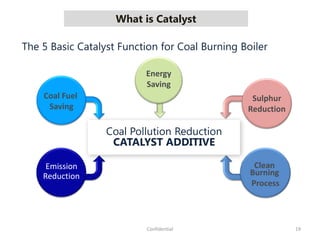
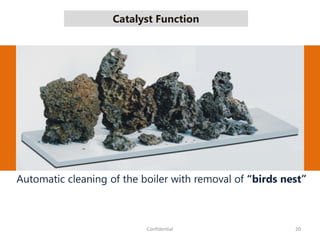
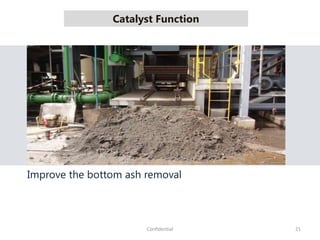
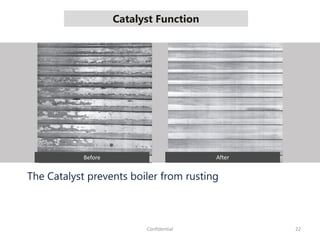
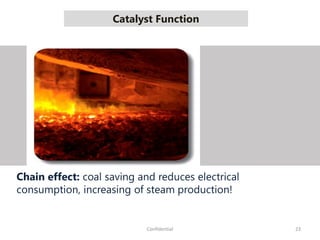
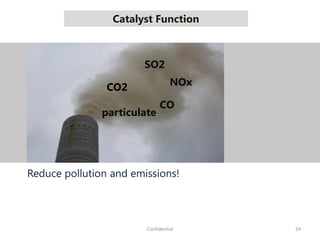
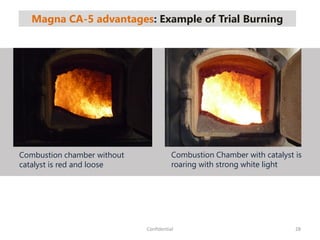
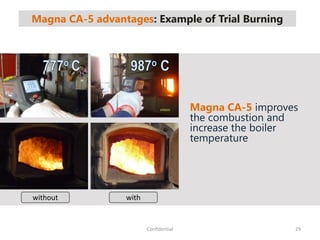
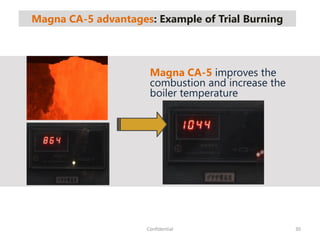
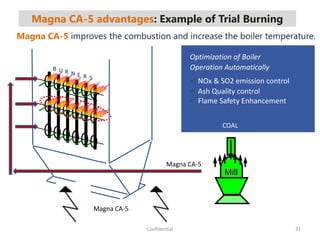
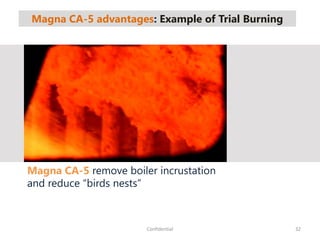
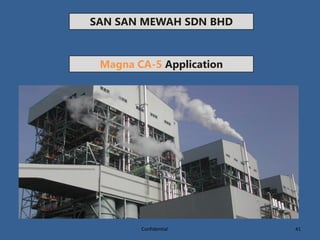
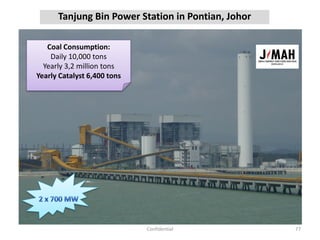
SlideShare a Scribd company logo
1 of 97
Download to read offline
San San Mewah Sdn Bhd
Proposal for the
Production of 5-in-1
Catalyst (Magna CA-5)
for Power Plant
1Confidential
SAN SAN MEWAH SDN BHD
Confidential Agreement
The undersigned reader acknowledges that the information provided in this proposal is confidential;
therefore, the reader agrees not to disclose it without the express written permission of SAN SAN MEWAH
SDN BHD.
It is acknowledged by the reader that information to be furnished in this proposal is in all respects
confidential in nature, other than information that is in the public domain through other means, and that
any disclosure or use of this confidential information by the reader may cause serious harm or damage to
SAN SAN MEWAH SDN BHD.
Upon request, this document is to be immediately returned to SAN SAN MEWAH SDN BHD.
Signature
Name (printed)
Date
This is a business proposal. It does not imply offering of securities. Readers are encouraged to make their
judgments as to the veracity of the information provided herein on their own before accepting the plan on
its own merits. 2Confidential
More recently, global warming has become unmistakably important with widespread melting of ice,
noticeable climate changes, and rising sea levels. This is now recognized by nearly everyone as caused
by greenhouse gases, mainly carbon dioxide, produced by burning fossil fuels such as petroleum, coal,
and natural gas
Massachusetts Institute of Technology (MIT) – newsletter 2007
China is the world's second largest oil consumer behind the United States, and the largest global energy
consumer. The country was a net oil exporter until the early 1990s and became the world's second
largest net importer of oil in 2009. China's oil consumption growth accounted for half of the world's oil
consumption growth in 2011. Natural gas usage in China has also increased rapidly in recent years, and
China has looked to raise natural gas imports via pipeline and liquefied natural gas (LNG). China is also
the world's largest top coal producer and consumer and accounted for about half of the global coal
consumption, an important factor in world energy-related CO2 emissions.
Observation by United States Energy Information Administration
The electricity tariff will be increased by an average of about 14.89% for Peninsular Malaysia, and by
about 17% for Sabah and Labuan from next year, said Energy, Green Technology and Water Minister
Datuk Dr Maximus Ongkili.
The energy problem has caused the Malaysian government to look into raising electricity tariffs in
2014, as viewed in The Star on 2nd of December 2013
3Confidential
 To solve environmental issues, China has invested billions into research
and development (R & D) with scientists and parties from various parts of
the world and developed a 5 in 1 Catalyst (Magna CA-5) that can
extract an additional 30 – 40% more in terms of energy output from the
current raw materials used to produce energy sources. One of the parties
involved in this international project is SAN SAN MEWAH SDN BHD.
 Magna CA-5 is a coal additive, specially designed for high production
boilers such as coal fired power plants and has been developed to
improve:
 the combustion process
 coal pollution reduction
 protect boilers & extend life time
 cleaning boiler properties
 saving coal and energy
 SAN SAN MEWAH strive to be a world leader, the main producer and
the main exporter of 5 in 1 Catalyst (Magna CA-5).
4Confidential
SAN SAN MEWAH SDN BHD
COMPANY PROFILE
5Confidential
SAN SAN MEWAH SDN BHD
SAN SAN MEWAH SDN BHD incorporated in 21st December
2011, is a public limited company fully owned by Ben Low
Item Description
Company Name: San San Mewah Sdn Bhd
Company Reg. No: 972434-V
Paid Up Capital: RM 500,000
Company Address: A-2-2A, Blok A,
Jalan GC 1, Glomac Cyberjaya,
63200 Cyberjaya,
Selangor Malaysia
Telephone: +603-8322 6110
Fax: +603-8064 2190
Email: masbpuchong@yahoo.com
benlow65@yahoo.com
6Confidential
Organization Chart
7Confidential
Shareholder
Board
CEO
CMO
HR Manager
Manufacturing
Manager
Manufacturing
Manager
Manufacturing
Manager
Manufacturing
Manager
CTO
R&D Manager
Technical &
Customer Service
Manager
CBD
Sales Manager
Public Relation
Manager
CFO
Accountant
Legal Department
SAN SAN MEWAH SDN BHD
Manufacturing Plan
8Confidential
Manufacturing Plan
Description
Size, Capacity and
Investment per plant
Plant Land Size 3 acre = 130680 sq. ft.
Production Line 5 lines, with 2 machines per line
Total Machine 10 machines
Production Capacity 5000 Metric Tons per Month.
Investment USD 5.0 million
Capital Expenditure ≈ USD 3.7 million
Operating Expenditure ≈ USD 2.3 million annually
9Confidential
Note: Machine output capacity: 500 Metric Tons per Month
Summary of Manufacturing Cost
10
Confidential
Electricity Power Consumption(PC).
• PC per machine = Wood Pellet Machine PC + Torrefying PC
≈ 28 KWh
• Assumption each machine runs 20 hours per day / 20 days
Total PC per machine ≈ 28 x 20 hrs x 20 days
≈ 11,200 KWh
Total PC per production line ≈ 11,200 KWh x 2 machines
≈ 22,400 KWh
Machine Cost per line:
≈ USD 100K x 2 machines
≈ USD 200,000
Total Land Size:
≈ 3 acres (0.125 + 2 + 0.5 == 2.625 acres)
Building Size:
≈ Production line + office + warehouse +
substation + logistic
≈ 2 acres ≈ 87120 sqft
Power Consumption (PC) per month per line:
≈ 22,400 KWh
NOTES:
1. Calculation based on 1 unit production line
Land Size.
• Manufacturing Size for 1 unit production line
Note: 1 unit production line has 2 machines
≈ 20m x 25m
≈ 500 sqm
≈ 5,382 sqft ≈ 0.125 acre
• Logistics + Warehouse + Office + Power Substation
≈ 2 acres
• Raw Material Compound
≈ 0.5 acres
Land Size and Utility Calculation Approximate Cost (Summary)
Machine
11Confidential
Maximum Capacity: 500 Metric Tons per Month
Operating Time: 5 Days per week
Power Rating: 28 KWh
SAN SAN MEWAH SDN BHD
Product Information
Catalyst 5-in-1 (Magna CA-5)
12Confidential
What is Catalyst
13Confidential
Catalyst the Coal Additive
Dry Powder
The Catalyst is a coal additive !
improving combustion process
reducing pollution
protect boilers & extend life time
cleaning properties
Save coal and energy
Definition: a catalyst is any substance that works to accelerate a chemical reaction.
What is Catalyst
14Confidential
Magna CA-5 is a powder, packaged in 25 kg bags
What is Catalyst
15Confidential
2 kg Magna CA-5 is an additive for each ton of coal
What is Catalyst
16Confidential
2 kg Magna CA-5 for each ton of coal
Magna CA-5 present no safety issues for personnel regarding
fire, chemical spill, containment or clean up
What is Catalyst
17Confidential
Magna CA-5 Chemical Composition
•Potassium Permanganate
•Sodium Nitrate
•Sodium Carbonate
•Light Calcium Carbonate
•Ferric Trioxide
•Sodium Chloride
•Zinc Oxide
What is Catalyst
18Confidential
Magna CA-5 Production line
What is Catalyst
19Confidential
The 5 Basic Catalyst Function for Coal Burning Boiler
Coal Pollution Reduction
CATALYST ADDITIVE
Clean
Burning
Process
Coal Fuel
Saving
Emission
Reduction
Sulphur
Reduction
Energy
Saving
Catalyst Function
20Confidential
Automatic cleaning of the boiler with removal of “birds nest”
Catalyst Function
21Confidential
Improve the bottom ash removal
Catalyst Function
22Confidential
The Catalyst prevents boiler from rusting
Before After
Catalyst Function
23Confidential
Chain effect: coal saving and reduces electrical
consumption, increasing of steam production!
Catalyst Function
24Confidential
CO2
SO2
CO
NOx
particulate
Reduce pollution and emissions!
“5 in 1 Catalyst” In The News
25Confidential
Potential Market
Power plant
Aluminum plant
Papermaking industry
Printing plant
Sugar refinery
Styrofoam factory
Cement plant
Plastics factory
Glass factory
Emulsion factory
Brewery
Ceramic factory
Fertilizer plant
Feed factory
Chemical plant
Die Casting factory
Steel manufacturing industry
Wood pellet fuel plant
Textile industry
Pharmaceutical factory
Food products factory
Tire factory
Heating enterprise
Electrical appliances factory
Clothing factory
Foam rubber production factory
Rubber production factory
Textile dye industry
Steel tube manufacturing industry
Automotive manufacturing industry
Copper manufacturing industry
Cigarette factory
26Confidential
SAN SAN MEWAH SDN BHD
Catalyst Magna CA-5
Benefits & Advantages
27Confidential
Magna CA-5 advantages: Example of Trial Burning
28Confidential
Combustion chamber without
catalyst is red and loose
Combustion Chamber with catalyst is
roaring with strong white light
Magna CA-5 advantages: Example of Trial Burning
29Confidential
Magna CA-5 improves
the combustion and
increase the boiler
temperature
without with
Magna CA-5 advantages: Example of Trial Burning
30Confidential
Magna CA-5 improves the
combustion and increase the
boiler temperature
Magna CA-5 advantages: Example of Trial Burning
31Confidential
B U R N E R S
Mill
COAL
Magna CA-5
Optimization of Boiler
Operation Automatically
 NOx & SO2 emission control
 Ash Quality control
 Flame Safety Enhancement
Magna CA-5
Magna CA-5 improves the combustion and increase the boiler temperature.
Magna CA-5 advantages: Example of Trial Burning
32Confidential
Magna CA-5 remove boiler incrustation
and reduce “birds nests”
Magna CA-5 advantages: Example of Trial Burning
33Confidential
Magna CA-5 remove boiler incrustation
and reduce “birds nests”
Clean boiler, dissolved coke can be
taken out by an iron bar.
Removal of coke on fire grate from
inspection opening.
Magna CA-5 advantages: Catalyst Direct Benefit
34Confidential
Magna CA-5 reduce pollution and
production of harmful gases.
Reduce up to 30% Nitrogen Oxide NOx
Reduce up to 30% Sulphur Dioxide SO2
Reduce up to 30% Carbon Monoxide CO
Reduce up to 20% ash content and particles
Magna CA-5 advantages: Catalyst Direct Benefit
35Confidential
Before 1st Day 2nd Day
Magna CA-5 combustion improvement turns “black”
smoke into “white”.
Magna CA-5 advantages: Catalyst Direct Benefit
36Confidential
Magna CA-5 helps to reduce the pollutant in the flue gas
ESP
IDF
Auxiliaries Electrical Consumption Saving 0.5MW to 1MW
STACK FGD
Optimize
ESP Charge
Optimize
FGD
(induced draft fan)
Reduce Elec.
Consumption
Improve the
SO2 emission
SO2
Magna CA-5 advantages: Catalyst Direct Benefit
37Confidential
Tubes with ash,
and clinker build up Tubes coking
Magna CA-5 clean boiler walls and prevent from corrosion
Magna CA-5 advantages: Catalyst Direct Benefit
38Confidential
Clean Boiler & Optimized Combustion - reduce maintenance
Magna CA-5 will provide
3-5 days saving for each
scheduled outage
Production
Saving up
To 3-5M RM
Boiler
500-700MW
Magna CA-5 advantages: Catalyst Direct Benefit
39Confidential
Magna CA-5 save coal and energy saving
The improved heat transfer save
coal 8% to 20% and reduce the
electricity consumption of forced
fan (FOF) and induced draft fan
(IDF) up to 20%.
Magna CA-5 advantages: Summary
Direct Benefits
 Save coal and electricity, increase steam production and
reduce cost.
 Prevent pollution and reduce production of harmful gases.
 Clean boiler automatically(remove coke, namely, birds'
nest)
 Prevent boiler from rusting – extend lifetime
Indirect Benefits
 Save expenses for boiler cleaning.
 Reduce losses of shutdown and stop production caused by
cleaning of coke.
 Extend boiler life.
 Save electricity bill of forced draft fan and induced-draft fan.
 Reduce carriage expenses of coal.
 Save environmental expenses of pollution prevention.
 Transfer heat perfectly, increase steam production, increase
industrial efficiency and reduce cost.
 Reduce reconstruction, investment and subsequent
expenses of environmental technical equipments greatly.
40Confidential
SAN SAN MEWAH SDN BHD
Magna CA-5 Application
41Confidential
Magna CA-5 Application
42Confidential
Magna CA-5 automatic dosage
Magna CA-5 Application
43Confidential
1. Spray a few of catalysts upon fire bed to clean boiler before kindling.
2. Spray catalysts uniformly into coal and add two kilograms of catalysts into one ton of coal.
3. Both fine coal and lump coal can be used. Fine coal has the best effect.
Magna CA-5 Application
44Confidential
Magna CA-5 Application
45Confidential
Charging area
Magna CA-5 Application
46Confidential
Water tube
boiler
Coal
pulveriser &
drying
Air
Coal
Ash
Electric energy
Turbine
Pump
Desulpherisation
Stack
Condenser
Generator
NOX
removalDedusting
Charging area
Magna CA-5 Application
47Confidential
Charging area Charging area
Coal Dryer and Mills
SAN SAN MEWAH SDN BHD
48Confidential
Lab Test Report
Confidential 49
SGS Test Report
Confidential 50
SGS Test Report
Confidential 51
SGS Test Report
Confidential 52
Confidential 53
Confidential 54
MSDS Test Report
Confidential 55
MSDS Test Report
Confidential 56
MSDS Test Report
Confidential 57
MSDS Test Report
Confidential 58
MSDS Test Report
Confidential 59
MSDS Test Report
SAN SAN MEWAH SDN BHD
Catalyst Customer in Mongolia
60Confidential
61Confidential
Catalyst Customer in Mongolia ..
62Confidential
Catalyst Customer in Mongolia ..
63Confidential
Catalyst Customer in Mongolia ..
64
Catalyst Customer in Mongolia ..
Confidential
65
Catalyst Customer in Mongolia ..
Confidential
66
Catalyst Customer in Mongolia ..
Confidential
67
Catalyst Customer in Mongolia ..
Confidential
SAN SAN MEWAH SDN BHD
Catalyst Customer in China
68Confidential
Huadian Zhangqiu Profile
69Confidential
Huadian Zhangqiu Business in China
70Confidential
Some of Huadian Zhangqiu’s Power Plant
71Confidential
Shangdong East
Shangdong West
Shangxi
Catalyst usage in power plant
72Confidential
投
剂
口
Catalyst input point
in one of the plant
SAN SAN MEWAH SDN BHD
Catalyst Industry in Malaysia
73Confidential
Kapar Power Station situated in Klang, Selangor
74Confidential
Coal Consumption:
Daily 11,000 tons
Yearly 3,3 million tons
Yearly Catalyst 6,600 tons
Manjung Power Station situated in Lumut, Perak
75Confidential
Coal Consumption:
Daily 15,000 tons
Yearly 5,0 million tons
Yearly Catalyst 10,000 tons
Tanjung Bin Power Station in Pontian, Johor
76Confidential
Coal Consumption:
Daily 15,000 tons
Yearly 5,0 million tons
Yearly Catalyst 10,000 tons
Tanjung Bin Power Station in Pontian, Johor
77Confidential
Coal Consumption:
Daily 10,000 tons
Yearly 3,2 million tons
Yearly Catalyst 6,400 tons
Cement Plants in Malaysia
78Confidential
1.Lafarge Malayan Cement in Ipoh, Perak
2.Lafarge Malayan Cement in Langkawi
3.Lafarge Malayan Cement in Rawang
4.Holcim (Malaysia) Sdn. Bhd. In Pasir Gudang
5.YTL Cement Berhad (HQ) in Kuala Lumpur
6.Gopeng Berhad in Perak
7.Pahang Cement Sdn Bhd in Pahang
8.CIMA Cement Industries of Malaysia Sdn Bhd in Perlis
9.Negeri Sembilan Cement Industry Sdn Bhd N. Sembilan
Steel Industries in Malaysia
79Confidential
Confidential
Oil & Gas Industries in Malaysia
80Confidential
SAN SAN MEWAH SDN BHD
Catalyst Production Cost & Sales Price
81Confidential
82Confidential
Cost of Sales and Profits
For Production
Cost, Sales and
Profits – Refer to
Appendix A
Contact Person
83Confidential
Item Description
Name Ben Low Kam Woe
IC No 650213-10-5055
Address (H) No 9, Jalan Selampit 27,
Taman Klang Jaya,
41200 Klang, Selangor DE
Address (O) A-2-2A, Blok A,
Jalan GC 1, Glomac Cyberjaya,
63200 Cyberjaya,
Selangor Malaysia.
Email masbpuchong@yahoo.com
benlow65@yahoo.com
Tel (O): +603-8322 6110
Fax: +603-8064 2190
H/P: +6017-728 8399
Appendix A
Cashflow & PnL
SAN SAN MEWAH SDN BHD
Capital Expenditure
SAN SAN MEWAH SDN BHD
Capital Expenses
Descriptions Qty Price Total Qty Price Total Qty Price Total Qty Price Total Qty Price Total
Office Equipments
Office Equipments (Computers, Printers, etc) 1 64,102.56 64,102.56 0 0 0 0 0 0 0 0 0 0 0 0
Total 64,102.56
Depreciations (10%/Year) 6,410.26 6,410.26 6,410.26 6,410.26 6,410.26
Total Depreciations (Office Equipments) 6,410.26 6,410.26 6,410.26 6,410.26 6,410.26
Land/Office/factory Building
Land 1 696,923.08 696,923.08 0 0.00 0.00 0 0.00 0.00 0 0 0 0 0 0
Office Renovations 0 256,410.26 0.00 0 0 0 0 0 0 0 0 0 0 0 0
Building Construction (M&E) 1 1,463,076.92 1,463,076.92 0 0 0 0 0 0 0 0 0 0 0 0
Total 2,160,000.00 0.00 0.00
Depreciations (Land) (1%/Year) 6,969.23 6,969.23 6,969.23 6,969.23 6,969.23
Depreciations (renovations) 0.00 0.00 0.00 0.00 0.00
Depreciations (Building) (10%/Year) 146,307.69 146,307.69 146,307.69 146,307.69 146,307.69
Total Depreciations (Land/Office/factory Building) 153,276.92 153,276.92 153,276.92 153,276.92 153,276.92
Machinery/Containers
Machine 10 100,000.00 1,000,000.00 0 0 0 0 0 0 0 0 0 0 0 0
Specialised containers for catalysts 20 5,128.21 102,564.10
Total 1,102,564.10 0 0 0 0 0 0 0 0 0 0 0 0
Depreciations (10%/Year) 110256.4103 110256.41 110256.41 110256.41 110256.41
Total Depreciations (Machinery) 110256.4103 110256.41 110256.41 110256.41 110256.41
Company Vehicles
10 Ton Trucks 5 64,102.56 320,512.82 0 0 0 0 0 0 0 0 0 0 0 0
Forklifts 5 11,538.46 57,692.31 0 0 0 0 0 0 0 0 0 0 0 0
Total 378,205.13
Depreciations (10%/Year) 37820.51282 37820.5128 37820.5128 37820.5128 37820.5128
Total Depreciations (Vehicles) 37820.51282 37820.5128 37820.5128 37820.5128 37820.5128
Grand Total 3,704,871.79 0.00 0.00 0.00 0.00
Y1 Y2 Y3 Y4 Y5
Page 1 of 2
Capital Expenditure
SAN SAN MEWAH SDN BHD
Capital Expenses
Descriptions
Office Equipments
Office Equipments (Computers, Printers, etc)
Total
Depreciations (10%/Year)
Total Depreciations (Office Equipments)
Land/Office/factory Building
Land
Office Renovations
Building Construction (M&E)
Total
Depreciations (Land) (1%/Year)
Depreciations (renovations)
Depreciations (Building) (10%/Year)
Total Depreciations (Land/Office/factory Building)
Machinery/Containers
Machine
Specialised containers for catalysts
Total
Depreciations (10%/Year)
Total Depreciations (Machinery)
Company Vehicles
10 Ton Trucks
Forklifts
Total
Depreciations (10%/Year)
Total Depreciations (Vehicles)
Grand Total
Qty Price Total Qty Price Total Qty Price Total Qty Price Total Qty Price Total
0 151,515.15 0.00 NA NA NA NA NA NA NA NA NA NA NA NA
0.00
6,410.26 6,410.26 6,410.26 6,410.26 6,410.26
6,410.26 6,410.26 6,410.26 6,410.26 6,410.26
0 0 0 0 0 0 0 0 0 0 0 0 0 0 0
0 151,515.15 0.00 0 0 0 0 0 0 0 0 0 0 0 0
0 0 0 0 0 0 0 0 0 0 0 0 0 0 0
6,969.23 6,969.23 6,969.23 6,969.23 6,969.23
0.00 0.00 0.00 0.00 0.00
146,307.69 146,307.69 146,307.69 146,307.69 146,307.69
153,276.92 153,276.92 153,276.92 153,276.92 153,276.92
0 909,090.91 0.00 0 0 0 0 0 0 0 0 0 0 0 0
0 6,060.61 0.00
0.00 0 0 0 0 0 0 0 0 0 0 0 0
110256.41 110256.41 110256.41 110256.41 110256.41
110256.41 110256.41 110256.41 110256.41 110256.41
0 75,757.58 0.00 0 0 0 0 0 0 0 0 0 0 0 0
0 13,636.36 0.00 0 0 0 0 0 0 0 0 0 0 0 0
0.00
37820.5128 37820.5128 37820.5128 37820.5128 37820.5128
37820.5128 37820.5128 37820.5128 37820.5128 37820.5128
0.00 0.00 0.00 0.00 0.00
Y6 Y7 Y8 Y9 Y10
Page 2 of 2
Operating Expenditure (Monthly)
SAN SAN MEWAH SDN BHD
Operating Expenses (Monthly)
Month 1 Month 2 Month 3 Month 4 Month 5 Month 6 Month 7 Month 8 Month 9 Month 10 Month 11 Month 12
Marketing Expenditure
Promotion and Advertisement 5,128.21 5,128.21 5,128.21 5,128.21 5,128.21 5,128.21 5,128.21 5,128.21 5,128.21 5,128.21 5,128.21 5,128.21
Administrative Expenditure
Salaries 43,205.13 43,205.13 43,205.13 43,205.13 43,205.13 81,666.67 81,666.67 81,666.67 81,666.67 81,666.67 81,666.67 81,666.67
EPF 5,616.67 5,616.67 5,616.67 5,616.67 5,616.67 10,616.67 10,616.67 10,616.67 10,616.67 10,616.67 10,616.67 10,616.67
SOCSO 278.12 278.12 278.12 278.12 278.12 1,337.60 1,337.60 1,337.60 1,337.60 1,337.60 1,337.60 1,337.60
PSMB 432.05 432.05 432.05 432.05 432.05 816.67 816.67 816.67 816.67 816.67 816.67 816.67
Insurance (Hospitalisation & Term Life) 0.00 0.00 0.00 0.00 0.00 57,984.62 0.00 0.00 0.00 0.00 0.00 0.00
Employee Benefits (Medical-Out patient) 107.69 107.69 107.69 107.69 107.69 517.95 517.95 517.95 517.95 517.95 517.95 517.95
Additional Employee Benefits 0.00 0.00 0.00 0.00 0.00 2,481.84 2,481.84 2,481.84 2,481.84 2,481.84 2,481.84 2,481.84
Executive Chairman and Directors Allowances 4,871.79 4,871.79 4,871.79 4,871.79 4,871.79 4,871.79 4,871.79 4,871.79 4,871.79 4,871.79 4,871.79 4,871.79
Management (Tier 1) Allowances 3,846.15 3,846.15 3,846.15 3,846.15 3,846.15 3,846.15 3,846.15 3,846.15 3,846.15 3,846.15 3,846.15 3,846.15
Marketing Allowance 256.41 256.41 256.41 256.41 256.41 256.41 256.41 256.41 256.41 256.41 256.41 256.41
Professional Services & Consultation (10% from Total Project) 500,000.00 0.00 0.00 0.00 0.00 0.00 0.00 0.00 0.00 0.00 0.00 0.00
Factory Maintainance (RM0.35/sqft) 0.00 0.00 0.00 0.00 0.00 0.00 12,196.15 12,196.15 12,196.15 12,196.15 12,196.15 12,196.15
Factory and Office Utilities 2,564.10 2,564.10 2,564.10 2,564.10 2,564.10 2,564.10 19,230.77 19,230.77 19,230.77 19,230.77 19,230.77 19,230.77
Factory and Office Supplies 846.15 846.15 846.15 846.15 846.15 846.15 2,564.10 2,564.10 2,564.10 2,564.10 2,564.10 2,564.10
Insurance Company (0.4% from Total Capex Value) 0.00 0.00 0.00 0.00 0.00 0.00 148,194.87 0.00 0.00 0.00 0.00 0.00
Workers Levy 38,461.54 0.00 0.00 0.00 0.00 0.00 0.00 0.00 0.00 0.00 0.00 0.00
Business Travel 3,846.15 3,846.15 3,846.15 3,846.15 3,846.15 3,846.15 3,846.15 3,846.15 3,846.15 3,846.15 3,846.15 3,846.15
Licensing (DoE,MITI,KDN,etc) 25,641.03 0.00 0.00 0.00 0.00 0.00 0.00 0.00 0.00 0.00 0.00 0.00
Miscellaneous 5,128.21 5,128.21 5,128.21 5,128.21 5,128.21 5,128.21 5,128.21 5,128.21 5,128.21 5,128.21 5,128.21 5,128.21
Total/Month 640,229.40 76,126.83 76,126.83 76,126.83 76,126.83 181,909.18 302,700.21 154,505.34 154,505.34 154,505.34 154,505.34 154,505.34
Page 1 of 2
Operating Expenditure (Monthly)
SAN SAN MEWAH SDN BHD
Operating Expenses (Monthly)
Marketing Expenditure
Promotion and Advertisement
Administrative Expenditure
Salaries
EPF
SOCSO
PSMB
Insurance (Hospitalisation & Term Life)
Employee Benefits (Medical-Out patient)
Additional Employee Benefits
Executive Chairman and Directors Allowances
Management (Tier 1) Allowances
Marketing Allowance
Professional Services & Consultation (10% from Total Project)
Factory Maintainance (RM0.35/sqft)
Factory and Office Utilities
Factory and Office Supplies
Insurance Company (0.4% from Total Capex Value)
Workers Levy
Business Travel
Licensing (DoE,MITI,KDN,etc)
Miscellaneous
Total/Month
Month 13 Month 14 Month 15 Month 16 Month 17 Month 18 Month 19 Month 20 Month 21 Month 22 Month 23 Month 24 Total
5,128.21 5,128.21 5,128.21 5,128.21 5,128.21 5,128.21 5,128.21 5,128.21 5,128.21 5,128.21 5,128.21 5,128.21 123,076.92
85,750.00 85,750.00 85,750.00 85,750.00 85,750.00 85,750.00 85,750.00 85,750.00 85,750.00 85,750.00 85,750.00 85,750.00 1,816,692.31
11,147.50 11,147.50 11,147.50 11,147.50 11,147.50 11,147.50 11,147.50 11,147.50 11,147.50 11,147.50 11,147.50 11,147.50 236,170.00
1,337.60 1,337.60 1,337.60 1,337.60 1,337.60 1,337.60 1,337.60 1,337.60 1,337.60 1,337.60 1,337.60 1,337.60 26,805.03
857.50 857.50 857.50 857.50 857.50 857.50 857.50 857.50 857.50 857.50 857.50 857.50 18,166.92
0.00 0.00 0.00 0.00 0.00 0.00 57,984.62 0.00 0.00 0.00 0.00 0.00 115,969.23
517.95 517.95 517.95 517.95 517.95 517.95 517.95 517.95 517.95 517.95 517.95 517.95 10,379.49
2,481.84 2,481.84 2,481.84 2,481.84 2,481.84 2,481.84 2,481.84 2,481.84 2,481.84 2,481.84 2,481.84 2,481.84 47,154.91
4,871.79 4,871.79 4,871.79 4,871.79 4,871.79 4,871.79 4,871.79 4,871.79 4,871.79 4,871.79 4,871.79 4,871.79 116,923.08
3,846.15 3,846.15 3,846.15 3,846.15 3,846.15 3,846.15 3,846.15 3,846.15 3,846.15 3,846.15 3,846.15 3,846.15 92,307.69
256.41 256.41 256.41 256.41 256.41 256.41 256.41 256.41 256.41 256.41 256.41 256.41 6,153.85
0.00 0.00 0.00 0.00 0.00 0.00 0.00 0.00 0.00 0.00 0.00 0.00 500,000.00
12,196.15 12,196.15 12,196.15 12,196.15 12,196.15 12,196.15 12,196.15 12,196.15 12,196.15 12,196.15 12,196.15 12,196.15 219,530.77
19,230.77 19,230.77 19,230.77 19,230.77 19,230.77 19,230.77 19,230.77 19,230.77 19,230.77 19,230.77 19,230.77 19,230.77 361,538.46
2,564.10 2,564.10 2,564.10 2,564.10 2,564.10 2,564.10 2,564.10 2,564.10 2,564.10 2,564.10 2,564.10 2,564.10 51,230.77
0.00 0.00 0.00 0.00 0.00 0.00 0.00 0.00 0.00 0.00 0.00 0.00 148,194.87
40,384.62 0.00 0.00 0.00 0.00 0.00 0.00 0.00 0.00 0.00 0.00 0.00 78,846.15
3,846.15 3,846.15 3,846.15 3,846.15 3,846.15 3,846.15 3,846.15 3,846.15 3,846.15 3,846.15 3,846.15 3,846.15 92,307.69
25,641.03 0.00 0.00 0.00 0.00 0.00 0.00 0.00 0.00 0.00 0.00 0.00 51,282.05
5,128.21 5,128.21 5,128.21 5,128.21 5,128.21 5,128.21 5,128.21 5,128.21 5,128.21 5,128.21 5,128.21 5,128.21 123,076.92
225,185.98 159,160.34 159,160.34 159,160.34 159,160.34 159,160.34 217,144.95 159,160.34 159,160.34 159,160.34 159,160.34 159,160.34 4,235,807.12
Page 2 of 2
Operating Expenditure (Yearly)
SAN SAN MEWAH SDN BHD
Operating Expenses (Yearly)
Year 1 Year 2 Year 3 Year 4 Year 5 Year 6 Year 7 Year 8 Year 9 Year 10 Total
Marketing Expenditure
Promotion and Advertisement 72,727.27 72,727.27 72,727.27 72,727.27 72,727.27 72,727.27 72,727.27 72,727.27 72,727.27 72,727.27 727,272.73
Administrative Expenditure
Salaries 787,692.31 1,029,000.00 1,080,450.00 1,134,472.50 1,191,196.13 1,250,755.93 1,313,293.73 1,378,958.41 1,447,906.33 1,520,301.65 12,134,026.99
EPF 102,400.00 133,770.00 140,458.50 147,481.43 154,855.50 162,598.27 170,728.18 179,264.59 188,227.82 197,639.21 1,577,423.51
SOCSO 10,753.79 16,051.23 16,051.23 16,051.23 16,051.23 16,051.23 16,051.23 16,051.23 16,051.23 16,051.23 155,214.87
PSMB 7,876.92 10,290.00 10,804.50 11,344.73 11,911.96 12,507.56 13,132.94 13,789.58 14,479.06 15,203.02 121,340.27
Insurance (Hospitalisation & Term Life) 57,984.62 57,984.62 57,984.62 57,984.62 57,984.62 57,984.62 57,984.62 57,984.62 57,984.62 57,984.62 579,846.15
Employee Benefits (Medical-Out patient) 4,164.10 6,215.38 6,215.38 6,215.38 6,215.38 6,215.38 6,215.38 6,215.38 6,215.38 6,215.38 60,102.56
Additional Employee Benefits 17,372.86 29,782.05 29,782.05 29,782.05 29,782.05 29,782.05 29,782.05 29,782.05 29,782.05 29,782.05 285,411.32
Executive Chairman and Directors Allowances 58,461.54 58,461.54 58,461.54 58,461.54 58,461.54 58,461.54 58,461.54 58,461.54 58,461.54 58,461.54 584,615.38
Management (Tier 1) Allowances 46,153.85 46,153.85 46,153.85 46,153.85 46,153.85 46,153.85 46,153.85 46,153.85 46,153.85 46,153.85 461,538.46
Marketing Allowance 3,076.92 3,076.92 3,076.92 3,076.92 3,076.92 3,076.92 3,076.92 3,076.92 3,076.92 3,076.92 30,769.23
Professional Services & Consultation (10% from Total Project) 500,000.00 0.00 0.00 0.00 0.00 0.00 0.00 0.00 0.00 0.00 500,000.00
Factory Maintainance (RM0.35/sqft) 73,176.92 146,353.85 146,353.85 146,353.85 146,353.85 146,353.85 146,353.85 146,353.85 146,353.85 146,353.85 1,390,361.54
Factory and Office Utilities 130,769.23 230,769.23 230,769.23 230,769.23 230,769.23 230,769.23 230,769.23 230,769.23 230,769.23 230,769.23 2,207,692.31
Factory and Office Supplies 20,461.54 30,769.23 30,769.23 30,769.23 30,769.23 30,769.23 30,769.23 30,769.23 30,769.23 30,769.23 297,384.62
Insurance Company (0.4% from Total Capex Value) 148,194.87 155,604.62 163,384.85 171,554.09 180,131.79 189,138.38 198,595.30 208,525.07 218,951.32 229,898.89 1,863,979.17
Workers Levy 38,461.54 40,384.62 42,403.85 44,524.04 46,750.24 49,087.75 51,542.14 54,119.25 56,825.21 59,666.47 483,765.10
Business Travel 46,153.85 46,153.85 46,153.85 46,153.85 46,153.85 46,153.85 46,153.85 46,153.85 46,153.85 46,153.85 461,538.46
Licensing (DoE,MITI,KDN,etc) 25,641.03 25,641.03 25,641.03 25,641.03 25,641.03 25,641.03 25,641.03 25,641.03 25,641.03 25,641.03 256,410.26
Miscellaneous 61,538.46 61,538.46 61,538.46 61,538.46 61,538.46 61,538.46 61,538.46 61,538.46 61,538.46 61,538.46 615,384.62
Total/Year 2,213,061.62 2,200,727.73 2,269,180.20 2,341,055.28 2,416,524.12 2,495,766.40 2,578,970.79 2,666,335.41 2,758,068.25 2,854,387.74 24,794,077.55
Page 1 of 1
Revenue
SAN SAN MEWAH SDN BHD
Revenue Calculation
CATALYSTS PRODUCTIONS
Year 1 Year 2 Year 3 Year 4 Year 5 Year 6 Year 7 Year 8 Year 9 Year 10
Items
Sales 52,761,538.46 110,799,230.77 116,339,192.31 122,156,151.92 122,156,151.92 122,156,151.92 122,156,151.92 122,156,151.92 122,156,151.92 122,156,151.92
Cost 23,846,153.85 47,692,307.69 47,692,307.69 47,692,307.69 47,692,307.69 47,692,307.69 47,692,307.69 47,692,307.69 47,692,307.69 47,692,307.69
Profit 28,915,384.62 63,106,923.08 68,646,884.62 74,463,844.23 74,463,844.23 74,463,844.23 74,463,844.23 74,463,844.23 74,463,844.23 74,463,844.23
Remarks: Increment by 5% 1846.653846 1938.99 2035.94 2035.94 2035.94 2035.94 2035.94 2035.94 2035.94
1. 1 production lines = 2 machines
2. 1 Machine can produce 500 MT/Month
Productions Cost
Year 1 Year 2 Year 3 Year 4 Year 5 Year 6 Year 7 Year 8 Year 9 Year 10
Items
Raw Materials 23,076,923.08 46,153,846.15 46,153,846.15 46,153,846.15 46,153,846.15 46,153,846.15 46,153,846.15 46,153,846.15 46,153,846.15 46,153,846.15
Transportation 769,230.77 1,538,461.54 1,538,461.54 1,538,461.54 1,538,461.54 1,538,461.54 1,538,461.54 1,538,461.54 1,538,461.54 1,538,461.54
Total Production Cost 23,846,153.85 47,692,307.69 47,692,307.69 47,692,307.69 47,692,307.69 47,692,307.69 47,692,307.69 47,692,307.69 47,692,307.69 47,692,307.69
Page 1 of 1
Cash Flow (Monthly)
SAN SAN MEWAH SDN BHD
Cashflow (Monthly)
Month 1 2 3 4 5 6 7 8 9 10 11 12
CASH IN FLOW:
Capital
Investor 5,000,000.00
a)Sales Of Catalysts 0.00 0.00 0.00 0.00 0.00 0.00 8,793,589.74 8,793,589.74 8,793,589.74 8,793,589.74 8,793,589.74 8,793,589.74
TOTAL CASH IN FLOW 5,000,000.00 0.00 0.00 0.00 0.00 0.00 8,793,589.74 8,793,589.74 8,793,589.74 8,793,589.74 8,793,589.74 8,793,589.74
CASH OUT FLOW:
Cost Of Sales
a) Production Cost 0.00 0.00 0.00 0.00 0.00 0.00 3,974,358.97 3,974,358.97 3,974,358.97 3,974,358.97 3,974,358.97 3,974,358.97
b) GST (6%) 0.00 0.00 0.00 0.00 0.00 0.00 527,615.38 527,615.38 527,615.38 527,615.38 527,615.38 527,615.38
Marketing Expenditure
Promotion and Advertisement 5,128.21 5,128.21 5,128.21 5,128.21 5,128.21 5,128.21 5,128.21 5,128.21 5,128.21 5,128.21 5,128.21 5,128.21
Administrative Expenditure
Salaries 43,205.13 43,205.13 43,205.13 43,205.13 43,205.13 81,666.67 81,666.67 81,666.67 81,666.67 81,666.67 81,666.67 81,666.67
EPF 5,616.67 5,616.67 5,616.67 5,616.67 5,616.67 10,616.67 10,616.67 10,616.67 10,616.67 10,616.67 10,616.67 10,616.67
SOCSO 278.12 278.12 278.12 278.12 278.12 1,337.60 1,337.60 1,337.60 1,337.60 1,337.60 1,337.60 1,337.60
PSMB 432.05 432.05 432.05 432.05 432.05 816.67 816.67 816.67 816.67 816.67 816.67 816.67
Insurance (Hospitalisation & Term Life) 0.00 0.00 0.00 0.00 0.00 57,984.62 0.00 0.00 0.00 0.00 0.00 0.00
Employee Benefits (Medical-Out patient) 107.69 107.69 107.69 107.69 107.69 517.95 517.95 517.95 517.95 517.95 517.95 517.95
Additional Employee Benefits 0.00 0.00 0.00 0.00 0.00 2,481.84 2,481.84 2,481.84 2,481.84 2,481.84 2,481.84 2,481.84
Executive Chairman and Directors Allowances 4,871.79 4,871.79 4,871.79 4,871.79 4,871.79 4,871.79 4,871.79 4,871.79 4,871.79 4,871.79 4,871.79 4,871.79
Management (Tier 1) Allowances 3,846.15 3,846.15 3,846.15 3,846.15 3,846.15 3,846.15 3,846.15 3,846.15 3,846.15 3,846.15 3,846.15 3,846.15
Marketing Allowance 256.41 256.41 256.41 256.41 256.41 256.41 256.41 256.41 256.41 256.41 256.41 256.41
Professional Services & Consultation (10% from Total Project) 500,000.00 0.00 0.00 0.00 0.00 0.00 0.00 0.00 0.00 0.00 0.00 0.00
Factory Maintainance (RM0.35/sqft) 0.00 0.00 0.00 0.00 0.00 0.00 12,196.15 12,196.15 12,196.15 12,196.15 12,196.15 12,196.15
Factory and Office Utilities 2,564.10 2,564.10 2,564.10 2,564.10 2,564.10 2,564.10 19,230.77 19,230.77 19,230.77 19,230.77 19,230.77 19,230.77
Factory and Office Supplies 846.15 846.15 846.15 846.15 846.15 846.15 2,564.10 2,564.10 2,564.10 2,564.10 2,564.10 2,564.10
Insurance Company (0.4% from Total Capex Value) 0.00 0.00 0.00 0.00 0.00 0.00 148,194.87 0.00 0.00 0.00 0.00 0.00
Workers Levy 38,461.54 0.00 0.00 0.00 0.00 0.00 0.00 0.00 0.00 0.00 0.00 0.00
Business Travel 3,846.15 3,846.15 3,846.15 3,846.15 3,846.15 3,846.15 3,846.15 3,846.15 3,846.15 3,846.15 3,846.15 3,846.15
Licensing (DoE,MITI,KDN,etc) 25,641.03 0.00 0.00 0.00 0.00 0.00 0.00 0.00 0.00 0.00 0.00 0.00
Miscellaneous 5,128.21 5,128.21 5,128.21 5,128.21 5,128.21 5,128.21 5,128.21 5,128.21 5,128.21 5,128.21 5,128.21 5,128.21
Bank Charge 256.41 256.41 256.41 256.41 256.41 256.41 256.41 256.41 256.41 256.41 256.41 256.41
Capital Expenditure
Purchase Of Fixed Assets 3,704,871.79 0.00 0.00 0.00 0.00 0.00 0.00 0.00 0.00 0.00 0.00 0.00
Loan Repayment 0.00 0.00 0.00 0.00 0.00 0.00 0.00 0.00 0.00 0.00 0.00 0.00
TOTAL CASH OUT FLOW 4,345,357.60 76,383.24 76,383.24 76,383.24 76,383.24 182,165.59 4,804,930.98 4,656,736.11 4,656,736.11 4,656,736.11 4,656,736.11 4,656,736.11
NET SURPLUS/(DEFICIT) 654,642.40 (76,383.24) (76,383.24) (76,383.24) (76,383.24) (182,165.59) 3,988,658.76 4,136,853.64 4,136,853.64 4,136,853.64 4,136,853.64 4,136,853.64
CUMULATIVE NET SURPLUS/(DEFICIT) 654,642.40 578,259.15 501,875.91 425,492.67 349,109.42 166,943.83 4,155,602.59 8,292,456.23 12,429,309.87 16,566,163.50 20,703,017.14 24,839,870.78
PROJECTED STATEMENT OF CASH FLOW FOR MONTH 1 TO MONTH 24
Page 1 of 2
Cash Flow (Monthly)
SAN SAN MEWAH SDN BHD
Cashflow (Monthly)
Month
CASH IN FLOW:
Capital
Investor
a)Sales Of Catalysts
TOTAL CASH IN FLOW
CASH OUT FLOW:
Cost Of Sales
a) Production Cost
b) GST (6%)
Marketing Expenditure
Promotion and Advertisement
Administrative Expenditure
Salaries
EPF
SOCSO
PSMB
Insurance (Hospitalisation & Term Life)
Employee Benefits (Medical-Out patient)
Additional Employee Benefits
Executive Chairman and Directors Allowances
Management (Tier 1) Allowances
Marketing Allowance
Professional Services & Consultation (10% from Total Project)
Factory Maintainance (RM0.35/sqft)
Factory and Office Utilities
Factory and Office Supplies
Insurance Company (0.4% from Total Capex Value)
Workers Levy
Business Travel
Licensing (DoE,MITI,KDN,etc)
Miscellaneous
Bank Charge
Capital Expenditure
Purchase Of Fixed Assets
Loan Repayment
TOTAL CASH OUT FLOW
NET SURPLUS/(DEFICIT)
CUMULATIVE NET SURPLUS/(DEFICIT)
PROJECTED STATEMENT OF CASH FLOW FOR MONTH 1 TO MONTH 24
13 14 15 16 17 18 19 20 21 22 23 24 Total
0.00
5,000,000.00
9,233,269.23 9,233,269.23 9,233,269.23 9,233,269.23 9,233,269.23 9,233,269.23 9,233,269.23 9,233,269.23 9,233,269.23 9,233,269.23 9,233,269.23 9,233,269.23 163,560,769.23
9,233,269.23 9,233,269.23 9,233,269.23 9,233,269.23 9,233,269.23 9,233,269.23 9,233,269.23 9,233,269.23 9,233,269.23 9,233,269.23 9,233,269.23 9,233,269.23 168,560,769.23
3,974,358.97 3,974,358.97 3,974,358.97 3,974,358.97 3,974,358.97 3,974,358.97 3,974,358.97 3,974,358.97 3,974,358.97 3,974,358.97 3,974,358.97 3,974,358.97 71,538,461.54
553,996.15 553,996.15 553,996.15 553,996.15 553,996.15 553,996.15 553,996.15 553,996.15 553,996.15 553,996.15 553,996.15 553,996.15 9,813,646.15
5,128.21 5,128.21 5,128.21 5,128.21 5,128.21 5,128.21 5,128.21 5,128.21 5,128.21 5,128.21 5,128.21 5,128.21 123,076.92
85,750.00 85,750.00 85,750.00 85,750.00 85,750.00 85,750.00 85,750.00 85,750.00 85,750.00 85,750.00 85,750.00 85,750.00 1,816,692.31
11,147.50 11,147.50 11,147.50 11,147.50 11,147.50 11,147.50 11,147.50 11,147.50 11,147.50 11,147.50 11,147.50 11,147.50 236,170.00
1,337.60 1,337.60 1,337.60 1,337.60 1,337.60 1,337.60 1,337.60 1,337.60 1,337.60 1,337.60 1,337.60 1,337.60 26,805.03
857.50 857.50 857.50 857.50 857.50 857.50 857.50 857.50 857.50 857.50 857.50 857.50 18,166.92
0.00 0.00 0.00 0.00 0.00 0.00 57,984.62 0.00 0.00 0.00 0.00 0.00 115,969.23
517.95 517.95 517.95 517.95 517.95 517.95 517.95 517.95 517.95 517.95 517.95 517.95 10,379.49
2,481.84 2,481.84 2,481.84 2,481.84 2,481.84 2,481.84 2,481.84 2,481.84 2,481.84 2,481.84 2,481.84 2,481.84 47,154.91
4,871.79 4,871.79 4,871.79 4,871.79 4,871.79 4,871.79 4,871.79 4,871.79 4,871.79 4,871.79 4,871.79 4,871.79 116,923.08
3,846.15 3,846.15 3,846.15 3,846.15 3,846.15 3,846.15 3,846.15 3,846.15 3,846.15 3,846.15 3,846.15 3,846.15 92,307.69
256.41 256.41 256.41 256.41 256.41 256.41 256.41 256.41 256.41 256.41 256.41 256.41 6,153.85
0.00 0.00 0.00 0.00 0.00 0.00 0.00 0.00 0.00 0.00 0.00 0.00 500,000.00
12,196.15 12,196.15 12,196.15 12,196.15 12,196.15 12,196.15 12,196.15 12,196.15 12,196.15 12,196.15 12,196.15 12,196.15 219,530.77
19,230.77 19,230.77 19,230.77 19,230.77 19,230.77 19,230.77 19,230.77 19,230.77 19,230.77 19,230.77 19,230.77 19,230.77 361,538.46
2,564.10 2,564.10 2,564.10 2,564.10 2,564.10 2,564.10 2,564.10 2,564.10 2,564.10 2,564.10 2,564.10 2,564.10 51,230.77
0.00 0.00 0.00 0.00 0.00 0.00 0.00 0.00 0.00 0.00 0.00 0.00 148,194.87
40,384.62 0.00 0.00 0.00 0.00 0.00 0.00 0.00 0.00 0.00 0.00 0.00 78,846.15
3,846.15 3,846.15 3,846.15 3,846.15 3,846.15 3,846.15 3,846.15 3,846.15 3,846.15 3,846.15 3,846.15 3,846.15 92,307.69
25,641.03 0.00 0.00 0.00 0.00 0.00 0.00 0.00 0.00 0.00 0.00 0.00 51,282.05
5,128.21 5,128.21 5,128.21 5,128.21 5,128.21 5,128.21 5,128.21 5,128.21 5,128.21 5,128.21 5,128.21 5,128.21 123,076.92
256.41 256.41 256.41 256.41 256.41 256.41 256.41 256.41 256.41 256.41 256.41 256.41 6,153.85
0.00 0.00 0.00 0.00 0.00 0.00 0.00 0.00 0.00 0.00 0.00 0.00 3,704,871.79
0.00 0.00 0.00 0.00 0.00 0.00 0.00 0.00 0.00 0.00 0.00 0.00 0.00
4,753,797.52 4,687,771.88 4,687,771.88 4,687,771.88 4,687,771.88 4,687,771.88 4,745,756.49 4,687,771.88 4,687,771.88 4,687,771.88 4,687,771.88 4,687,771.88 89,298,940.45
4,479,471.71 4,545,497.35 4,545,497.35 4,545,497.35 4,545,497.35 4,545,497.35 4,487,512.74 4,545,497.35 4,545,497.35 4,545,497.35 4,545,497.35 4,545,497.35 79,261,828.78
29,319,342.49 33,864,839.85 38,410,337.20 42,955,834.56 47,501,331.91 52,046,829.26 56,534,342.00 61,079,839.36 65,625,336.71 70,170,834.07 74,716,331.42 79,261,828.78
PROJECTED STATEMENT OF CASH FLOW FOR MONTH 1 TO MONTH 24
Page 2 of 2
Projected Cash Flow for the First 2 Years
5.00
0.00
0.00
0.00
0.00
0.00
8.79
8.79
8.79
8.79
8.79
8.79
9.23
9.23
9.23
9.23
9.23
9.23
9.23
9.23
9.23
9.23
9.23
9.23
4.35
0.08
0.08
0.08
0.08
0.18
4.80
4.66
4.66
4.66
4.66
4.66
4.75
4.69
4.69
4.69
4.69
4.69
4.75
4.69
4.69
4.69
4.69
4.69
0.65
0.58
0.50
0.43
0.35
0.17
4.16
8.29
12.43
16.57
20.70
24.84
29.32
33.86
38.41
42.96
47.50
52.05
56.53
61.08
65.63
70.17
74.72
79.26
0.00
10.00
20.00
30.00
40.00
50.00
60.00
70.00
80.00
90.00
1 2 3 4 5 6 7 8 9 10 11 12 13 14 15 16 17 18 19 20 21 22 23 24
Millions
TOTAL CASH IN FLOW
TOTAL CASH OUT FLOW
CUMULATIVE NET SURPLUS/(DEFICIT)
Cash Flow (Yearly)
SAN SAN MEWAH SDN BHD
Cashflow Yearly
Year 1 2 3 4 5 6 7 8 9 10 Total
CASH IN FLOW:
Capital 0.00
Investor 5,000,000.00 5,000,000.00
a)Sales Of Catalysts 52,761,538.46 110,799,230.77 116,339,192.31 122,156,151.92 122,156,151.92 122,156,151.92 122,156,151.92 122,156,151.92 122,156,151.92 122,156,151.92 1,134,993,025.00
TOTAL CASH IN FLOW 57,761,538.46 110,799,230.77 116,339,192.31 122,156,151.92 122,156,151.92 122,156,151.92 122,156,151.92 122,156,151.92 122,156,151.92 122,156,151.92 1,139,993,025.00
CASH OUT FLOW:
Cost Of Sales
a) Production Cost 23,846,153.85 47,692,307.69 47,692,307.69 47,692,307.69 47,692,307.69 47,692,307.69 47,692,307.69 47,692,307.69 47,692,307.69 47,692,307.69 453,076,923.08
b) GST (6%) 3,165,692.31 6,647,953.85 6,980,351.54 7,329,369.12 7,329,369.12 7,329,369.12 7,329,369.12 7,329,369.12 7,329,369.12 7,329,369.12 68,099,581.50
Marketing Expenditure
Promotion and Advertisement 72,727.27 72,727.27 72,727.27 72,727.27 72,727.27 72,727.27 72,727.27 72,727.27 72,727.27 72,727.27 727,272.73
Administrative Expenditure
Salaries 787,692.31 1,029,000.00 1,080,450.00 1,134,472.50 1,191,196.13 1,250,755.93 1,313,293.73 1,378,958.41 1,447,906.33 1,520,301.65 12,134,026.99
EPF 102,400.00 133,770.00 140,458.50 147,481.43 154,855.50 162,598.27 170,728.18 179,264.59 188,227.82 197,639.21 1,577,423.51
SOCSO 10,753.79 16,051.23 16,051.23 16,051.23 16,051.23 16,051.23 16,051.23 16,051.23 16,051.23 16,051.23 155,214.87
PSMB 7,876.92 10,290.00 10,804.50 11,344.73 11,911.96 12,507.56 13,132.94 13,789.58 14,479.06 15,203.02 121,340.27
Insurance (Hospitalisation & Term Life) 57,984.62 57,984.62 57,984.62 57,984.62 57,984.62 57,984.62 57,984.62 57,984.62 57,984.62 57,984.62 579,846.15
Employee Benefits (Medical-Out patient) 4,164.10 6,215.38 6,215.38 6,215.38 6,215.38 6,215.38 6,215.38 6,215.38 6,215.38 6,215.38 60,102.56
Additional Employee Benefits 17,372.86 29,782.05 29,782.05 29,782.05 29,782.05 29,782.05 29,782.05 29,782.05 29,782.05 29,782.05 285,411.32
Executive Chairman and Directors Allowances 58,461.54 58,461.54 58,461.54 58,461.54 58,461.54 58,461.54 58,461.54 58,461.54 58,461.54 58,461.54 584,615.38
Management (Tier 1) Allowances 46,153.85 46,153.85 46,153.85 46,153.85 46,153.85 46,153.85 46,153.85 46,153.85 46,153.85 46,153.85 461,538.46
Marketing Allowance 3,076.92 3,076.92 3,076.92 3,076.92 3,076.92 3,076.92 3,076.92 3,076.92 3,076.92 3,076.92 30,769.23
Professional Services & Consultation (10% from Total Project) 500,000.00 0.00 0.00 0.00 0.00 0.00 0.00 0.00 0.00 0.00 500,000.00
Factory Maintainance (RM0.35/sqft) 73,176.92 146,353.85 146,353.85 146,353.85 146,353.85 146,353.85 146,353.85 146,353.85 146,353.85 146,353.85 1,390,361.54
Factory and Office Utilities 130,769.23 230,769.23 230,769.23 230,769.23 230,769.23 230,769.23 230,769.23 230,769.23 230,769.23 230,769.23 2,207,692.31
Factory and Office Supplies 20,461.54 30,769.23 30,769.23 30,769.23 30,769.23 30,769.23 30,769.23 30,769.23 30,769.23 30,769.23 297,384.62
Insurance Company (0.4% from Total Capex Value) 148,194.87 155,604.62 163,384.85 171,554.09 180,131.79 189,138.38 198,595.30 208,525.07 218,951.32 229,898.89 1,863,979.17
Workers Levy 38,461.54 40,384.62 42,403.85 44,524.04 46,750.24 49,087.75 51,542.14 54,119.25 56,825.21 59,666.47 483,765.10
Business Travel 46,153.85 46,153.85 46,153.85 46,153.85 46,153.85 46,153.85 46,153.85 46,153.85 46,153.85 46,153.85 461,538.46
Licensing (DoE,MITI,KDN,etc) 25,641.03 25,641.03 25,641.03 25,641.03 25,641.03 25,641.03 25,641.03 25,641.03 25,641.03 25,641.03 256,410.26
Miscellaneous 61,538.46 61,538.46 61,538.46 61,538.46 61,538.46 61,538.46 61,538.46 61,538.46 61,538.46 61,538.46 615,384.62
Bank Charge 3,076.92 3,076.92 3,076.92 3,076.92 3,076.92 3,076.92 3,076.92 3,076.92 3,076.92 3,076.92 30,769.23
Capital Expenditure
Purchase Of Fixed Assets 3,704,871.79 0.00 0.00 0.00 0.00 0.00 0.00 0.00 0.00 0.00 3,704,871.79
Loan Repayment 0.00 0.00 0.00 0.00 0.00 0.00 0.00 0.00 0.00 0.00 0.00
TOTAL CASH OUT FLOW 32,932,856.49 56,544,066.20 56,944,916.35 57,365,809.01 57,441,277.85 57,520,520.13 57,603,724.53 57,691,089.14 57,782,821.99 57,879,141.47 549,706,223.16
NET SURPLUS/(DEFICIT) 24,828,681.97 54,255,164.57 59,394,275.96 64,790,342.91 64,714,874.07 64,635,631.79 64,552,427.40 64,465,062.78 64,373,329.94 64,277,010.45 590,286,801.84
CUMULATIVE NET SURPLUS/(DEFICIT) 24,828,681.97 79,083,846.54 138,478,122.50 203,268,465.41 267,983,339.48 332,618,971.28 397,171,398.67 461,636,461.46 526,009,791.39 590,286,801.84
PROJECTED STATEMENT OF CASH FLOW FOR YEAR 1 TO YEAR 10
Page 1 of 1
Projected Cash Flow for 10 Years
57.76
110.80
116.34
122.16
122.16
122.16
122.16
122.16
122.16
122.16
32.93
56.54
56.94
57.37
57.44
57.52
57.60
57.69
57.78
57.88
24.83
79.08
138.48
203.27
267.98
332.62
397.17
461.64
526.01
590.29
0.00
100.00
200.00
300.00
400.00
500.00
600.00
700.00
1 2 3 4 5 6 7 8 9 10
Millions
TOTAL CASH IN FLOW
TOTAL CASH OUT FLOW
CUMULATIVE NET SURPLUS/(DEFICIT)
P&L (Yearly)
SAN SAN MEWAH SDN BHD
Profit & Loss
Year 1
(USD)
2
(USD)
3
(USD)
4
(USD)
5
(USD)
6
(USD)
7
(USD)
8
(USD)
9
(USD)
10
(USD)
Total
(USD)
SALES:
a)Sales Of Catalysts 52,761,538.46 110,799,230.77 116,339,192.31 122,156,151.92 122,156,151.92 122,156,151.92 122,156,151.92 122,156,151.92 122,156,151.92 122,156,151.92 1,134,993,025.00
Total Sales 52,761,538.46 110,799,230.77 116,339,192.31 122,156,151.92 122,156,151.92 122,156,151.92 122,156,151.92 122,156,151.92 122,156,151.92 122,156,151.92 1,134,993,025.00
Cost Of Sales
a) Production Cost 23,846,153.85 47,692,307.69 47,692,307.69 47,692,307.69 47,692,307.69 47,692,307.69 47,692,307.69 47,692,307.69 47,692,307.69 47,692,307.69 453,076,923.08
b) GST (6%) 3,165,692.31 6,647,953.85 6,980,351.54 7,329,369.12 7,329,369.12 7,329,369.12 7,329,369.12 7,329,369.12 7,329,369.12 7,329,369.12 68,099,581.50
Total cost of sales 27,011,846.15 54,340,261.54 54,672,659.23 55,021,676.81 55,021,676.81 55,021,676.81 55,021,676.81 55,021,676.81 55,021,676.81 55,021,676.81 521,176,504.58
GROSS PROFIT 25,749,692.31 56,458,969.23 61,666,533.08 67,134,475.12 67,134,475.12 67,134,475.12 67,134,475.12 67,134,475.12 67,134,475.12 67,134,475.12 613,816,520.42
LESS:
Marketing Expenditure
Promotion and Advertisement 72,727.27 72,727.27 72,727.27 72,727.27 72,727.27 72,727.27 72,727.27 72,727.27 72,727.27 72,727.27 727,272.73
Administrative Expenditure
Salaries 787,692.31 1,029,000.00 1,080,450.00 1,134,472.50 1,191,196.13 1,250,755.93 1,313,293.73 1,378,958.41 1,447,906.33 1,520,301.65 12,134,026.99
EPF 102,400.00 133,770.00 140,458.50 147,481.43 154,855.50 162,598.27 170,728.18 179,264.59 188,227.82 197,639.21 1,577,423.51
SOCSO 10,753.79 16,051.23 16,051.23 16,051.23 16,051.23 16,051.23 16,051.23 16,051.23 16,051.23 16,051.23 155,214.87
PSMB 7,876.92 10,290.00 10,804.50 11,344.73 11,911.96 12,507.56 13,132.94 13,789.58 14,479.06 15,203.02 121,340.27
Insurance (Hospitalisation & Term Life) 57,984.62 57,984.62 57,984.62 57,984.62 57,984.62 57,984.62 57,984.62 57,984.62 57,984.62 57,984.62 579,846.15
Employee Benefits (Medical-Out patient) 4,164.10 6,215.38 6,215.38 6,215.38 6,215.38 6,215.38 6,215.38 6,215.38 6,215.38 6,215.38 60,102.56
Additional Employee Benefits 17,372.86 29,782.05 29,782.05 29,782.05 29,782.05 29,782.05 29,782.05 29,782.05 29,782.05 29,782.05 285,411.32
Executive Chairman and Directors Allowances 58,461.54 58,461.54 58,461.54 58,461.54 58,461.54 58,461.54 58,461.54 58,461.54 58,461.54 58,461.54 584,615.38
Management (Tier 1) Allowances 46,153.85 46,153.85 46,153.85 46,153.85 46,153.85 46,153.85 46,153.85 46,153.85 46,153.85 46,153.85 461,538.46
Marketing Allowance 3,076.92 3,076.92 3,076.92 3,076.92 3,076.92 3,076.92 3,076.92 3,076.92 3,076.92 3,076.92 30,769.23
Professional Services & Consultation (10% from Total Project) 500,000.00 0.00 0.00 0.00 0.00 0.00 0.00 0.00 0.00 0.00 500,000.00
Factory Maintainance (RM0.35/sqft) 73,176.92 146,353.85 146,353.85 146,353.85 146,353.85 146,353.85 146,353.85 146,353.85 146,353.85 146,353.85 1,390,361.54
Factory and Office Utilities 130,769.23 230,769.23 230,769.23 230,769.23 230,769.23 230,769.23 230,769.23 230,769.23 230,769.23 230,769.23 2,207,692.31
Factory and Office Supplies 20,461.54 30,769.23 30,769.23 30,769.23 30,769.23 30,769.23 30,769.23 30,769.23 30,769.23 30,769.23 297,384.62
Insurance Company (0.4% from Total Capex Value) 148,194.87 155,604.62 163,384.85 171,554.09 180,131.79 189,138.38 198,595.30 208,525.07 218,951.32 229,898.89 1,863,979.17
Workers Levy 38,461.54 40,384.62 42,403.85 44,524.04 46,750.24 49,087.75 51,542.14 54,119.25 56,825.21 59,666.47 483,765.10
Business Travel 46,153.85 46,153.85 46,153.85 46,153.85 46,153.85 46,153.85 46,153.85 46,153.85 46,153.85 46,153.85 461,538.46
Licensing (DoE,MITI,KDN,etc) 25,641.03 25,641.03 25,641.03 25,641.03 25,641.03 25,641.03 25,641.03 25,641.03 25,641.03 25,641.03 256,410.26
Miscellaneous 61,538.46 61,538.46 61,538.46 61,538.46 61,538.46 61,538.46 61,538.46 61,538.46 61,538.46 61,538.46 615,384.62
Bank Charge 3,076.92 3,076.92 3,076.92 3,076.92 3,076.92 3,076.92 3,076.92 3,076.92 3,076.92 3,076.92 30,769.23
TOTAL OPERATING EXPENDITURE 2,216,138.55 2,203,804.66 2,272,257.12 2,344,132.20 2,419,601.04 2,498,843.32 2,582,047.72 2,669,412.33 2,761,145.18 2,857,464.67 24,824,846.79
Depreciations (Office Equipments) 6,410.26 6,410.26 6,410.26 6,410.26 6,410.26 6,410.26 6,410.26 6,410.26 6,410.26 6,410.26 64,102.56
Depreciations (Land/Office/Factory Building) 153,276.92 153,276.92 153,276.92 153,276.92 153,276.92 153,276.92 153,276.92 153,276.92 153,276.92 153,276.92 1,532,769.23
Depreciations (Machinery/Containers) 110,256.41 110,256.41 110,256.41 110,256.41 110,256.41 110,256.41 110,256.41 110,256.41 110,256.41 110,256.41 1,102,564.10
Depreciations (Company Vehicles) 37,820.51 37,820.51 37,820.51 37,820.51 37,820.51 37,820.51 37,820.51 37,820.51 37,820.51 37,820.51 378,205.13
TOTAL DEPRECIATION 307,764.10 307,764.10 307,764.10 307,764.10 307,764.10 307,764.10 307,764.10 307,764.10 307,764.10 307,764.10 3,077,641.03
Loan Repayment 0.00 0.00 0.00 0.00 0.00 0.00 0.00 0.00 0.00 0.00 0.00
TOTAL EXPENDITURE 2,216,138.55 2,203,804.66 2,272,257.12 2,344,132.20 2,419,601.04 2,498,843.32 2,582,047.72 2,669,412.33 2,761,145.18 2,857,464.67 27,902,487.81
PROFITS BEFORE TAX 23,533,553.76 54,255,164.57 59,394,275.96 64,790,342.91 64,714,874.07 64,635,631.79 64,552,427.40 64,465,062.78 64,373,329.94 64,277,010.45 588,991,673.64
EBITDA (Earning Before Interest,Taxes,Depreciation and Amortization) 23,841,317.86 54,562,928.68 59,702,040.06 65,098,107.01 65,022,638.18 64,943,395.89 64,860,191.50 64,772,826.89 64,681,094.04 64,584,774.55 592,069,314.66
PROJECTED INCOME STATEMENT FOR YEAR 1 TO YEAR 10 (Profit & Loss)
Page 1 of 1
Thank You
SAN SAN MEWAH SDN BHD

More Related Content

What's hot

Company Profile (Occidental Petroleum Corporation)
Company Profile (Occidental Petroleum Corporation)Company Profile (Occidental Petroleum Corporation)
Company Profile (Occidental Petroleum Corporation)Muhammad Hasnain
 
New base 1031 special 18 may 2017 energy news
New base 1031 special 18 may 2017 energy newsNew base 1031 special 18 may 2017 energy news
New base 1031 special 18 may 2017 energy newsKhaled Al Awadi
 
Pipeline Oil & Gas Magazine - October 2014 Featuring Thorne & Derrick
Pipeline Oil & Gas Magazine - October 2014 Featuring Thorne & DerrickPipeline Oil & Gas Magazine - October 2014 Featuring Thorne & Derrick
Pipeline Oil & Gas Magazine - October 2014 Featuring Thorne & DerrickThorne & Derrick International
 
New base 707 special 14 october 2015
New base 707 special  14 october 2015New base 707 special  14 october 2015
New base 707 special 14 october 2015Khaled Al Awadi
 
New base 14 november 2017 energy news issue 1100 by khaled al awadi
New base 14 november 2017 energy news issue   1100  by khaled al awadiNew base 14 november 2017 energy news issue   1100  by khaled al awadi
New base 14 november 2017 energy news issue 1100 by khaled al awadiKhaled Al Awadi
 
New base 11 september 2017 energy news issue 1070 by khaled al awadi
New base 11 september 2017 energy news issue   1070  by khaled al awadiNew base 11 september 2017 energy news issue   1070  by khaled al awadi
New base 11 september 2017 energy news issue 1070 by khaled al awadiKhaled Al Awadi
 
New base energy news issue 946 dated 10 november 2016
New base energy news issue  946 dated 10 november 2016New base energy news issue  946 dated 10 november 2016
New base energy news issue 946 dated 10 november 2016Khaled Al Awadi
 
New base energy news issue 887 dated 18 july 2016
New base energy news issue  887 dated 18 july 2016New base energy news issue  887 dated 18 july 2016
New base energy news issue 887 dated 18 july 2016Khaled Al Awadi
 
New base 776 special 31 january 2016
New base 776 special 31 january 2016New base 776 special 31 january 2016
New base 776 special 31 january 2016Khaled Al Awadi
 
New base 731 special 18 november 2015
New base 731 special  18 november 2015New base 731 special  18 november 2015
New base 731 special 18 november 2015Khaled Al Awadi
 
Industrial Orientaion Report_Daxit Akbari
Industrial Orientaion Report_Daxit AkbariIndustrial Orientaion Report_Daxit Akbari
Industrial Orientaion Report_Daxit AkbariDAXIT AKBARI 🇮🇳
 
33536213 gail-project-report-by-manish-soni
33536213 gail-project-report-by-manish-soni33536213 gail-project-report-by-manish-soni
33536213 gail-project-report-by-manish-soniAman Kumar
 
New base 22 septempber 2021 energy news issue 1457 by khaled al awadi
New base  22 septempber 2021 energy news issue   1457  by khaled al awadiNew base  22 septempber 2021 energy news issue   1457  by khaled al awadi
New base 22 septempber 2021 energy news issue 1457 by khaled al awadiKhaled Al Awadi
 
New base january 10 2022 energy news issue 1478 by khaled al awadi
New base january 10 2022  energy news issue   1478  by khaled al awadiNew base january 10 2022  energy news issue   1478  by khaled al awadi
New base january 10 2022 energy news issue 1478 by khaled al awadiKhaled Al Awadi
 
New base 10 february 2020 energy news issue 1317 by khaled al awadi
New base 10 february 2020 energy news issue   1317  by khaled al awadiNew base 10 february 2020 energy news issue   1317  by khaled al awadi
New base 10 february 2020 energy news issue 1317 by khaled al awadiKhaled Al Awadi
 
New base january 13 2022 energy news issue - 1479 by khaled al awadi
New base january 13   2022  energy news issue - 1479  by khaled al awadiNew base january 13   2022  energy news issue - 1479  by khaled al awadi
New base january 13 2022 energy news issue - 1479 by khaled al awadiKhaled Al Awadi
 
New base special 26 august 2014
New base special  26 august 2014New base special  26 august 2014
New base special 26 august 2014Khaled Al Awadi
 
New base 706 special 13 october 2015 r
New base 706 special  13 october 2015 rNew base 706 special  13 october 2015 r
New base 706 special 13 october 2015 rKhaled Al Awadi
 
New base 588 special 22 April 2015
New base 588 special  22 April  2015New base 588 special  22 April  2015
New base 588 special 22 April 2015Khaled Al Awadi
 

What's hot (20)

Company Profile (Occidental Petroleum Corporation)
Company Profile (Occidental Petroleum Corporation)Company Profile (Occidental Petroleum Corporation)
Company Profile (Occidental Petroleum Corporation)
 
New base 1031 special 18 may 2017 energy news
New base 1031 special 18 may 2017 energy newsNew base 1031 special 18 may 2017 energy news
New base 1031 special 18 may 2017 energy news
 
Pipeline Oil & Gas Magazine - October 2014 Featuring Thorne & Derrick
Pipeline Oil & Gas Magazine - October 2014 Featuring Thorne & DerrickPipeline Oil & Gas Magazine - October 2014 Featuring Thorne & Derrick
Pipeline Oil & Gas Magazine - October 2014 Featuring Thorne & Derrick
 
New base 707 special 14 october 2015
New base 707 special  14 october 2015New base 707 special  14 october 2015
New base 707 special 14 october 2015
 
New base 14 november 2017 energy news issue 1100 by khaled al awadi
New base 14 november 2017 energy news issue   1100  by khaled al awadiNew base 14 november 2017 energy news issue   1100  by khaled al awadi
New base 14 november 2017 energy news issue 1100 by khaled al awadi
 
New base 11 september 2017 energy news issue 1070 by khaled al awadi
New base 11 september 2017 energy news issue   1070  by khaled al awadiNew base 11 september 2017 energy news issue   1070  by khaled al awadi
New base 11 september 2017 energy news issue 1070 by khaled al awadi
 
New base energy news issue 946 dated 10 november 2016
New base energy news issue  946 dated 10 november 2016New base energy news issue  946 dated 10 november 2016
New base energy news issue 946 dated 10 november 2016
 
New base energy news issue 887 dated 18 july 2016
New base energy news issue  887 dated 18 july 2016New base energy news issue  887 dated 18 july 2016
New base energy news issue 887 dated 18 july 2016
 
New base 776 special 31 january 2016
New base 776 special 31 january 2016New base 776 special 31 january 2016
New base 776 special 31 january 2016
 
New base 731 special 18 november 2015
New base 731 special  18 november 2015New base 731 special  18 november 2015
New base 731 special 18 november 2015
 
Industrial Orientaion Report_Daxit Akbari
Industrial Orientaion Report_Daxit AkbariIndustrial Orientaion Report_Daxit Akbari
Industrial Orientaion Report_Daxit Akbari
 
33536213 gail-project-report-by-manish-soni
33536213 gail-project-report-by-manish-soni33536213 gail-project-report-by-manish-soni
33536213 gail-project-report-by-manish-soni
 
New base 22 septempber 2021 energy news issue 1457 by khaled al awadi
New base  22 septempber 2021 energy news issue   1457  by khaled al awadiNew base  22 septempber 2021 energy news issue   1457  by khaled al awadi
New base 22 septempber 2021 energy news issue 1457 by khaled al awadi
 
New base january 10 2022 energy news issue 1478 by khaled al awadi
New base january 10 2022  energy news issue   1478  by khaled al awadiNew base january 10 2022  energy news issue   1478  by khaled al awadi
New base january 10 2022 energy news issue 1478 by khaled al awadi
 
New base 10 february 2020 energy news issue 1317 by khaled al awadi
New base 10 february 2020 energy news issue   1317  by khaled al awadiNew base 10 february 2020 energy news issue   1317  by khaled al awadi
New base 10 february 2020 energy news issue 1317 by khaled al awadi
 
New base january 13 2022 energy news issue - 1479 by khaled al awadi
New base january 13   2022  energy news issue - 1479  by khaled al awadiNew base january 13   2022  energy news issue - 1479  by khaled al awadi
New base january 13 2022 energy news issue - 1479 by khaled al awadi
 
New base special 26 august 2014
New base special  26 august 2014New base special  26 august 2014
New base special 26 august 2014
 
New base 706 special 13 october 2015 r
New base 706 special  13 october 2015 rNew base 706 special  13 october 2015 r
New base 706 special 13 october 2015 r
 
New base 588 special 22 April 2015
New base 588 special  22 April  2015New base 588 special  22 April  2015
New base 588 special 22 April 2015
 
Kingdom Downstream Optimization and Technology
Kingdom Downstream Optimization and TechnologyKingdom Downstream Optimization and Technology
Kingdom Downstream Optimization and Technology
 

Similar to Catalyst profile 2018

Webinar: Carbon capture through innovative comercial structuring in the canad...
Webinar: Carbon capture through innovative comercial structuring in the canad...Webinar: Carbon capture through innovative comercial structuring in the canad...
Webinar: Carbon capture through innovative comercial structuring in the canad...Global CCS Institute
 
Reliance Refining Building Worlds Larges Coke Gasification Project
Reliance Refining Building Worlds Larges Coke Gasification ProjectReliance Refining Building Worlds Larges Coke Gasification Project
Reliance Refining Building Worlds Larges Coke Gasification ProjectTodd Pencarinha
 
Project report
Project reportProject report
Project reportDolly Roy
 
A1 Company Profile Secure Supplies 1.pdf
A1 Company Profile Secure Supplies 1.pdfA1 Company Profile Secure Supplies 1.pdf
A1 Company Profile Secure Supplies 1.pdfDaniel Donatelli
 
Investor-Presentation_September.pdf
Investor-Presentation_September.pdfInvestor-Presentation_September.pdf
Investor-Presentation_September.pdfAsadNoman14
 
Ai operating results q2 2013
Ai operating results q2 2013Ai operating results q2 2013
Ai operating results q2 2013Pk Daily Watch
 
Milk magic foods co..
Milk magic foods co..Milk magic foods co..
Milk magic foods co..Jay Chavda
 
Milk magic foods co..
Milk magic foods co..Milk magic foods co..
Milk magic foods co..Jay Chavda
 
Scrap Tyres to oil production - A project profile by SMB Environmental Projec...
Scrap Tyres to oil production - A project profile by SMB Environmental Projec...Scrap Tyres to oil production - A project profile by SMB Environmental Projec...
Scrap Tyres to oil production - A project profile by SMB Environmental Projec...burhaan taskeen azad
 
Gas Plant, Dryer and Generator by Atmos Power Pvt Ltd, Ahmedabad
Gas Plant, Dryer and Generator by Atmos Power Pvt Ltd, AhmedabadGas Plant, Dryer and Generator by Atmos Power Pvt Ltd, Ahmedabad
Gas Plant, Dryer and Generator by Atmos Power Pvt Ltd, AhmedabadIndiaMART InterMESH Limited
 
Sswi april may-2021_lowres
Sswi april may-2021_lowresSswi april may-2021_lowres
Sswi april may-2021_lowresPrem Baboo
 
Generic slides: AMEC in the Middle East, Africa and CIS
Generic slides: AMEC in the Middle East, Africa and CISGeneric slides: AMEC in the Middle East, Africa and CIS
Generic slides: AMEC in the Middle East, Africa and CISZhenya85
 
Making the CNG Virtual Pipeline a Reality for Transportation Natural Gas (TNG)
Making the CNG Virtual Pipeline a Reality for Transportation Natural Gas (TNG)Making the CNG Virtual Pipeline a Reality for Transportation Natural Gas (TNG)
Making the CNG Virtual Pipeline a Reality for Transportation Natural Gas (TNG)Jolynn Kennedy, CIMS-GB
 
15A3HP623DDINESHREDDY-FINALPROJECT REPORT--1-
15A3HP623DDINESHREDDY-FINALPROJECT REPORT--1-15A3HP623DDINESHREDDY-FINALPROJECT REPORT--1-
15A3HP623DDINESHREDDY-FINALPROJECT REPORT--1-D Dinesh Kumar Reddy
 
NewBase 609 special 21 May 2015
NewBase 609 special 21 May 2015NewBase 609 special 21 May 2015
NewBase 609 special 21 May 2015Khaled Al Awadi
 

Similar to Catalyst profile 2018 (20)

Webinar: Carbon capture through innovative comercial structuring in the canad...
Webinar: Carbon capture through innovative comercial structuring in the canad...Webinar: Carbon capture through innovative comercial structuring in the canad...
Webinar: Carbon capture through innovative comercial structuring in the canad...
 
KNPC-CFP
KNPC-CFPKNPC-CFP
KNPC-CFP
 
Reliance Refining Building Worlds Larges Coke Gasification Project
Reliance Refining Building Worlds Larges Coke Gasification ProjectReliance Refining Building Worlds Larges Coke Gasification Project
Reliance Refining Building Worlds Larges Coke Gasification Project
 
Project report
Project reportProject report
Project report
 
A1 Company Profile Secure Supplies 1.pdf
A1 Company Profile Secure Supplies 1.pdfA1 Company Profile Secure Supplies 1.pdf
A1 Company Profile Secure Supplies 1.pdf
 
Investor-Presentation_September.pdf
Investor-Presentation_September.pdfInvestor-Presentation_September.pdf
Investor-Presentation_September.pdf
 
Ai operating results q2 2013
Ai operating results q2 2013Ai operating results q2 2013
Ai operating results q2 2013
 
Milk magic foods co..
Milk magic foods co..Milk magic foods co..
Milk magic foods co..
 
Milk magic foods co..
Milk magic foods co..Milk magic foods co..
Milk magic foods co..
 
Scrap Tyres to oil production - A project profile by SMB Environmental Projec...
Scrap Tyres to oil production - A project profile by SMB Environmental Projec...Scrap Tyres to oil production - A project profile by SMB Environmental Projec...
Scrap Tyres to oil production - A project profile by SMB Environmental Projec...
 
Gas Plant, Dryer and Generator by Atmos Power Pvt Ltd, Ahmedabad
Gas Plant, Dryer and Generator by Atmos Power Pvt Ltd, AhmedabadGas Plant, Dryer and Generator by Atmos Power Pvt Ltd, Ahmedabad
Gas Plant, Dryer and Generator by Atmos Power Pvt Ltd, Ahmedabad
 
Clean Energy Ccompression Corporate Overview 2016
Clean Energy Ccompression Corporate Overview 2016Clean Energy Ccompression Corporate Overview 2016
Clean Energy Ccompression Corporate Overview 2016
 
Sswi april may-2021_lowres
Sswi april may-2021_lowresSswi april may-2021_lowres
Sswi april may-2021_lowres
 
Generic slides: AMEC in the Middle East, Africa and CIS
Generic slides: AMEC in the Middle East, Africa and CISGeneric slides: AMEC in the Middle East, Africa and CIS
Generic slides: AMEC in the Middle East, Africa and CIS
 
Making the CNG Virtual Pipeline a Reality for Transportation Natural Gas (TNG)
Making the CNG Virtual Pipeline a Reality for Transportation Natural Gas (TNG)Making the CNG Virtual Pipeline a Reality for Transportation Natural Gas (TNG)
Making the CNG Virtual Pipeline a Reality for Transportation Natural Gas (TNG)
 
15A3HP623DDINESHREDDY-FINALPROJECT REPORT--1-
15A3HP623DDINESHREDDY-FINALPROJECT REPORT--1-15A3HP623DDINESHREDDY-FINALPROJECT REPORT--1-
15A3HP623DDINESHREDDY-FINALPROJECT REPORT--1-
 
NewBase 609 special 21 May 2015
NewBase 609 special 21 May 2015NewBase 609 special 21 May 2015
NewBase 609 special 21 May 2015
 
Eng imw reference package
Eng   imw reference packageEng   imw reference package
Eng imw reference package
 
Eng imw reference package
Eng   imw reference packageEng   imw reference package
Eng imw reference package
 
Contact Solar
Contact SolarContact Solar
Contact Solar
 

Catalyst profile 2018

  • 1. San San Mewah Sdn Bhd Proposal for the Production of 5-in-1 Catalyst (Magna CA-5) for Power Plant 1Confidential
  • 2. SAN SAN MEWAH SDN BHD Confidential Agreement The undersigned reader acknowledges that the information provided in this proposal is confidential; therefore, the reader agrees not to disclose it without the express written permission of SAN SAN MEWAH SDN BHD. It is acknowledged by the reader that information to be furnished in this proposal is in all respects confidential in nature, other than information that is in the public domain through other means, and that any disclosure or use of this confidential information by the reader may cause serious harm or damage to SAN SAN MEWAH SDN BHD. Upon request, this document is to be immediately returned to SAN SAN MEWAH SDN BHD. Signature Name (printed) Date This is a business proposal. It does not imply offering of securities. Readers are encouraged to make their judgments as to the veracity of the information provided herein on their own before accepting the plan on its own merits. 2Confidential
  • 3. More recently, global warming has become unmistakably important with widespread melting of ice, noticeable climate changes, and rising sea levels. This is now recognized by nearly everyone as caused by greenhouse gases, mainly carbon dioxide, produced by burning fossil fuels such as petroleum, coal, and natural gas Massachusetts Institute of Technology (MIT) – newsletter 2007 China is the world's second largest oil consumer behind the United States, and the largest global energy consumer. The country was a net oil exporter until the early 1990s and became the world's second largest net importer of oil in 2009. China's oil consumption growth accounted for half of the world's oil consumption growth in 2011. Natural gas usage in China has also increased rapidly in recent years, and China has looked to raise natural gas imports via pipeline and liquefied natural gas (LNG). China is also the world's largest top coal producer and consumer and accounted for about half of the global coal consumption, an important factor in world energy-related CO2 emissions. Observation by United States Energy Information Administration The electricity tariff will be increased by an average of about 14.89% for Peninsular Malaysia, and by about 17% for Sabah and Labuan from next year, said Energy, Green Technology and Water Minister Datuk Dr Maximus Ongkili. The energy problem has caused the Malaysian government to look into raising electricity tariffs in 2014, as viewed in The Star on 2nd of December 2013 3Confidential
  • 4.  To solve environmental issues, China has invested billions into research and development (R & D) with scientists and parties from various parts of the world and developed a 5 in 1 Catalyst (Magna CA-5) that can extract an additional 30 – 40% more in terms of energy output from the current raw materials used to produce energy sources. One of the parties involved in this international project is SAN SAN MEWAH SDN BHD.  Magna CA-5 is a coal additive, specially designed for high production boilers such as coal fired power plants and has been developed to improve:  the combustion process  coal pollution reduction  protect boilers & extend life time  cleaning boiler properties  saving coal and energy  SAN SAN MEWAH strive to be a world leader, the main producer and the main exporter of 5 in 1 Catalyst (Magna CA-5). 4Confidential
  • 5. SAN SAN MEWAH SDN BHD COMPANY PROFILE 5Confidential
  • 6. SAN SAN MEWAH SDN BHD SAN SAN MEWAH SDN BHD incorporated in 21st December 2011, is a public limited company fully owned by Ben Low Item Description Company Name: San San Mewah Sdn Bhd Company Reg. No: 972434-V Paid Up Capital: RM 500,000 Company Address: A-2-2A, Blok A, Jalan GC 1, Glomac Cyberjaya, 63200 Cyberjaya, Selangor Malaysia Telephone: +603-8322 6110 Fax: +603-8064 2190 Email: masbpuchong@yahoo.com benlow65@yahoo.com 6Confidential
  • 7. Organization Chart 7Confidential Shareholder Board CEO CMO HR Manager Manufacturing Manager Manufacturing Manager Manufacturing Manager Manufacturing Manager CTO R&D Manager Technical & Customer Service Manager CBD Sales Manager Public Relation Manager CFO Accountant Legal Department
  • 8. SAN SAN MEWAH SDN BHD Manufacturing Plan 8Confidential
  • 9. Manufacturing Plan Description Size, Capacity and Investment per plant Plant Land Size 3 acre = 130680 sq. ft. Production Line 5 lines, with 2 machines per line Total Machine 10 machines Production Capacity 5000 Metric Tons per Month. Investment USD 5.0 million Capital Expenditure ≈ USD 3.7 million Operating Expenditure ≈ USD 2.3 million annually 9Confidential Note: Machine output capacity: 500 Metric Tons per Month
  • 10. Summary of Manufacturing Cost 10 Confidential Electricity Power Consumption(PC). • PC per machine = Wood Pellet Machine PC + Torrefying PC ≈ 28 KWh • Assumption each machine runs 20 hours per day / 20 days Total PC per machine ≈ 28 x 20 hrs x 20 days ≈ 11,200 KWh Total PC per production line ≈ 11,200 KWh x 2 machines ≈ 22,400 KWh Machine Cost per line: ≈ USD 100K x 2 machines ≈ USD 200,000 Total Land Size: ≈ 3 acres (0.125 + 2 + 0.5 == 2.625 acres) Building Size: ≈ Production line + office + warehouse + substation + logistic ≈ 2 acres ≈ 87120 sqft Power Consumption (PC) per month per line: ≈ 22,400 KWh NOTES: 1. Calculation based on 1 unit production line Land Size. • Manufacturing Size for 1 unit production line Note: 1 unit production line has 2 machines ≈ 20m x 25m ≈ 500 sqm ≈ 5,382 sqft ≈ 0.125 acre • Logistics + Warehouse + Office + Power Substation ≈ 2 acres • Raw Material Compound ≈ 0.5 acres Land Size and Utility Calculation Approximate Cost (Summary)
  • 11. Machine 11Confidential Maximum Capacity: 500 Metric Tons per Month Operating Time: 5 Days per week Power Rating: 28 KWh
  • 12. SAN SAN MEWAH SDN BHD Product Information Catalyst 5-in-1 (Magna CA-5) 12Confidential
  • 13. What is Catalyst 13Confidential Catalyst the Coal Additive Dry Powder The Catalyst is a coal additive ! improving combustion process reducing pollution protect boilers & extend life time cleaning properties Save coal and energy Definition: a catalyst is any substance that works to accelerate a chemical reaction.
  • 14. What is Catalyst 14Confidential Magna CA-5 is a powder, packaged in 25 kg bags
  • 15. What is Catalyst 15Confidential 2 kg Magna CA-5 is an additive for each ton of coal
  • 16. What is Catalyst 16Confidential 2 kg Magna CA-5 for each ton of coal Magna CA-5 present no safety issues for personnel regarding fire, chemical spill, containment or clean up
  • 17. What is Catalyst 17Confidential Magna CA-5 Chemical Composition •Potassium Permanganate •Sodium Nitrate •Sodium Carbonate •Light Calcium Carbonate •Ferric Trioxide •Sodium Chloride •Zinc Oxide
  • 19. What is Catalyst 19Confidential The 5 Basic Catalyst Function for Coal Burning Boiler Coal Pollution Reduction CATALYST ADDITIVE Clean Burning Process Coal Fuel Saving Emission Reduction Sulphur Reduction Energy Saving
  • 20. Catalyst Function 20Confidential Automatic cleaning of the boiler with removal of “birds nest”
  • 22. Catalyst Function 22Confidential The Catalyst prevents boiler from rusting Before After
  • 23. Catalyst Function 23Confidential Chain effect: coal saving and reduces electrical consumption, increasing of steam production!
  • 25. “5 in 1 Catalyst” In The News 25Confidential
  • 26. Potential Market Power plant Aluminum plant Papermaking industry Printing plant Sugar refinery Styrofoam factory Cement plant Plastics factory Glass factory Emulsion factory Brewery Ceramic factory Fertilizer plant Feed factory Chemical plant Die Casting factory Steel manufacturing industry Wood pellet fuel plant Textile industry Pharmaceutical factory Food products factory Tire factory Heating enterprise Electrical appliances factory Clothing factory Foam rubber production factory Rubber production factory Textile dye industry Steel tube manufacturing industry Automotive manufacturing industry Copper manufacturing industry Cigarette factory 26Confidential
  • 27. SAN SAN MEWAH SDN BHD Catalyst Magna CA-5 Benefits & Advantages 27Confidential
  • 28. Magna CA-5 advantages: Example of Trial Burning 28Confidential Combustion chamber without catalyst is red and loose Combustion Chamber with catalyst is roaring with strong white light
  • 29. Magna CA-5 advantages: Example of Trial Burning 29Confidential Magna CA-5 improves the combustion and increase the boiler temperature without with
  • 30. Magna CA-5 advantages: Example of Trial Burning 30Confidential Magna CA-5 improves the combustion and increase the boiler temperature
  • 31. Magna CA-5 advantages: Example of Trial Burning 31Confidential B U R N E R S Mill COAL Magna CA-5 Optimization of Boiler Operation Automatically  NOx & SO2 emission control  Ash Quality control  Flame Safety Enhancement Magna CA-5 Magna CA-5 improves the combustion and increase the boiler temperature.
  • 32. Magna CA-5 advantages: Example of Trial Burning 32Confidential Magna CA-5 remove boiler incrustation and reduce “birds nests”
  • 33. Magna CA-5 advantages: Example of Trial Burning 33Confidential Magna CA-5 remove boiler incrustation and reduce “birds nests” Clean boiler, dissolved coke can be taken out by an iron bar. Removal of coke on fire grate from inspection opening.
  • 34. Magna CA-5 advantages: Catalyst Direct Benefit 34Confidential Magna CA-5 reduce pollution and production of harmful gases. Reduce up to 30% Nitrogen Oxide NOx Reduce up to 30% Sulphur Dioxide SO2 Reduce up to 30% Carbon Monoxide CO Reduce up to 20% ash content and particles
  • 35. Magna CA-5 advantages: Catalyst Direct Benefit 35Confidential Before 1st Day 2nd Day Magna CA-5 combustion improvement turns “black” smoke into “white”.
  • 36. Magna CA-5 advantages: Catalyst Direct Benefit 36Confidential Magna CA-5 helps to reduce the pollutant in the flue gas ESP IDF Auxiliaries Electrical Consumption Saving 0.5MW to 1MW STACK FGD Optimize ESP Charge Optimize FGD (induced draft fan) Reduce Elec. Consumption Improve the SO2 emission SO2
  • 37. Magna CA-5 advantages: Catalyst Direct Benefit 37Confidential Tubes with ash, and clinker build up Tubes coking Magna CA-5 clean boiler walls and prevent from corrosion
  • 38. Magna CA-5 advantages: Catalyst Direct Benefit 38Confidential Clean Boiler & Optimized Combustion - reduce maintenance Magna CA-5 will provide 3-5 days saving for each scheduled outage Production Saving up To 3-5M RM Boiler 500-700MW
  • 39. Magna CA-5 advantages: Catalyst Direct Benefit 39Confidential Magna CA-5 save coal and energy saving The improved heat transfer save coal 8% to 20% and reduce the electricity consumption of forced fan (FOF) and induced draft fan (IDF) up to 20%.
  • 40. Magna CA-5 advantages: Summary Direct Benefits  Save coal and electricity, increase steam production and reduce cost.  Prevent pollution and reduce production of harmful gases.  Clean boiler automatically(remove coke, namely, birds' nest)  Prevent boiler from rusting – extend lifetime Indirect Benefits  Save expenses for boiler cleaning.  Reduce losses of shutdown and stop production caused by cleaning of coke.  Extend boiler life.  Save electricity bill of forced draft fan and induced-draft fan.  Reduce carriage expenses of coal.  Save environmental expenses of pollution prevention.  Transfer heat perfectly, increase steam production, increase industrial efficiency and reduce cost.  Reduce reconstruction, investment and subsequent expenses of environmental technical equipments greatly. 40Confidential
  • 41. SAN SAN MEWAH SDN BHD Magna CA-5 Application 41Confidential
  • 43. Magna CA-5 Application 43Confidential 1. Spray a few of catalysts upon fire bed to clean boiler before kindling. 2. Spray catalysts uniformly into coal and add two kilograms of catalysts into one ton of coal. 3. Both fine coal and lump coal can be used. Fine coal has the best effect.
  • 46. Magna CA-5 Application 46Confidential Water tube boiler Coal pulveriser & drying Air Coal Ash Electric energy Turbine Pump Desulpherisation Stack Condenser Generator NOX removalDedusting Charging area
  • 47. Magna CA-5 Application 47Confidential Charging area Charging area Coal Dryer and Mills
  • 48. SAN SAN MEWAH SDN BHD 48Confidential Lab Test Report
  • 60. SAN SAN MEWAH SDN BHD Catalyst Customer in Mongolia 60Confidential
  • 64. 64 Catalyst Customer in Mongolia .. Confidential
  • 65. 65 Catalyst Customer in Mongolia .. Confidential
  • 66. 66 Catalyst Customer in Mongolia .. Confidential
  • 67. 67 Catalyst Customer in Mongolia .. Confidential
  • 68. SAN SAN MEWAH SDN BHD Catalyst Customer in China 68Confidential
  • 70. Huadian Zhangqiu Business in China 70Confidential
  • 71. Some of Huadian Zhangqiu’s Power Plant 71Confidential Shangdong East Shangdong West Shangxi
  • 72. Catalyst usage in power plant 72Confidential 投 剂 口 Catalyst input point in one of the plant
  • 73. SAN SAN MEWAH SDN BHD Catalyst Industry in Malaysia 73Confidential
  • 74. Kapar Power Station situated in Klang, Selangor 74Confidential Coal Consumption: Daily 11,000 tons Yearly 3,3 million tons Yearly Catalyst 6,600 tons
  • 75. Manjung Power Station situated in Lumut, Perak 75Confidential Coal Consumption: Daily 15,000 tons Yearly 5,0 million tons Yearly Catalyst 10,000 tons
  • 76. Tanjung Bin Power Station in Pontian, Johor 76Confidential Coal Consumption: Daily 15,000 tons Yearly 5,0 million tons Yearly Catalyst 10,000 tons
  • 77. Tanjung Bin Power Station in Pontian, Johor 77Confidential Coal Consumption: Daily 10,000 tons Yearly 3,2 million tons Yearly Catalyst 6,400 tons
  • 78. Cement Plants in Malaysia 78Confidential 1.Lafarge Malayan Cement in Ipoh, Perak 2.Lafarge Malayan Cement in Langkawi 3.Lafarge Malayan Cement in Rawang 4.Holcim (Malaysia) Sdn. Bhd. In Pasir Gudang 5.YTL Cement Berhad (HQ) in Kuala Lumpur 6.Gopeng Berhad in Perak 7.Pahang Cement Sdn Bhd in Pahang 8.CIMA Cement Industries of Malaysia Sdn Bhd in Perlis 9.Negeri Sembilan Cement Industry Sdn Bhd N. Sembilan
  • 79. Steel Industries in Malaysia 79Confidential Confidential
  • 80. Oil & Gas Industries in Malaysia 80Confidential
  • 81. SAN SAN MEWAH SDN BHD Catalyst Production Cost & Sales Price 81Confidential
  • 82. 82Confidential Cost of Sales and Profits For Production Cost, Sales and Profits – Refer to Appendix A
  • 83. Contact Person 83Confidential Item Description Name Ben Low Kam Woe IC No 650213-10-5055 Address (H) No 9, Jalan Selampit 27, Taman Klang Jaya, 41200 Klang, Selangor DE Address (O) A-2-2A, Blok A, Jalan GC 1, Glomac Cyberjaya, 63200 Cyberjaya, Selangor Malaysia. Email masbpuchong@yahoo.com benlow65@yahoo.com Tel (O): +603-8322 6110 Fax: +603-8064 2190 H/P: +6017-728 8399
  • 84. Appendix A Cashflow & PnL SAN SAN MEWAH SDN BHD
  • 85. Capital Expenditure SAN SAN MEWAH SDN BHD Capital Expenses Descriptions Qty Price Total Qty Price Total Qty Price Total Qty Price Total Qty Price Total Office Equipments Office Equipments (Computers, Printers, etc) 1 64,102.56 64,102.56 0 0 0 0 0 0 0 0 0 0 0 0 Total 64,102.56 Depreciations (10%/Year) 6,410.26 6,410.26 6,410.26 6,410.26 6,410.26 Total Depreciations (Office Equipments) 6,410.26 6,410.26 6,410.26 6,410.26 6,410.26 Land/Office/factory Building Land 1 696,923.08 696,923.08 0 0.00 0.00 0 0.00 0.00 0 0 0 0 0 0 Office Renovations 0 256,410.26 0.00 0 0 0 0 0 0 0 0 0 0 0 0 Building Construction (M&E) 1 1,463,076.92 1,463,076.92 0 0 0 0 0 0 0 0 0 0 0 0 Total 2,160,000.00 0.00 0.00 Depreciations (Land) (1%/Year) 6,969.23 6,969.23 6,969.23 6,969.23 6,969.23 Depreciations (renovations) 0.00 0.00 0.00 0.00 0.00 Depreciations (Building) (10%/Year) 146,307.69 146,307.69 146,307.69 146,307.69 146,307.69 Total Depreciations (Land/Office/factory Building) 153,276.92 153,276.92 153,276.92 153,276.92 153,276.92 Machinery/Containers Machine 10 100,000.00 1,000,000.00 0 0 0 0 0 0 0 0 0 0 0 0 Specialised containers for catalysts 20 5,128.21 102,564.10 Total 1,102,564.10 0 0 0 0 0 0 0 0 0 0 0 0 Depreciations (10%/Year) 110256.4103 110256.41 110256.41 110256.41 110256.41 Total Depreciations (Machinery) 110256.4103 110256.41 110256.41 110256.41 110256.41 Company Vehicles 10 Ton Trucks 5 64,102.56 320,512.82 0 0 0 0 0 0 0 0 0 0 0 0 Forklifts 5 11,538.46 57,692.31 0 0 0 0 0 0 0 0 0 0 0 0 Total 378,205.13 Depreciations (10%/Year) 37820.51282 37820.5128 37820.5128 37820.5128 37820.5128 Total Depreciations (Vehicles) 37820.51282 37820.5128 37820.5128 37820.5128 37820.5128 Grand Total 3,704,871.79 0.00 0.00 0.00 0.00 Y1 Y2 Y3 Y4 Y5 Page 1 of 2
  • 86. Capital Expenditure SAN SAN MEWAH SDN BHD Capital Expenses Descriptions Office Equipments Office Equipments (Computers, Printers, etc) Total Depreciations (10%/Year) Total Depreciations (Office Equipments) Land/Office/factory Building Land Office Renovations Building Construction (M&E) Total Depreciations (Land) (1%/Year) Depreciations (renovations) Depreciations (Building) (10%/Year) Total Depreciations (Land/Office/factory Building) Machinery/Containers Machine Specialised containers for catalysts Total Depreciations (10%/Year) Total Depreciations (Machinery) Company Vehicles 10 Ton Trucks Forklifts Total Depreciations (10%/Year) Total Depreciations (Vehicles) Grand Total Qty Price Total Qty Price Total Qty Price Total Qty Price Total Qty Price Total 0 151,515.15 0.00 NA NA NA NA NA NA NA NA NA NA NA NA 0.00 6,410.26 6,410.26 6,410.26 6,410.26 6,410.26 6,410.26 6,410.26 6,410.26 6,410.26 6,410.26 0 0 0 0 0 0 0 0 0 0 0 0 0 0 0 0 151,515.15 0.00 0 0 0 0 0 0 0 0 0 0 0 0 0 0 0 0 0 0 0 0 0 0 0 0 0 0 0 6,969.23 6,969.23 6,969.23 6,969.23 6,969.23 0.00 0.00 0.00 0.00 0.00 146,307.69 146,307.69 146,307.69 146,307.69 146,307.69 153,276.92 153,276.92 153,276.92 153,276.92 153,276.92 0 909,090.91 0.00 0 0 0 0 0 0 0 0 0 0 0 0 0 6,060.61 0.00 0.00 0 0 0 0 0 0 0 0 0 0 0 0 110256.41 110256.41 110256.41 110256.41 110256.41 110256.41 110256.41 110256.41 110256.41 110256.41 0 75,757.58 0.00 0 0 0 0 0 0 0 0 0 0 0 0 0 13,636.36 0.00 0 0 0 0 0 0 0 0 0 0 0 0 0.00 37820.5128 37820.5128 37820.5128 37820.5128 37820.5128 37820.5128 37820.5128 37820.5128 37820.5128 37820.5128 0.00 0.00 0.00 0.00 0.00 Y6 Y7 Y8 Y9 Y10 Page 2 of 2
  • 87. Operating Expenditure (Monthly) SAN SAN MEWAH SDN BHD Operating Expenses (Monthly) Month 1 Month 2 Month 3 Month 4 Month 5 Month 6 Month 7 Month 8 Month 9 Month 10 Month 11 Month 12 Marketing Expenditure Promotion and Advertisement 5,128.21 5,128.21 5,128.21 5,128.21 5,128.21 5,128.21 5,128.21 5,128.21 5,128.21 5,128.21 5,128.21 5,128.21 Administrative Expenditure Salaries 43,205.13 43,205.13 43,205.13 43,205.13 43,205.13 81,666.67 81,666.67 81,666.67 81,666.67 81,666.67 81,666.67 81,666.67 EPF 5,616.67 5,616.67 5,616.67 5,616.67 5,616.67 10,616.67 10,616.67 10,616.67 10,616.67 10,616.67 10,616.67 10,616.67 SOCSO 278.12 278.12 278.12 278.12 278.12 1,337.60 1,337.60 1,337.60 1,337.60 1,337.60 1,337.60 1,337.60 PSMB 432.05 432.05 432.05 432.05 432.05 816.67 816.67 816.67 816.67 816.67 816.67 816.67 Insurance (Hospitalisation & Term Life) 0.00 0.00 0.00 0.00 0.00 57,984.62 0.00 0.00 0.00 0.00 0.00 0.00 Employee Benefits (Medical-Out patient) 107.69 107.69 107.69 107.69 107.69 517.95 517.95 517.95 517.95 517.95 517.95 517.95 Additional Employee Benefits 0.00 0.00 0.00 0.00 0.00 2,481.84 2,481.84 2,481.84 2,481.84 2,481.84 2,481.84 2,481.84 Executive Chairman and Directors Allowances 4,871.79 4,871.79 4,871.79 4,871.79 4,871.79 4,871.79 4,871.79 4,871.79 4,871.79 4,871.79 4,871.79 4,871.79 Management (Tier 1) Allowances 3,846.15 3,846.15 3,846.15 3,846.15 3,846.15 3,846.15 3,846.15 3,846.15 3,846.15 3,846.15 3,846.15 3,846.15 Marketing Allowance 256.41 256.41 256.41 256.41 256.41 256.41 256.41 256.41 256.41 256.41 256.41 256.41 Professional Services & Consultation (10% from Total Project) 500,000.00 0.00 0.00 0.00 0.00 0.00 0.00 0.00 0.00 0.00 0.00 0.00 Factory Maintainance (RM0.35/sqft) 0.00 0.00 0.00 0.00 0.00 0.00 12,196.15 12,196.15 12,196.15 12,196.15 12,196.15 12,196.15 Factory and Office Utilities 2,564.10 2,564.10 2,564.10 2,564.10 2,564.10 2,564.10 19,230.77 19,230.77 19,230.77 19,230.77 19,230.77 19,230.77 Factory and Office Supplies 846.15 846.15 846.15 846.15 846.15 846.15 2,564.10 2,564.10 2,564.10 2,564.10 2,564.10 2,564.10 Insurance Company (0.4% from Total Capex Value) 0.00 0.00 0.00 0.00 0.00 0.00 148,194.87 0.00 0.00 0.00 0.00 0.00 Workers Levy 38,461.54 0.00 0.00 0.00 0.00 0.00 0.00 0.00 0.00 0.00 0.00 0.00 Business Travel 3,846.15 3,846.15 3,846.15 3,846.15 3,846.15 3,846.15 3,846.15 3,846.15 3,846.15 3,846.15 3,846.15 3,846.15 Licensing (DoE,MITI,KDN,etc) 25,641.03 0.00 0.00 0.00 0.00 0.00 0.00 0.00 0.00 0.00 0.00 0.00 Miscellaneous 5,128.21 5,128.21 5,128.21 5,128.21 5,128.21 5,128.21 5,128.21 5,128.21 5,128.21 5,128.21 5,128.21 5,128.21 Total/Month 640,229.40 76,126.83 76,126.83 76,126.83 76,126.83 181,909.18 302,700.21 154,505.34 154,505.34 154,505.34 154,505.34 154,505.34 Page 1 of 2
  • 88. Operating Expenditure (Monthly) SAN SAN MEWAH SDN BHD Operating Expenses (Monthly) Marketing Expenditure Promotion and Advertisement Administrative Expenditure Salaries EPF SOCSO PSMB Insurance (Hospitalisation & Term Life) Employee Benefits (Medical-Out patient) Additional Employee Benefits Executive Chairman and Directors Allowances Management (Tier 1) Allowances Marketing Allowance Professional Services & Consultation (10% from Total Project) Factory Maintainance (RM0.35/sqft) Factory and Office Utilities Factory and Office Supplies Insurance Company (0.4% from Total Capex Value) Workers Levy Business Travel Licensing (DoE,MITI,KDN,etc) Miscellaneous Total/Month Month 13 Month 14 Month 15 Month 16 Month 17 Month 18 Month 19 Month 20 Month 21 Month 22 Month 23 Month 24 Total 5,128.21 5,128.21 5,128.21 5,128.21 5,128.21 5,128.21 5,128.21 5,128.21 5,128.21 5,128.21 5,128.21 5,128.21 123,076.92 85,750.00 85,750.00 85,750.00 85,750.00 85,750.00 85,750.00 85,750.00 85,750.00 85,750.00 85,750.00 85,750.00 85,750.00 1,816,692.31 11,147.50 11,147.50 11,147.50 11,147.50 11,147.50 11,147.50 11,147.50 11,147.50 11,147.50 11,147.50 11,147.50 11,147.50 236,170.00 1,337.60 1,337.60 1,337.60 1,337.60 1,337.60 1,337.60 1,337.60 1,337.60 1,337.60 1,337.60 1,337.60 1,337.60 26,805.03 857.50 857.50 857.50 857.50 857.50 857.50 857.50 857.50 857.50 857.50 857.50 857.50 18,166.92 0.00 0.00 0.00 0.00 0.00 0.00 57,984.62 0.00 0.00 0.00 0.00 0.00 115,969.23 517.95 517.95 517.95 517.95 517.95 517.95 517.95 517.95 517.95 517.95 517.95 517.95 10,379.49 2,481.84 2,481.84 2,481.84 2,481.84 2,481.84 2,481.84 2,481.84 2,481.84 2,481.84 2,481.84 2,481.84 2,481.84 47,154.91 4,871.79 4,871.79 4,871.79 4,871.79 4,871.79 4,871.79 4,871.79 4,871.79 4,871.79 4,871.79 4,871.79 4,871.79 116,923.08 3,846.15 3,846.15 3,846.15 3,846.15 3,846.15 3,846.15 3,846.15 3,846.15 3,846.15 3,846.15 3,846.15 3,846.15 92,307.69 256.41 256.41 256.41 256.41 256.41 256.41 256.41 256.41 256.41 256.41 256.41 256.41 6,153.85 0.00 0.00 0.00 0.00 0.00 0.00 0.00 0.00 0.00 0.00 0.00 0.00 500,000.00 12,196.15 12,196.15 12,196.15 12,196.15 12,196.15 12,196.15 12,196.15 12,196.15 12,196.15 12,196.15 12,196.15 12,196.15 219,530.77 19,230.77 19,230.77 19,230.77 19,230.77 19,230.77 19,230.77 19,230.77 19,230.77 19,230.77 19,230.77 19,230.77 19,230.77 361,538.46 2,564.10 2,564.10 2,564.10 2,564.10 2,564.10 2,564.10 2,564.10 2,564.10 2,564.10 2,564.10 2,564.10 2,564.10 51,230.77 0.00 0.00 0.00 0.00 0.00 0.00 0.00 0.00 0.00 0.00 0.00 0.00 148,194.87 40,384.62 0.00 0.00 0.00 0.00 0.00 0.00 0.00 0.00 0.00 0.00 0.00 78,846.15 3,846.15 3,846.15 3,846.15 3,846.15 3,846.15 3,846.15 3,846.15 3,846.15 3,846.15 3,846.15 3,846.15 3,846.15 92,307.69 25,641.03 0.00 0.00 0.00 0.00 0.00 0.00 0.00 0.00 0.00 0.00 0.00 51,282.05 5,128.21 5,128.21 5,128.21 5,128.21 5,128.21 5,128.21 5,128.21 5,128.21 5,128.21 5,128.21 5,128.21 5,128.21 123,076.92 225,185.98 159,160.34 159,160.34 159,160.34 159,160.34 159,160.34 217,144.95 159,160.34 159,160.34 159,160.34 159,160.34 159,160.34 4,235,807.12 Page 2 of 2
  • 89. Operating Expenditure (Yearly) SAN SAN MEWAH SDN BHD Operating Expenses (Yearly) Year 1 Year 2 Year 3 Year 4 Year 5 Year 6 Year 7 Year 8 Year 9 Year 10 Total Marketing Expenditure Promotion and Advertisement 72,727.27 72,727.27 72,727.27 72,727.27 72,727.27 72,727.27 72,727.27 72,727.27 72,727.27 72,727.27 727,272.73 Administrative Expenditure Salaries 787,692.31 1,029,000.00 1,080,450.00 1,134,472.50 1,191,196.13 1,250,755.93 1,313,293.73 1,378,958.41 1,447,906.33 1,520,301.65 12,134,026.99 EPF 102,400.00 133,770.00 140,458.50 147,481.43 154,855.50 162,598.27 170,728.18 179,264.59 188,227.82 197,639.21 1,577,423.51 SOCSO 10,753.79 16,051.23 16,051.23 16,051.23 16,051.23 16,051.23 16,051.23 16,051.23 16,051.23 16,051.23 155,214.87 PSMB 7,876.92 10,290.00 10,804.50 11,344.73 11,911.96 12,507.56 13,132.94 13,789.58 14,479.06 15,203.02 121,340.27 Insurance (Hospitalisation & Term Life) 57,984.62 57,984.62 57,984.62 57,984.62 57,984.62 57,984.62 57,984.62 57,984.62 57,984.62 57,984.62 579,846.15 Employee Benefits (Medical-Out patient) 4,164.10 6,215.38 6,215.38 6,215.38 6,215.38 6,215.38 6,215.38 6,215.38 6,215.38 6,215.38 60,102.56 Additional Employee Benefits 17,372.86 29,782.05 29,782.05 29,782.05 29,782.05 29,782.05 29,782.05 29,782.05 29,782.05 29,782.05 285,411.32 Executive Chairman and Directors Allowances 58,461.54 58,461.54 58,461.54 58,461.54 58,461.54 58,461.54 58,461.54 58,461.54 58,461.54 58,461.54 584,615.38 Management (Tier 1) Allowances 46,153.85 46,153.85 46,153.85 46,153.85 46,153.85 46,153.85 46,153.85 46,153.85 46,153.85 46,153.85 461,538.46 Marketing Allowance 3,076.92 3,076.92 3,076.92 3,076.92 3,076.92 3,076.92 3,076.92 3,076.92 3,076.92 3,076.92 30,769.23 Professional Services & Consultation (10% from Total Project) 500,000.00 0.00 0.00 0.00 0.00 0.00 0.00 0.00 0.00 0.00 500,000.00 Factory Maintainance (RM0.35/sqft) 73,176.92 146,353.85 146,353.85 146,353.85 146,353.85 146,353.85 146,353.85 146,353.85 146,353.85 146,353.85 1,390,361.54 Factory and Office Utilities 130,769.23 230,769.23 230,769.23 230,769.23 230,769.23 230,769.23 230,769.23 230,769.23 230,769.23 230,769.23 2,207,692.31 Factory and Office Supplies 20,461.54 30,769.23 30,769.23 30,769.23 30,769.23 30,769.23 30,769.23 30,769.23 30,769.23 30,769.23 297,384.62 Insurance Company (0.4% from Total Capex Value) 148,194.87 155,604.62 163,384.85 171,554.09 180,131.79 189,138.38 198,595.30 208,525.07 218,951.32 229,898.89 1,863,979.17 Workers Levy 38,461.54 40,384.62 42,403.85 44,524.04 46,750.24 49,087.75 51,542.14 54,119.25 56,825.21 59,666.47 483,765.10 Business Travel 46,153.85 46,153.85 46,153.85 46,153.85 46,153.85 46,153.85 46,153.85 46,153.85 46,153.85 46,153.85 461,538.46 Licensing (DoE,MITI,KDN,etc) 25,641.03 25,641.03 25,641.03 25,641.03 25,641.03 25,641.03 25,641.03 25,641.03 25,641.03 25,641.03 256,410.26 Miscellaneous 61,538.46 61,538.46 61,538.46 61,538.46 61,538.46 61,538.46 61,538.46 61,538.46 61,538.46 61,538.46 615,384.62 Total/Year 2,213,061.62 2,200,727.73 2,269,180.20 2,341,055.28 2,416,524.12 2,495,766.40 2,578,970.79 2,666,335.41 2,758,068.25 2,854,387.74 24,794,077.55 Page 1 of 1
  • 90. Revenue SAN SAN MEWAH SDN BHD Revenue Calculation CATALYSTS PRODUCTIONS Year 1 Year 2 Year 3 Year 4 Year 5 Year 6 Year 7 Year 8 Year 9 Year 10 Items Sales 52,761,538.46 110,799,230.77 116,339,192.31 122,156,151.92 122,156,151.92 122,156,151.92 122,156,151.92 122,156,151.92 122,156,151.92 122,156,151.92 Cost 23,846,153.85 47,692,307.69 47,692,307.69 47,692,307.69 47,692,307.69 47,692,307.69 47,692,307.69 47,692,307.69 47,692,307.69 47,692,307.69 Profit 28,915,384.62 63,106,923.08 68,646,884.62 74,463,844.23 74,463,844.23 74,463,844.23 74,463,844.23 74,463,844.23 74,463,844.23 74,463,844.23 Remarks: Increment by 5% 1846.653846 1938.99 2035.94 2035.94 2035.94 2035.94 2035.94 2035.94 2035.94 1. 1 production lines = 2 machines 2. 1 Machine can produce 500 MT/Month Productions Cost Year 1 Year 2 Year 3 Year 4 Year 5 Year 6 Year 7 Year 8 Year 9 Year 10 Items Raw Materials 23,076,923.08 46,153,846.15 46,153,846.15 46,153,846.15 46,153,846.15 46,153,846.15 46,153,846.15 46,153,846.15 46,153,846.15 46,153,846.15 Transportation 769,230.77 1,538,461.54 1,538,461.54 1,538,461.54 1,538,461.54 1,538,461.54 1,538,461.54 1,538,461.54 1,538,461.54 1,538,461.54 Total Production Cost 23,846,153.85 47,692,307.69 47,692,307.69 47,692,307.69 47,692,307.69 47,692,307.69 47,692,307.69 47,692,307.69 47,692,307.69 47,692,307.69 Page 1 of 1
  • 91. Cash Flow (Monthly) SAN SAN MEWAH SDN BHD Cashflow (Monthly) Month 1 2 3 4 5 6 7 8 9 10 11 12 CASH IN FLOW: Capital Investor 5,000,000.00 a)Sales Of Catalysts 0.00 0.00 0.00 0.00 0.00 0.00 8,793,589.74 8,793,589.74 8,793,589.74 8,793,589.74 8,793,589.74 8,793,589.74 TOTAL CASH IN FLOW 5,000,000.00 0.00 0.00 0.00 0.00 0.00 8,793,589.74 8,793,589.74 8,793,589.74 8,793,589.74 8,793,589.74 8,793,589.74 CASH OUT FLOW: Cost Of Sales a) Production Cost 0.00 0.00 0.00 0.00 0.00 0.00 3,974,358.97 3,974,358.97 3,974,358.97 3,974,358.97 3,974,358.97 3,974,358.97 b) GST (6%) 0.00 0.00 0.00 0.00 0.00 0.00 527,615.38 527,615.38 527,615.38 527,615.38 527,615.38 527,615.38 Marketing Expenditure Promotion and Advertisement 5,128.21 5,128.21 5,128.21 5,128.21 5,128.21 5,128.21 5,128.21 5,128.21 5,128.21 5,128.21 5,128.21 5,128.21 Administrative Expenditure Salaries 43,205.13 43,205.13 43,205.13 43,205.13 43,205.13 81,666.67 81,666.67 81,666.67 81,666.67 81,666.67 81,666.67 81,666.67 EPF 5,616.67 5,616.67 5,616.67 5,616.67 5,616.67 10,616.67 10,616.67 10,616.67 10,616.67 10,616.67 10,616.67 10,616.67 SOCSO 278.12 278.12 278.12 278.12 278.12 1,337.60 1,337.60 1,337.60 1,337.60 1,337.60 1,337.60 1,337.60 PSMB 432.05 432.05 432.05 432.05 432.05 816.67 816.67 816.67 816.67 816.67 816.67 816.67 Insurance (Hospitalisation & Term Life) 0.00 0.00 0.00 0.00 0.00 57,984.62 0.00 0.00 0.00 0.00 0.00 0.00 Employee Benefits (Medical-Out patient) 107.69 107.69 107.69 107.69 107.69 517.95 517.95 517.95 517.95 517.95 517.95 517.95 Additional Employee Benefits 0.00 0.00 0.00 0.00 0.00 2,481.84 2,481.84 2,481.84 2,481.84 2,481.84 2,481.84 2,481.84 Executive Chairman and Directors Allowances 4,871.79 4,871.79 4,871.79 4,871.79 4,871.79 4,871.79 4,871.79 4,871.79 4,871.79 4,871.79 4,871.79 4,871.79 Management (Tier 1) Allowances 3,846.15 3,846.15 3,846.15 3,846.15 3,846.15 3,846.15 3,846.15 3,846.15 3,846.15 3,846.15 3,846.15 3,846.15 Marketing Allowance 256.41 256.41 256.41 256.41 256.41 256.41 256.41 256.41 256.41 256.41 256.41 256.41 Professional Services & Consultation (10% from Total Project) 500,000.00 0.00 0.00 0.00 0.00 0.00 0.00 0.00 0.00 0.00 0.00 0.00 Factory Maintainance (RM0.35/sqft) 0.00 0.00 0.00 0.00 0.00 0.00 12,196.15 12,196.15 12,196.15 12,196.15 12,196.15 12,196.15 Factory and Office Utilities 2,564.10 2,564.10 2,564.10 2,564.10 2,564.10 2,564.10 19,230.77 19,230.77 19,230.77 19,230.77 19,230.77 19,230.77 Factory and Office Supplies 846.15 846.15 846.15 846.15 846.15 846.15 2,564.10 2,564.10 2,564.10 2,564.10 2,564.10 2,564.10 Insurance Company (0.4% from Total Capex Value) 0.00 0.00 0.00 0.00 0.00 0.00 148,194.87 0.00 0.00 0.00 0.00 0.00 Workers Levy 38,461.54 0.00 0.00 0.00 0.00 0.00 0.00 0.00 0.00 0.00 0.00 0.00 Business Travel 3,846.15 3,846.15 3,846.15 3,846.15 3,846.15 3,846.15 3,846.15 3,846.15 3,846.15 3,846.15 3,846.15 3,846.15 Licensing (DoE,MITI,KDN,etc) 25,641.03 0.00 0.00 0.00 0.00 0.00 0.00 0.00 0.00 0.00 0.00 0.00 Miscellaneous 5,128.21 5,128.21 5,128.21 5,128.21 5,128.21 5,128.21 5,128.21 5,128.21 5,128.21 5,128.21 5,128.21 5,128.21 Bank Charge 256.41 256.41 256.41 256.41 256.41 256.41 256.41 256.41 256.41 256.41 256.41 256.41 Capital Expenditure Purchase Of Fixed Assets 3,704,871.79 0.00 0.00 0.00 0.00 0.00 0.00 0.00 0.00 0.00 0.00 0.00 Loan Repayment 0.00 0.00 0.00 0.00 0.00 0.00 0.00 0.00 0.00 0.00 0.00 0.00 TOTAL CASH OUT FLOW 4,345,357.60 76,383.24 76,383.24 76,383.24 76,383.24 182,165.59 4,804,930.98 4,656,736.11 4,656,736.11 4,656,736.11 4,656,736.11 4,656,736.11 NET SURPLUS/(DEFICIT) 654,642.40 (76,383.24) (76,383.24) (76,383.24) (76,383.24) (182,165.59) 3,988,658.76 4,136,853.64 4,136,853.64 4,136,853.64 4,136,853.64 4,136,853.64 CUMULATIVE NET SURPLUS/(DEFICIT) 654,642.40 578,259.15 501,875.91 425,492.67 349,109.42 166,943.83 4,155,602.59 8,292,456.23 12,429,309.87 16,566,163.50 20,703,017.14 24,839,870.78 PROJECTED STATEMENT OF CASH FLOW FOR MONTH 1 TO MONTH 24 Page 1 of 2
  • 92. Cash Flow (Monthly) SAN SAN MEWAH SDN BHD Cashflow (Monthly) Month CASH IN FLOW: Capital Investor a)Sales Of Catalysts TOTAL CASH IN FLOW CASH OUT FLOW: Cost Of Sales a) Production Cost b) GST (6%) Marketing Expenditure Promotion and Advertisement Administrative Expenditure Salaries EPF SOCSO PSMB Insurance (Hospitalisation & Term Life) Employee Benefits (Medical-Out patient) Additional Employee Benefits Executive Chairman and Directors Allowances Management (Tier 1) Allowances Marketing Allowance Professional Services & Consultation (10% from Total Project) Factory Maintainance (RM0.35/sqft) Factory and Office Utilities Factory and Office Supplies Insurance Company (0.4% from Total Capex Value) Workers Levy Business Travel Licensing (DoE,MITI,KDN,etc) Miscellaneous Bank Charge Capital Expenditure Purchase Of Fixed Assets Loan Repayment TOTAL CASH OUT FLOW NET SURPLUS/(DEFICIT) CUMULATIVE NET SURPLUS/(DEFICIT) PROJECTED STATEMENT OF CASH FLOW FOR MONTH 1 TO MONTH 24 13 14 15 16 17 18 19 20 21 22 23 24 Total 0.00 5,000,000.00 9,233,269.23 9,233,269.23 9,233,269.23 9,233,269.23 9,233,269.23 9,233,269.23 9,233,269.23 9,233,269.23 9,233,269.23 9,233,269.23 9,233,269.23 9,233,269.23 163,560,769.23 9,233,269.23 9,233,269.23 9,233,269.23 9,233,269.23 9,233,269.23 9,233,269.23 9,233,269.23 9,233,269.23 9,233,269.23 9,233,269.23 9,233,269.23 9,233,269.23 168,560,769.23 3,974,358.97 3,974,358.97 3,974,358.97 3,974,358.97 3,974,358.97 3,974,358.97 3,974,358.97 3,974,358.97 3,974,358.97 3,974,358.97 3,974,358.97 3,974,358.97 71,538,461.54 553,996.15 553,996.15 553,996.15 553,996.15 553,996.15 553,996.15 553,996.15 553,996.15 553,996.15 553,996.15 553,996.15 553,996.15 9,813,646.15 5,128.21 5,128.21 5,128.21 5,128.21 5,128.21 5,128.21 5,128.21 5,128.21 5,128.21 5,128.21 5,128.21 5,128.21 123,076.92 85,750.00 85,750.00 85,750.00 85,750.00 85,750.00 85,750.00 85,750.00 85,750.00 85,750.00 85,750.00 85,750.00 85,750.00 1,816,692.31 11,147.50 11,147.50 11,147.50 11,147.50 11,147.50 11,147.50 11,147.50 11,147.50 11,147.50 11,147.50 11,147.50 11,147.50 236,170.00 1,337.60 1,337.60 1,337.60 1,337.60 1,337.60 1,337.60 1,337.60 1,337.60 1,337.60 1,337.60 1,337.60 1,337.60 26,805.03 857.50 857.50 857.50 857.50 857.50 857.50 857.50 857.50 857.50 857.50 857.50 857.50 18,166.92 0.00 0.00 0.00 0.00 0.00 0.00 57,984.62 0.00 0.00 0.00 0.00 0.00 115,969.23 517.95 517.95 517.95 517.95 517.95 517.95 517.95 517.95 517.95 517.95 517.95 517.95 10,379.49 2,481.84 2,481.84 2,481.84 2,481.84 2,481.84 2,481.84 2,481.84 2,481.84 2,481.84 2,481.84 2,481.84 2,481.84 47,154.91 4,871.79 4,871.79 4,871.79 4,871.79 4,871.79 4,871.79 4,871.79 4,871.79 4,871.79 4,871.79 4,871.79 4,871.79 116,923.08 3,846.15 3,846.15 3,846.15 3,846.15 3,846.15 3,846.15 3,846.15 3,846.15 3,846.15 3,846.15 3,846.15 3,846.15 92,307.69 256.41 256.41 256.41 256.41 256.41 256.41 256.41 256.41 256.41 256.41 256.41 256.41 6,153.85 0.00 0.00 0.00 0.00 0.00 0.00 0.00 0.00 0.00 0.00 0.00 0.00 500,000.00 12,196.15 12,196.15 12,196.15 12,196.15 12,196.15 12,196.15 12,196.15 12,196.15 12,196.15 12,196.15 12,196.15 12,196.15 219,530.77 19,230.77 19,230.77 19,230.77 19,230.77 19,230.77 19,230.77 19,230.77 19,230.77 19,230.77 19,230.77 19,230.77 19,230.77 361,538.46 2,564.10 2,564.10 2,564.10 2,564.10 2,564.10 2,564.10 2,564.10 2,564.10 2,564.10 2,564.10 2,564.10 2,564.10 51,230.77 0.00 0.00 0.00 0.00 0.00 0.00 0.00 0.00 0.00 0.00 0.00 0.00 148,194.87 40,384.62 0.00 0.00 0.00 0.00 0.00 0.00 0.00 0.00 0.00 0.00 0.00 78,846.15 3,846.15 3,846.15 3,846.15 3,846.15 3,846.15 3,846.15 3,846.15 3,846.15 3,846.15 3,846.15 3,846.15 3,846.15 92,307.69 25,641.03 0.00 0.00 0.00 0.00 0.00 0.00 0.00 0.00 0.00 0.00 0.00 51,282.05 5,128.21 5,128.21 5,128.21 5,128.21 5,128.21 5,128.21 5,128.21 5,128.21 5,128.21 5,128.21 5,128.21 5,128.21 123,076.92 256.41 256.41 256.41 256.41 256.41 256.41 256.41 256.41 256.41 256.41 256.41 256.41 6,153.85 0.00 0.00 0.00 0.00 0.00 0.00 0.00 0.00 0.00 0.00 0.00 0.00 3,704,871.79 0.00 0.00 0.00 0.00 0.00 0.00 0.00 0.00 0.00 0.00 0.00 0.00 0.00 4,753,797.52 4,687,771.88 4,687,771.88 4,687,771.88 4,687,771.88 4,687,771.88 4,745,756.49 4,687,771.88 4,687,771.88 4,687,771.88 4,687,771.88 4,687,771.88 89,298,940.45 4,479,471.71 4,545,497.35 4,545,497.35 4,545,497.35 4,545,497.35 4,545,497.35 4,487,512.74 4,545,497.35 4,545,497.35 4,545,497.35 4,545,497.35 4,545,497.35 79,261,828.78 29,319,342.49 33,864,839.85 38,410,337.20 42,955,834.56 47,501,331.91 52,046,829.26 56,534,342.00 61,079,839.36 65,625,336.71 70,170,834.07 74,716,331.42 79,261,828.78 PROJECTED STATEMENT OF CASH FLOW FOR MONTH 1 TO MONTH 24 Page 2 of 2
  • 93. Projected Cash Flow for the First 2 Years 5.00 0.00 0.00 0.00 0.00 0.00 8.79 8.79 8.79 8.79 8.79 8.79 9.23 9.23 9.23 9.23 9.23 9.23 9.23 9.23 9.23 9.23 9.23 9.23 4.35 0.08 0.08 0.08 0.08 0.18 4.80 4.66 4.66 4.66 4.66 4.66 4.75 4.69 4.69 4.69 4.69 4.69 4.75 4.69 4.69 4.69 4.69 4.69 0.65 0.58 0.50 0.43 0.35 0.17 4.16 8.29 12.43 16.57 20.70 24.84 29.32 33.86 38.41 42.96 47.50 52.05 56.53 61.08 65.63 70.17 74.72 79.26 0.00 10.00 20.00 30.00 40.00 50.00 60.00 70.00 80.00 90.00 1 2 3 4 5 6 7 8 9 10 11 12 13 14 15 16 17 18 19 20 21 22 23 24 Millions TOTAL CASH IN FLOW TOTAL CASH OUT FLOW CUMULATIVE NET SURPLUS/(DEFICIT)
  • 94. Cash Flow (Yearly) SAN SAN MEWAH SDN BHD Cashflow Yearly Year 1 2 3 4 5 6 7 8 9 10 Total CASH IN FLOW: Capital 0.00 Investor 5,000,000.00 5,000,000.00 a)Sales Of Catalysts 52,761,538.46 110,799,230.77 116,339,192.31 122,156,151.92 122,156,151.92 122,156,151.92 122,156,151.92 122,156,151.92 122,156,151.92 122,156,151.92 1,134,993,025.00 TOTAL CASH IN FLOW 57,761,538.46 110,799,230.77 116,339,192.31 122,156,151.92 122,156,151.92 122,156,151.92 122,156,151.92 122,156,151.92 122,156,151.92 122,156,151.92 1,139,993,025.00 CASH OUT FLOW: Cost Of Sales a) Production Cost 23,846,153.85 47,692,307.69 47,692,307.69 47,692,307.69 47,692,307.69 47,692,307.69 47,692,307.69 47,692,307.69 47,692,307.69 47,692,307.69 453,076,923.08 b) GST (6%) 3,165,692.31 6,647,953.85 6,980,351.54 7,329,369.12 7,329,369.12 7,329,369.12 7,329,369.12 7,329,369.12 7,329,369.12 7,329,369.12 68,099,581.50 Marketing Expenditure Promotion and Advertisement 72,727.27 72,727.27 72,727.27 72,727.27 72,727.27 72,727.27 72,727.27 72,727.27 72,727.27 72,727.27 727,272.73 Administrative Expenditure Salaries 787,692.31 1,029,000.00 1,080,450.00 1,134,472.50 1,191,196.13 1,250,755.93 1,313,293.73 1,378,958.41 1,447,906.33 1,520,301.65 12,134,026.99 EPF 102,400.00 133,770.00 140,458.50 147,481.43 154,855.50 162,598.27 170,728.18 179,264.59 188,227.82 197,639.21 1,577,423.51 SOCSO 10,753.79 16,051.23 16,051.23 16,051.23 16,051.23 16,051.23 16,051.23 16,051.23 16,051.23 16,051.23 155,214.87 PSMB 7,876.92 10,290.00 10,804.50 11,344.73 11,911.96 12,507.56 13,132.94 13,789.58 14,479.06 15,203.02 121,340.27 Insurance (Hospitalisation & Term Life) 57,984.62 57,984.62 57,984.62 57,984.62 57,984.62 57,984.62 57,984.62 57,984.62 57,984.62 57,984.62 579,846.15 Employee Benefits (Medical-Out patient) 4,164.10 6,215.38 6,215.38 6,215.38 6,215.38 6,215.38 6,215.38 6,215.38 6,215.38 6,215.38 60,102.56 Additional Employee Benefits 17,372.86 29,782.05 29,782.05 29,782.05 29,782.05 29,782.05 29,782.05 29,782.05 29,782.05 29,782.05 285,411.32 Executive Chairman and Directors Allowances 58,461.54 58,461.54 58,461.54 58,461.54 58,461.54 58,461.54 58,461.54 58,461.54 58,461.54 58,461.54 584,615.38 Management (Tier 1) Allowances 46,153.85 46,153.85 46,153.85 46,153.85 46,153.85 46,153.85 46,153.85 46,153.85 46,153.85 46,153.85 461,538.46 Marketing Allowance 3,076.92 3,076.92 3,076.92 3,076.92 3,076.92 3,076.92 3,076.92 3,076.92 3,076.92 3,076.92 30,769.23 Professional Services & Consultation (10% from Total Project) 500,000.00 0.00 0.00 0.00 0.00 0.00 0.00 0.00 0.00 0.00 500,000.00 Factory Maintainance (RM0.35/sqft) 73,176.92 146,353.85 146,353.85 146,353.85 146,353.85 146,353.85 146,353.85 146,353.85 146,353.85 146,353.85 1,390,361.54 Factory and Office Utilities 130,769.23 230,769.23 230,769.23 230,769.23 230,769.23 230,769.23 230,769.23 230,769.23 230,769.23 230,769.23 2,207,692.31 Factory and Office Supplies 20,461.54 30,769.23 30,769.23 30,769.23 30,769.23 30,769.23 30,769.23 30,769.23 30,769.23 30,769.23 297,384.62 Insurance Company (0.4% from Total Capex Value) 148,194.87 155,604.62 163,384.85 171,554.09 180,131.79 189,138.38 198,595.30 208,525.07 218,951.32 229,898.89 1,863,979.17 Workers Levy 38,461.54 40,384.62 42,403.85 44,524.04 46,750.24 49,087.75 51,542.14 54,119.25 56,825.21 59,666.47 483,765.10 Business Travel 46,153.85 46,153.85 46,153.85 46,153.85 46,153.85 46,153.85 46,153.85 46,153.85 46,153.85 46,153.85 461,538.46 Licensing (DoE,MITI,KDN,etc) 25,641.03 25,641.03 25,641.03 25,641.03 25,641.03 25,641.03 25,641.03 25,641.03 25,641.03 25,641.03 256,410.26 Miscellaneous 61,538.46 61,538.46 61,538.46 61,538.46 61,538.46 61,538.46 61,538.46 61,538.46 61,538.46 61,538.46 615,384.62 Bank Charge 3,076.92 3,076.92 3,076.92 3,076.92 3,076.92 3,076.92 3,076.92 3,076.92 3,076.92 3,076.92 30,769.23 Capital Expenditure Purchase Of Fixed Assets 3,704,871.79 0.00 0.00 0.00 0.00 0.00 0.00 0.00 0.00 0.00 3,704,871.79 Loan Repayment 0.00 0.00 0.00 0.00 0.00 0.00 0.00 0.00 0.00 0.00 0.00 TOTAL CASH OUT FLOW 32,932,856.49 56,544,066.20 56,944,916.35 57,365,809.01 57,441,277.85 57,520,520.13 57,603,724.53 57,691,089.14 57,782,821.99 57,879,141.47 549,706,223.16 NET SURPLUS/(DEFICIT) 24,828,681.97 54,255,164.57 59,394,275.96 64,790,342.91 64,714,874.07 64,635,631.79 64,552,427.40 64,465,062.78 64,373,329.94 64,277,010.45 590,286,801.84 CUMULATIVE NET SURPLUS/(DEFICIT) 24,828,681.97 79,083,846.54 138,478,122.50 203,268,465.41 267,983,339.48 332,618,971.28 397,171,398.67 461,636,461.46 526,009,791.39 590,286,801.84 PROJECTED STATEMENT OF CASH FLOW FOR YEAR 1 TO YEAR 10 Page 1 of 1
  • 95. Projected Cash Flow for 10 Years 57.76 110.80 116.34 122.16 122.16 122.16 122.16 122.16 122.16 122.16 32.93 56.54 56.94 57.37 57.44 57.52 57.60 57.69 57.78 57.88 24.83 79.08 138.48 203.27 267.98 332.62 397.17 461.64 526.01 590.29 0.00 100.00 200.00 300.00 400.00 500.00 600.00 700.00 1 2 3 4 5 6 7 8 9 10 Millions TOTAL CASH IN FLOW TOTAL CASH OUT FLOW CUMULATIVE NET SURPLUS/(DEFICIT)
  • 96. P&L (Yearly) SAN SAN MEWAH SDN BHD Profit & Loss Year 1 (USD) 2 (USD) 3 (USD) 4 (USD) 5 (USD) 6 (USD) 7 (USD) 8 (USD) 9 (USD) 10 (USD) Total (USD) SALES: a)Sales Of Catalysts 52,761,538.46 110,799,230.77 116,339,192.31 122,156,151.92 122,156,151.92 122,156,151.92 122,156,151.92 122,156,151.92 122,156,151.92 122,156,151.92 1,134,993,025.00 Total Sales 52,761,538.46 110,799,230.77 116,339,192.31 122,156,151.92 122,156,151.92 122,156,151.92 122,156,151.92 122,156,151.92 122,156,151.92 122,156,151.92 1,134,993,025.00 Cost Of Sales a) Production Cost 23,846,153.85 47,692,307.69 47,692,307.69 47,692,307.69 47,692,307.69 47,692,307.69 47,692,307.69 47,692,307.69 47,692,307.69 47,692,307.69 453,076,923.08 b) GST (6%) 3,165,692.31 6,647,953.85 6,980,351.54 7,329,369.12 7,329,369.12 7,329,369.12 7,329,369.12 7,329,369.12 7,329,369.12 7,329,369.12 68,099,581.50 Total cost of sales 27,011,846.15 54,340,261.54 54,672,659.23 55,021,676.81 55,021,676.81 55,021,676.81 55,021,676.81 55,021,676.81 55,021,676.81 55,021,676.81 521,176,504.58 GROSS PROFIT 25,749,692.31 56,458,969.23 61,666,533.08 67,134,475.12 67,134,475.12 67,134,475.12 67,134,475.12 67,134,475.12 67,134,475.12 67,134,475.12 613,816,520.42 LESS: Marketing Expenditure Promotion and Advertisement 72,727.27 72,727.27 72,727.27 72,727.27 72,727.27 72,727.27 72,727.27 72,727.27 72,727.27 72,727.27 727,272.73 Administrative Expenditure Salaries 787,692.31 1,029,000.00 1,080,450.00 1,134,472.50 1,191,196.13 1,250,755.93 1,313,293.73 1,378,958.41 1,447,906.33 1,520,301.65 12,134,026.99 EPF 102,400.00 133,770.00 140,458.50 147,481.43 154,855.50 162,598.27 170,728.18 179,264.59 188,227.82 197,639.21 1,577,423.51 SOCSO 10,753.79 16,051.23 16,051.23 16,051.23 16,051.23 16,051.23 16,051.23 16,051.23 16,051.23 16,051.23 155,214.87 PSMB 7,876.92 10,290.00 10,804.50 11,344.73 11,911.96 12,507.56 13,132.94 13,789.58 14,479.06 15,203.02 121,340.27 Insurance (Hospitalisation & Term Life) 57,984.62 57,984.62 57,984.62 57,984.62 57,984.62 57,984.62 57,984.62 57,984.62 57,984.62 57,984.62 579,846.15 Employee Benefits (Medical-Out patient) 4,164.10 6,215.38 6,215.38 6,215.38 6,215.38 6,215.38 6,215.38 6,215.38 6,215.38 6,215.38 60,102.56 Additional Employee Benefits 17,372.86 29,782.05 29,782.05 29,782.05 29,782.05 29,782.05 29,782.05 29,782.05 29,782.05 29,782.05 285,411.32 Executive Chairman and Directors Allowances 58,461.54 58,461.54 58,461.54 58,461.54 58,461.54 58,461.54 58,461.54 58,461.54 58,461.54 58,461.54 584,615.38 Management (Tier 1) Allowances 46,153.85 46,153.85 46,153.85 46,153.85 46,153.85 46,153.85 46,153.85 46,153.85 46,153.85 46,153.85 461,538.46 Marketing Allowance 3,076.92 3,076.92 3,076.92 3,076.92 3,076.92 3,076.92 3,076.92 3,076.92 3,076.92 3,076.92 30,769.23 Professional Services & Consultation (10% from Total Project) 500,000.00 0.00 0.00 0.00 0.00 0.00 0.00 0.00 0.00 0.00 500,000.00 Factory Maintainance (RM0.35/sqft) 73,176.92 146,353.85 146,353.85 146,353.85 146,353.85 146,353.85 146,353.85 146,353.85 146,353.85 146,353.85 1,390,361.54 Factory and Office Utilities 130,769.23 230,769.23 230,769.23 230,769.23 230,769.23 230,769.23 230,769.23 230,769.23 230,769.23 230,769.23 2,207,692.31 Factory and Office Supplies 20,461.54 30,769.23 30,769.23 30,769.23 30,769.23 30,769.23 30,769.23 30,769.23 30,769.23 30,769.23 297,384.62 Insurance Company (0.4% from Total Capex Value) 148,194.87 155,604.62 163,384.85 171,554.09 180,131.79 189,138.38 198,595.30 208,525.07 218,951.32 229,898.89 1,863,979.17 Workers Levy 38,461.54 40,384.62 42,403.85 44,524.04 46,750.24 49,087.75 51,542.14 54,119.25 56,825.21 59,666.47 483,765.10 Business Travel 46,153.85 46,153.85 46,153.85 46,153.85 46,153.85 46,153.85 46,153.85 46,153.85 46,153.85 46,153.85 461,538.46 Licensing (DoE,MITI,KDN,etc) 25,641.03 25,641.03 25,641.03 25,641.03 25,641.03 25,641.03 25,641.03 25,641.03 25,641.03 25,641.03 256,410.26 Miscellaneous 61,538.46 61,538.46 61,538.46 61,538.46 61,538.46 61,538.46 61,538.46 61,538.46 61,538.46 61,538.46 615,384.62 Bank Charge 3,076.92 3,076.92 3,076.92 3,076.92 3,076.92 3,076.92 3,076.92 3,076.92 3,076.92 3,076.92 30,769.23 TOTAL OPERATING EXPENDITURE 2,216,138.55 2,203,804.66 2,272,257.12 2,344,132.20 2,419,601.04 2,498,843.32 2,582,047.72 2,669,412.33 2,761,145.18 2,857,464.67 24,824,846.79 Depreciations (Office Equipments) 6,410.26 6,410.26 6,410.26 6,410.26 6,410.26 6,410.26 6,410.26 6,410.26 6,410.26 6,410.26 64,102.56 Depreciations (Land/Office/Factory Building) 153,276.92 153,276.92 153,276.92 153,276.92 153,276.92 153,276.92 153,276.92 153,276.92 153,276.92 153,276.92 1,532,769.23 Depreciations (Machinery/Containers) 110,256.41 110,256.41 110,256.41 110,256.41 110,256.41 110,256.41 110,256.41 110,256.41 110,256.41 110,256.41 1,102,564.10 Depreciations (Company Vehicles) 37,820.51 37,820.51 37,820.51 37,820.51 37,820.51 37,820.51 37,820.51 37,820.51 37,820.51 37,820.51 378,205.13 TOTAL DEPRECIATION 307,764.10 307,764.10 307,764.10 307,764.10 307,764.10 307,764.10 307,764.10 307,764.10 307,764.10 307,764.10 3,077,641.03 Loan Repayment 0.00 0.00 0.00 0.00 0.00 0.00 0.00 0.00 0.00 0.00 0.00 TOTAL EXPENDITURE 2,216,138.55 2,203,804.66 2,272,257.12 2,344,132.20 2,419,601.04 2,498,843.32 2,582,047.72 2,669,412.33 2,761,145.18 2,857,464.67 27,902,487.81 PROFITS BEFORE TAX 23,533,553.76 54,255,164.57 59,394,275.96 64,790,342.91 64,714,874.07 64,635,631.79 64,552,427.40 64,465,062.78 64,373,329.94 64,277,010.45 588,991,673.64 EBITDA (Earning Before Interest,Taxes,Depreciation and Amortization) 23,841,317.86 54,562,928.68 59,702,040.06 65,098,107.01 65,022,638.18 64,943,395.89 64,860,191.50 64,772,826.89 64,681,094.04 64,584,774.55 592,069,314.66 PROJECTED INCOME STATEMENT FOR YEAR 1 TO YEAR 10 (Profit & Loss) Page 1 of 1
  • 97. Thank You SAN SAN MEWAH SDN BHD