CASE 2-33 Medicare Provider Analysis and Review (MEDPAR) Data Analy.docx
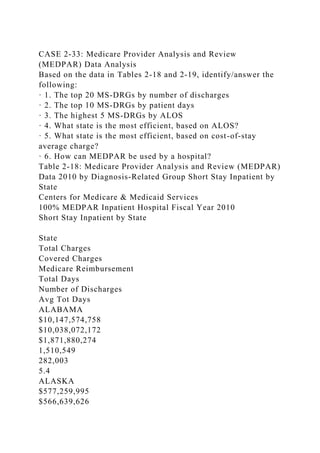
CASE 2-33: Medicare Provider Analysis and Review (MEDPAR) Data Analysis Based on the data in Tables 2-18 and 2-19, identify/answer the following: · 1. The top 20 MS-DRGs by number of discharges · 2. The top 10 MS-DRGs by patient days · 3. The highest 5 MS-DRGs by ALOS · 4. What state is the most efficient, based on ALOS? · 5. What state is the most efficient, based on cost-of-stay average charge? · 6. How can MEDPAR be used by a hospital? Table 2-18: Medicare Provider Analysis and Review (MEDPAR) Data 2010 by Diagnosis-Related Group Short Stay Inpatient by State Centers for Medicare & Medicaid Services 100% MEDPAR Inpatient Hospital Fiscal Year 2010 Short Stay Inpatient by State State Total Charges Covered Charges Medicare Reimbursement Total Days Number of Discharges Avg Tot Days ALABAMA $10,147,574,758 $10,038,072,172 $1,871,880,274 1,510,549 282,003 5.4 ALASKA $577,259,995 $566,639,626 $178,507,545 63,829 12,412 5.1 ARIZONA $12,131,537,372 $12,004,545,106 $1,890,455,415 1,259,379 268,233 4.7 ARKANSAS $4,650,893,942 $4,617,340,101 $1,198,753,807 859,328 163,926 5.2 CALIFORNIA $76,320,204,015 $75,110,250,884 $11,191,656,553 5,991,233 1,159,833 5.2 COLORADO $6,904,049,450 $6,859,514,264 $1,117,218,735 682,982 145,861 4.7 CONNECTICUT $6,139,247,809 $6,046,063,110 $1,797,610,980 1,018,530 179,172 5.7 DELAWARE $1,196,604,851 $1,188,116,227 $444,808,903 244,161 43,237 5.6 DISTRICT OF CO $1,801,374,695 $1,758,124,064 $535,615,255 244,515 38,178 6.4 FLORIDA $52,617,494,107 $52,293,923,852 $7,587,899,229 5,830,082 1,099,252 5.3 GEORGIA $12,774,675,044 $12,670,647,571 $2,971,580,228 1,993,096 366,794 5.4 HAWAII $1,155,327,643 $1,128,511,837 $303,609,640 210,869 32,879 6.4 IDAHO $1,070,859,131 $1,068,209,787 $282,670,824 172,290 39,761 4.3 ILLINOIS $23,220,247,028 $22,986,364,994 $5,506,557,400 3,167,766 616,325 5.1 INDIANA $10,046,158,605 $9,974,718,544 $2,644,144,815 1,667,772 322,776 5.2 IOWA $3,500,727,854 $3,471,430,275 $987,181,870 620,740 124,562 5 KANSAS $4,298,673,428 $4,272,076,840 $967,292,484 596,333 118,347 5 KENTUCKY $7,569,184,626 $7,505,177,124 $2,044,026,403 1,379,637 264,888 5.2 LOUISIANA $8,235,304,586 $8,133,823,924 $1,647,692,129 1,279,408 231,488 5.5 MAINE $1,447,797,039 $1,434,223,961 $533,523,616 304,584 61,257 5 MARYLAND $3,946,237,184 $3,883,076,774 $3,223,158,908 1,367,904 276,931 4.9 MASSACHUSETTS $9,139,634,478 $9,036,823,618 $3,389,376,309 1,843,260 357,214 5.2 MICHIGAN $15,619,449,714 $15,466,296,055 $4,996,125,348 2,958,671 555,665 5.3 MINNESOTA $6,935,040,451 $6,873,436,755 $1,829,860,224 952,088 205,607 4.6 MISSISSIPPI $5,382,816,252 $5,340,100,260 $1,317,180,432 957,191 169,249 5.7 MISSOURI $11,736,910,838 $11,455,708,404 $2,690,755,303 1,782,840 344,361 5.2 MONTANA $865,186,366 $858,204,690 $266,045,718 158,962 34,071 4.7 NEBRASKA $2,758,111,247 $2,737,944,914 $670,223,142 380,521 74,966 5.1 NEVADA.

Recommended
Recommended
More Related Content
More from annandleola
More from annandleola (20)
CASE 2-33 Medicare Provider Analysis and Review (MEDPAR) Data Analy.docx
- 1. CASE 2-33: Medicare Provider Analysis and Review (MEDPAR) Data Analysis Based on the data in Tables 2-18 and 2-19, identify/answer the following: · 1. The top 20 MS-DRGs by number of discharges · 2. The top 10 MS-DRGs by patient days · 3. The highest 5 MS-DRGs by ALOS · 4. What state is the most efficient, based on ALOS? · 5. What state is the most efficient, based on cost-of-stay average charge? · 6. How can MEDPAR be used by a hospital? Table 2-18: Medicare Provider Analysis and Review (MEDPAR) Data 2010 by Diagnosis-Related Group Short Stay Inpatient by State Centers for Medicare & Medicaid Services 100% MEDPAR Inpatient Hospital Fiscal Year 2010 Short Stay Inpatient by State State Total Charges Covered Charges Medicare Reimbursement Total Days Number of Discharges Avg Tot Days ALABAMA $10,147,574,758 $10,038,072,172 $1,871,880,274 1,510,549 282,003 5.4 ALASKA $577,259,995 $566,639,626
- 7. $2,758,111,247 $2,737,944,914 $670,223,142 380,521 74,966 5.1 NEVADA $6,179,609,713 $6,115,884,991 $775,757,239 522,179 98,868 5.3 NEW HAMPSHIRE $1,476,037,830 $1,467,436,682 $460,132,445 252,953 47,692 5.3 NEW JERSEY $28,489,630,729 $28,080,939,035 $4,101,798,474 2,516,729 425,674 5.9 NEW MEXICO $2,050,325,541 $2,036,148,735 $484,642,557 304,839 63,606 4.8 NEW YORK $36,991,790,908
- 9. $858,307,627 594,065 128,713 4.6 PENNSYLVANIA $37,410,926,656 $36,256,231,748 $5,280,683,810 4,378,798 787,788 5.6 PUERTO RICO $603,859,499 $598,657,220 $177,973,749 432,535 63,620 6.8 RHODE ISLAND $1,756,908,758 $1,729,754,707 $405,756,528 313,857 55,596 5.6 SOUTH CAROLINA $8,807,688,270 $8,737,287,659 $1,858,440,523 1,228,448 218,321 5.6 SOUTH DAKOTA $1,167,580,116 $1,155,116,775 $335,715,909
- 12. 4.6 UNKNOWN $26,501,628 $25,960,389 $11,968,865 17,531 2,325 7.5 TOTAL LINE $559,877,318,647 $552,123,330,164 $117,536,919,129 75,734,539 14,128,677 5.4 Courtesy of the Centers for Medicare and Medicaid Services. Table 2-19: Medicare Provider Analysis and Review (MEDPAR) Inpatient National Data by Short Stay Inpatient Diagnosis- Related Groups (DRGs) Centers for Medicare & Medicaid Services 100% MEDPAR Inpatient Hospital National Data for Fiscal Year 2010 Short Stay Inpatient Diagnosis Related Groups Blank cells represent ten or less discharges in order to conform to CMS guidelines, zero means no discharges, therefore, sum of columns will not equal total Drg Total Charges Covered Charges Medicare Reimbursement Total Days Number of Discharges Avg Tot Days 1 $1,117,985,829