Download as PDF, PPTX
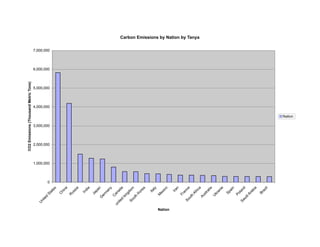
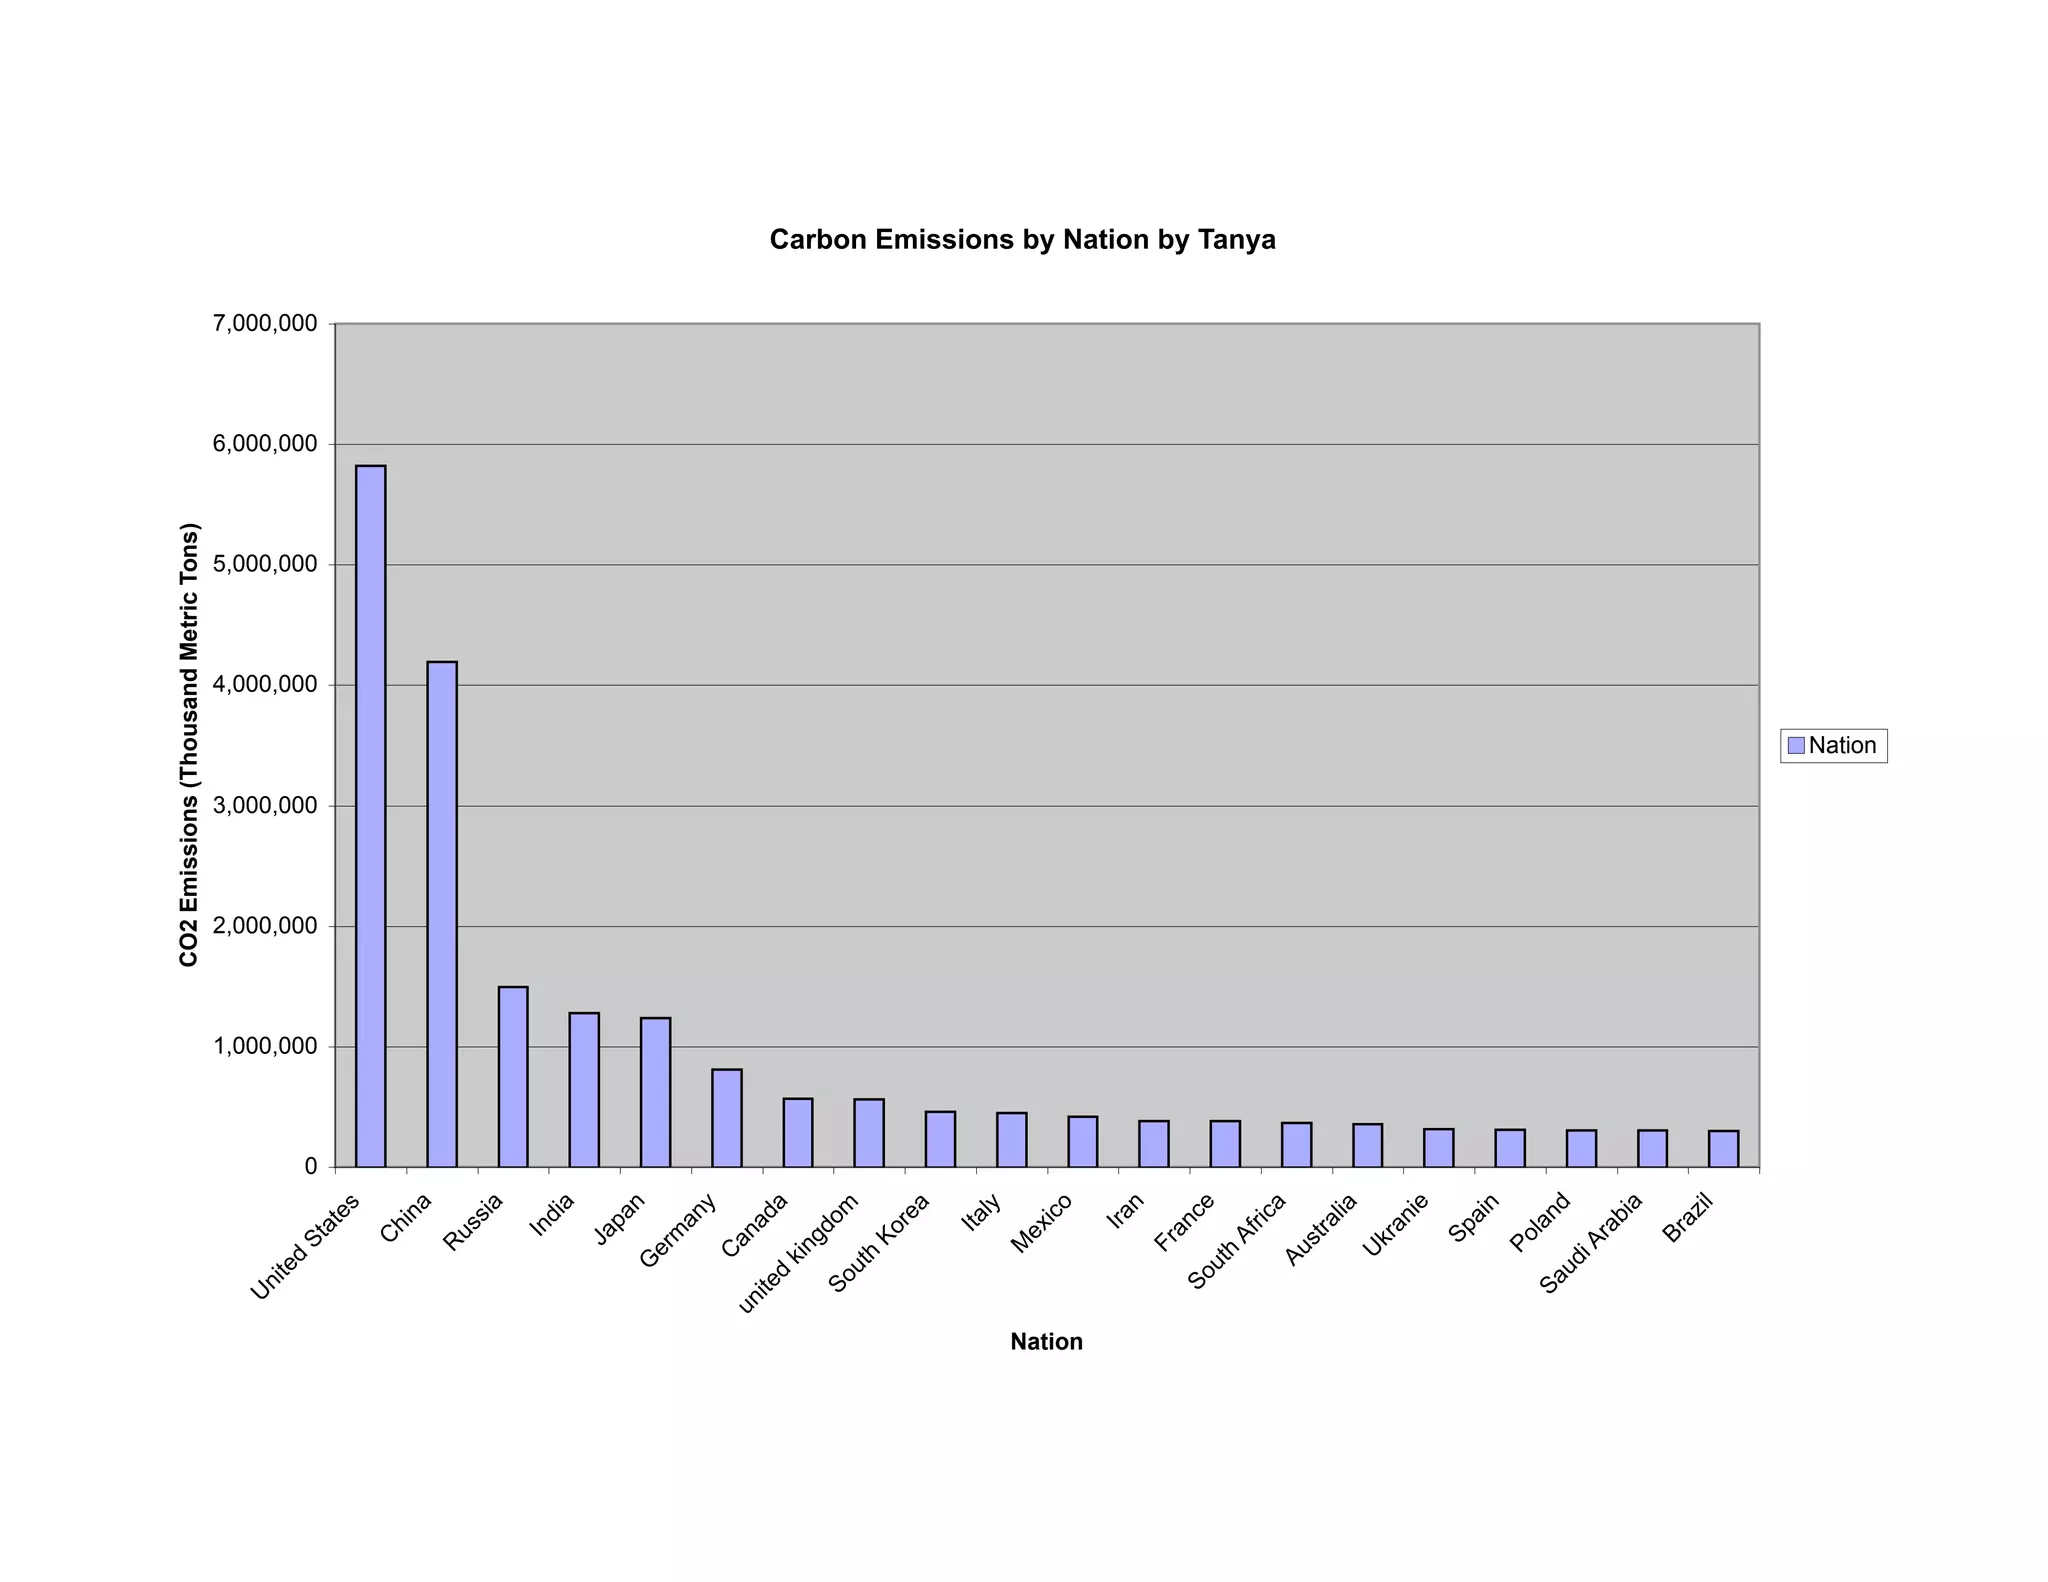

The document is a bar graph showing carbon dioxide (CO2) emissions in thousands of metric tons for various nations from largest to smallest emitter. The United States has the highest emissions at around 6,000,000 thousand metric tons, followed by China at around 3,000,000, then India at around 2,000,000.


