
Recommended
Recommended
More Related Content
What's hot
What's hot (20)
Similar to Cancer cases in Canada are projected to rise
Similar to Cancer cases in Canada are projected to rise (20)
More from Δρ. Γιώργος K. Κασάπης
More from Δρ. Γιώργος K. Κασάπης (20)
Recently uploaded
Recently uploaded (20)
Cancer cases in Canada are projected to rise
- 1. © 2020 Joule Inc. or its licensors CMAJ | MARCH 2, 2020 | VOLUME 192 | ISSUE 9 E199 C ancer poses a large and growing impact on the Canadian population and health care system. Nearly half of Canad ians are expected to receive a diagnosis of cancer in their lifetime and, although age-standardized cancer mortality rates have decreased substantially since they peaked in 1988, cancer remains the leading cause of death among Canadians.1,2 In addi tion, the number of new cancer cases and cancer deaths has been increasing each year as the population grows and ages.3–5 Cancer is also costly; the costs of cancer care in Canada rose from Can$2.9 billion in 2005 to Can$7.5 billion in 2012.6 Given the increasing number of cancer diagnoses, costs to people with can cer, their families and the health care system overall are likely to continue to rise in the future. Comprehensive and reliable surveillance information is neces sary to identify where progress has been made and where more attention and resources are needed. Canadian Cancer Statistics is a partnership between the Canadian Cancer Society, the Public Health Agency of Canada and Statistics Canada, in collaboration with the provincial and territorial cancer registries, that is aimed at producing and disseminating the latest surveillance statistics on cancer in Canada. This includes incidence and mortality counts and rates. Age-standardized incidence and mortality rates for cancer facilitate comparisons across populations and over time by adjusting for differences in the age distribution of the popula tions being compared. Age-standardized rates, along with counts, provide a picture of the burden of cancer in Canada that is fundamental to cancer-control planning, allocation of health care resources and research. Because time is required to collect, collate, verify, analyze and report on cancer data, dissemination of information can lag several years behind the current year. Therefore, short-term projections are used to provide a more up- to-date picture of the cancer burden. In September 2019, Canadian Cancer Statistics 2019 was released, providing detailed estimates of cancer incidence, mortal ity and survival in Canada by age, sex, geographic region (provinces RESEARCH Projected estimates of cancer in Canada in 2020 Darren R. Brenner PhD, Hannah K. Weir PhD, Alain A. Demers MSc PhD, Larry F. Ellison MSc, Cheryl Louzado MSc MHSc, Amanda Shaw MSc, Donna Turner PhD, Ryan R. Woods PhD, Leah M. Smith PhD; for the Canadian Cancer Statistics Advisory Committee n Cite as: CMAJ 2020 March 2;192:E199-205. doi: 10.1503/cmaj.191292 ABSTRACT BACKGROUND: Cancer projections to the current year help in policy development, planning of programs and allocation of resources. We sought to provide an over view of the expected incidence and mor tality of cancer in Canada in 2020 in follow-up to the Canadian Cancer Statis- tics 2019 report. METHODS: We obtained incidence data from the National Cancer Incidence Reporting System (1984–1991) and Canadian Cancer Registry (1992–2015). Mortality data (1984–2015) were obtained from the Canadian Vital Statis tics — Death Database. All databases are maintained by Statistics Canada. Cancer incidence and mortality counts and age- standardized rates were projected to 2020 for 23 cancer types by sex and geo graphic region (provinces and territor ies) for all ages combined. RESULTS: An estimated 225 800 new cancer cases and 83 300 cancer deaths are expected in Canada in 2020. The most commonly diagnosed cancers are expected to be lung overall (29 800), breast in females (27 400) and prostate in males (23 300). Lung cancer is also expected to be the leading cause of can cer death, accounting for 25.5% of all cancer deaths, followed by colorectal (11.6%), pancreatic (6.4%) and breast (6.1%) cancers. Incidence and mortality rates will be generally higher in the eastern provinces than in the western provinces. INTERPRETATION: The number of cancer cases and deaths remains high in Canada and, owing to the growing and aging population, is expected to continue to increase. Although progress has been made in reducing deaths for most major cancers (breast, prostate and lung), there has been limited progress for pancreatic cancer, which is expected to be the third leading cause of cancer death in Canada in 2020. Additional efforts to improve uptake of existing programs, as well as to advance research, prevention, screening and treatment, are needed to address the cancer burden in Canada.
- 2. RESEARCH E200 CMAJ | MARCH 2, 2020 | VOLUME 192 | ISSUE 9 and territories) and over time for 23 cancer types.1 We sought to provide an updated picture of cancer in Canada, presenting esti mates of the counts and age-standardized rates of new cancer cases (incidence) and cancer deaths (mortality) expected in 2020 by sex and province and territory for all ages combined. Methods The methods and data sources used in this study are described in detail in Canadian Cancer Statistics 2019.1 A brief description follows. Sources of data We obtained data for cancer incidence from 1984 to 1991 from the National Cancer Incidence Reporting System and data from 1992 to 2015 from the November 2017 Canadian Cancer Registry Tabulation Master File,7 released Jan. 29, 2018. Mortality data from 1984 to 2015 were obtained from the Canadian Vital Statis tics — Death Database.8 These national, population-based data bases are housed at Statistics Canada and populated by provin cial and territorial data submissions. We also obtained actual and projected population estimates from Statistics Canada.9–11 Statistical analysis To obtain current estimates of cancer incidence and mortality, we projected counts and rates to 2016–2020 using the CANPROJ projec tion package.12 CANPROJ uses trends in actual (i.e., historical) data to select the best-fit model for subsequent years based on a decision algorithm from a series of 6 age-, period- and cohort-based models. Additional details related to the models available in CANPROJ, as well as details of past validations, are included in Appendix 1 (avail able at www.cmaj.ca/lookup/suppl/doi:10.1503/cmaj.191292/-/DC1). We generated projected estimates for 23 cancer types by sex and geographic region (provinces and territories). Definitions of cancer types are in Appendix 2, Supplementary Table 1 (available at www. cmaj.ca/lookup/suppl/doi:10.1503/cmaj.191292/-/DC1). All incidence and mortality rates were age standardized to the 2011 Canadian standard population using the direct method. The Canadian Cancer Statistics Advisory Committee reviewed each model selected by CANPROJ for face validity alongside the 5 other models produced to suggest the most appropriate model. Deci sions on the final models for each province and territory were made in consultation with that jurisdiction’s cancer registry. The CANPROJ-selected model was the final model in more than 90% of cases. We allowed alternative models in exceptional circum stances where the registry’s more recent data or a recent impor tant change in policy or practice suggested the estimate would be considerably (> 10%) different from the projected estimate. Data on cancer cases diagnosed in the province of Quebec from 2011 onward were unavailable as they had yet to be submitted to the Canadian Cancer Registry. Because data were available only to 2010 for Quebec, we estimated Quebec-specific cases and inci dence rates for 2011–2020 by first applying the rates of Canada without Quebec to the Quebec population. Quebec rates were then corrected based on the average rate for the rest of the country mul tiplied by the ratio of sex-, age- and cancer-specific estimates for Quebec relative to Canada (excluding Quebec) for 2006–2010. We computed projected estimates for Canada as a whole as sums of the projections for each individual province and territory. Ethics approval Because this study involved the analysis of publicly available admin istrative data and did not involve contacting individuals, consider ation and approval by an ethics review board was not required. Results Projected cancer incidence An estimated 225 800 new cases of cancer are expected to be diagnosed in Canada in 2020 (Table 1). Lung and bronchus (lung) cancer is projected to be the most commonly diagnosed cancer, with an estimated 29 800 cases, followed by breast (27 400), colorectal (26 900) and prostate (23 300) cancers. These 4 cancers are expected to account for about half (48%) of all cancers diag nosed in 2020. Among males, prostate cancer is expected to be the most commonly diagnosed cancer, accounting for about 1 in 5 new cases, followed by lung (13%), colorectal (13%) and bladder (8%) cancers. Among females, breast cancer is expected to be the most commonly diagnosed cancer, accounting for 1 in 4 new cases, followed by lung (13%), colorectal (11%) and uter ine (7%) cancers. Cancer is more commonly diagnosed in males than females for all cancer types reported except breast and thyroid cancers. Overall, the number of new cancer cases is expected to be about 5% higher in males (115 800) than females (110 000), and the age- standardized incidence rate (ASIR) is expected to be about 14% higher (557.8 per 100 000 males, 491.2 per 100 000 females). Projected mortality An estimated 83 300 Canadians are expected to die of cancer in 2020 (Table 2). Lung cancer is expected to be the leading cause of cancer death, accounting for more cancer deaths (21 200) than the next 3 leading causes — colorectal, pancreatic and breast — combined (20 100). Along with prostate cancer, these 5 cancers account for more than half (55%) of all expected can cer deaths in Canada. Lung cancer is also expected to be the leading cause of cancer death in males and females, accounting for 25% and 26% of deaths, respectively. Among males, lung is followed by colorectal (12%), prostate (10%) and pancreatic (6%) cancers. Among females, lung is followed by breast (13%), colorectal (11%) and pancreatic (7%) cancers. Overall, the number of cancer deaths is expected to be 12% higher among males (44 100) than females (39 300), whereas the age-standardized mortality rate (ASMR) is expected to be 26% higher (219.7 per 100 000 males, 164.2 per 100 000 females). A higher number of deaths is expected among males than females for each cancer type reported except breast and thyroid. Changes over time Figure 1 shows the ASIR between 1984 and 2020 by sex for the 4 most commonly diagnosed cancers. The ASIR for prostate cancer
- 3. RESEARCH CMAJ | MARCH 2, 2020 | VOLUME 192 | ISSUE 9 E201 increased substantially from 1984 to 1993, then levelled off and has been declining since 2001. Among females, the ASIR for breast cancer rose between 1984 and the early 1990s after which it has fluctuated. Colorectal cancer started to decline among males and females in 2000, and more steeply after 2011. Although lung cancer has been declining since 1990 among males, rates among females started to decline around 2011. Figure 2 shows the ASMR between 1984 and 2020, by sex, for the 5 leading causes of cancer death in Canada. Among males, the ASMR has decreased for lung, prostate and colorectal can cers. Among females, the ASMR has decreased consistently for breast and colorectal cancers, and recently began decreasing for lung cancer. The mortality rate for pancreatic cancer has remained stable. Regional variation Region-specific estimates are provided in supplementary tables and figures. Appendix 1, Supplementary Figure 2, shows the pro jected ASIR and ASMR of all cancers combined by Canadian prov ince and territory in 2020. Estimates for Quebec incidence were not included because a different projection approach was used for Quebec, limiting its comparability to the other jurisdictions. It is estimated that the cancer ASIR and ASMR for 2020 will gener ally be highest in eastern and central Canada and lowest in west ern Canada. Projected estimates of 2020 incidence and mortality for individual cancer types by geographic region are provided in Appendix 3, Supplementary Figure 1, and Appendix 4, Supple mentary Tables 2–5, available at www.cmaj.ca/lookup/suppl/ doi:10.1503/cmaj.191292/-/DC1. Table 1: Projected estimates of new cases and age-standardized incidence rates for cancers in Canada in 2020, by sex Type of cancer No. of new cases ASIR* Total† Males Females In both sexes Males Females All cancers‡ 225 800 115 800 110 000 519.4 557.8 491.2 Lung and bronchus 29 800 15 000 14 800 61.4 64.8 59.3 Breast 27 700 240 27 400 66.9 1.1 128.2 Colorectal 26 900 14 900 12 000 60.5 71.5 50.8 Prostate 23 300 23 300 NA NA 116.7 NA Bladder§ 12 200 9400 2800 25.0 42.0 10.7 Non-Hodgkin lymphoma 10 400 5800 4500 24.4 29.3 20.2 Thyroid 8600 2300 6400 22.5 11.7 33.1 Melanoma 8000 4400 3600 21.8 25.2 19.2 Kidney and renal pelvis 7500 4900 2600 17.3 23.6 11.5 Uterus (body, NOS) 7400 NA 7400 NA NA 35.0 Leukemia 6900 4100 2800 16.5 21.1 12.6 Pancreas 6000 3100 2900 13.0 14.2 11.8 Oral 5400 3700 1650 12.8 18.5 7.5 Stomach 4200 2700 1450 9.4 13.1 6.1 Multiple myeloma 3400 2000 1450 7.8 9.7 6.1 Ovary 3100 NA 3100 NA NA 14.2 Liver 3100 2300 810 6.8 10.6 3.3 Brain/CNS 3000 1700 1350 7.1 8.3 5.9 Esophagus 2400 1850 550 5.7 9.3 2.4 Cervix 1350 NA 1350 NA NA 7.1 Testis 1150 1150 NA NA 6.5 NA Larynx 1150 980 180 2.3 4.1 0.7 Hodgkin lymphoma 1000 570 440 2.6 2.9 2.3 All other cancers 21 800 11 300 10 500 47.5 53.2 43.2 Note: ASIR = age-standardized incidence rate, CNS = central nervous system, NOS = not otherwise specified, NA = not applicable. *Rates exclude those from Quebec. †Column total may not sum to row totals owing to rounding. ‡All cancers excludes nonmelanoma skin cancers (neoplasms, NOS; epithelial neoplasms, NOS; and basal and squamous). §Bladder cancer includes in situ carcinomas.
- 4. RESEARCH E202 CMAJ | MARCH 2, 2020 | VOLUME 192 | ISSUE 9 Interpretation In 2020, a projected 225 800 Canadians will receive a diagnosis of cancer and 83 300 will die of cancer. These estimates are higher than previously reported for 2019,1 which is expected given the growing and aging population.3 In contrast, the decline in age- standardized incidence rates overall shows progress is being made for several leading cancers. For example, the ASIRs for some of the commonly diagnosed cancers are declining, reflecting success in cancer-control activities around primary prevention (e.g., tobacco for lung cancer), as well as changes in detection practices (prostate cancer) and possibly screening (colorectal). In addition, there have been dramatic declines in mortality for these cancers, reflecting not only changes in incidence but also improvements in early detection and treatment. Meanwhile, the lack of progress with pancreatic cancer and the continued increase in the number of cases and deaths expected each year for this and other cancer types shows further efforts in cancer control are still required. Lung cancer remains the most commonly diagnosed cancer and leading cause of death from cancer in Canada. However, improvements have been observed in incidence and mortality in males since the early 1990s, and rates have also started to decline in females.1 These patterns largely reflect past differ ences in tobacco smoking between sexes13 and are similar to what has been reported in the United States.14 An estimated 86% of lung cancers are preventable and 72% are attributable to tobacco smoke,15 providing evidence that there is a lot of room for improvement in prevention. Moreover, with a 5-year net sur vival of only 19%,1,16 further improvements in treatment are para mount for reducing mortality for this disease. Lung cancer screening programs for high-risk populations are also on the horizon in Canada.17 Table 2: Projected estimates of deaths and age-standardized mortality rates for cancers in Canada in 2020, by sex Type of cancer No. of deaths ASMR Total* Males Females Both sexes Males Females All cancers 83 300 44 100 39 300 188 219.7 164.2 Lung and bronchus 21 200 11 000 10 200 47.2 53.4 42.5 Colorectal 9700 5300 4400 21.8 26.4 18.0 Pancreas 5300 2700 2600 12.0 13.5 10.7 Breast 5100 55 5100 11.9 0.3 22.0 Prostate 4200 4200 NA NA 21.8 NA Leukemia 3000 1800 1250 6.9 9.0 5.2 Non-Hodgkin lymphoma 2900 1600 1250 6.5 8.1 5.1 Bladder 2600 1850 720 5.7 9.6 2.8 Brain/CNS 2500 1400 1050 5.8 7.1 4.7 Esophagus 2300 1750 510 5.1 8.6 2.1 Ovary 1950 NA 1950 NA NA 8.3 Stomach 1950 1200 760 4.5 6.0 3.2 Kidney and renal pelvis 1950 1300 680 4.4 6.4 2.8 Multiple myeloma 1600 880 700 3.5 4.4 2.8 Oral 1500 1050 440 3.5 5.3 1.8 Liver† 1450 1150 290 3.2 5.5 1.2 Uterus (body, NOS) 1300 NA 1300 NA NA 5.4 Melanoma 1300 870 450 3.1 4.4 2.0 Cervix 410 NA 410 NA NA 2.0 Larynx 400 330 75 0.9 1.6 0.3 Thyroid 230 110 130 0.5 0.5 0.5 Hodgkin lymphoma 100 65 40 0.2 0.3 0.2 Testis 35 35 NA NA 0.2 NA All other cancers 10 400 5400 5000 23.5 27.3 20.5 Note: ASMR = age-standardized mortality rate, CNS = central nervous system, ICD-10 = International Statistical Classification of Diseases and Related Health Problems, 10th Revision, NA = not applicable, NOS = not otherwise specified. *Column total may not sum to row totals owing to rounding. †Liver cancer mortality was underestimated because deaths from liver cancer, unspecified (ICD-10 code C22.9) were excluded.
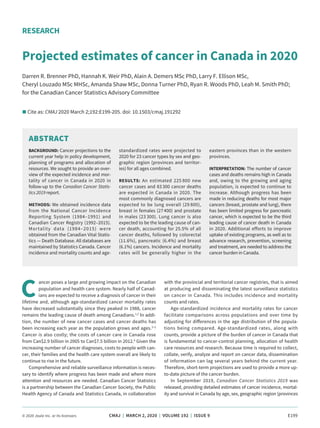
- 5. RESEARCH CMAJ | MARCH 2, 2020 | VOLUME 192 | ISSUE 9 E203 0 20 40 60 80 100 120 140 160 180 200 1984 1989 1994 1999 2004 2009 2014 2019 Age-standardizedincidencerateper100000 Year Lung (male) Colorectal (male) Prostate (male) Lung (female) Colorectal (female) Breast (female) Figure 1: Age-standardized incidence rates (ASIRs) for selected cancers, in Canada (excluding Quebec), 1984–2020, by sex. Shading indicates projected data. 0 20 40 60 80 100 120 1984 1989 1994 1999 2004 2009 2014 2019 Age-standardizedmortalityrateper100000 Year Lung (male) Colorectal (male) Prostate (male) Pancreas (male) Lung (female) Colorectal (female) Breast (female) Pancreas (female) Figure 2: Age-standardized mortality rates (ASMRs) for selected cancers in Canada, 1984–2020, by sex. Shading indicates projected data.
- 6. RESEARCH E204 CMAJ | MARCH 2, 2020 | VOLUME 192 | ISSUE 9 In 2020, breast cancer is expected to be the second most com monly diagnosed cancer in Canada. Patterns in historical incidence rates for breast cancer in females likely reflect, in part, changes in screening. For example, the increase in the incidence of breast can cer in females between 1984 and the early 1990s may be attributable to increased opportunistic mammography screening that was done before organized screening programs were implemented in Canada. Since then, incidence rates have fluctuated, although a small, statis tically significant decline was reported to 2015.1 Although patterns in incidence remain somewhat varied, there has been a dramatic decline in the female mortality rate for breast cancer of about 49% since its peak — from 43 per 100 000 population in 19861 to a pro jected 22 per 100 000 population in 2020. Other high-income coun tries, including the US, United Kingdom and Australia, have also seen substantial decreases in the female mortality rate for breast cancer since the mid-to-late 1980s.18 These improvements have been largely attributedto progress intreatment,19,20 inadditiontoearlydetection. Colorectal cancer is expected to be the third most commonly diagnosed cancer in Canada, whereas, as recently as 2017, it was estimated to be second.21 Colorectal cancer mortality rates are declining. This is likely due, in part, to increased screening for the disease, which can identify treatable precancerous polyps and earlier-stage disease. Between 2007 and 2016, the Yukon territory and every province in Canada except Quebec implemented org anized screening programs for colorectal cancer.22 As these pro grams get more established, it is hoped that the once-low partici pation rates will improve, and incidence and mortality rates will decline further. The decline in incidence rates for colorectal can cer is believed to be confined to older adults, who are at greatest risk. Although incidence is lowest among adults under 50 years of age, studies have repeatedly shown rates are increasing in adults in this younger age group in Canada and elsewhere.23–25 Whether this pattern holds for colorectal cancer mortality as well has yet to be established in Canada. Prostate cancer is projected to remain the most commonly diag nosed cancer and the second leading cause of cancer death among Canadian males. Trends in incidence for prostate cancer have largely mirrored patterns in use of prostate-specific antigen (PSA) testing in Canada.1,26 Since the US Preventive Services Task Force advised against PSA screening in men over age 75 years in 2008, and then in asymptomatic men of all ages in 2011, there has been a sub stantial decline in prostate cancer incidence rates in both Canada and the US.1,27,28 Canada released a similar guideline in 2014.29 Pros tate cancer mortality rates have been steadily declining since the mid-1990s, reflecting improvements in treatment.20,30 While mortality rates continue to decline for the 4 most com monly diagnosed cancers, the rate has remained stable for pancre atic cancer. As a result, the relative burden of pancreatic cancer is increasing. Specifically, the number of deaths caused by pancreatic cancer is expected to surpass breast cancer as the third leading cause of cancer death in Canada. This change in ranking was esti mated to have occurred in 2019.1 Pancreatic cancer has also been reported to be the third leading cause of cancer death in the US.31 Changes in mortality rates are perhaps the best measure of prog ress in cancer control. The improvements in mortality for the other major cancers are the result of different combinations of prevention, earlier detection and, perhaps most notably, improvements in treat ment.20 Progress in the delivery of traditional surgical and chemoradi ation therapy techniques have continued to improve outcomes, as evidenced by increased survival rates for most cancers.1,16 In addition, manycommonlydiagnosedcancersarenowtreatedwithindividually targeted therapies for specific tumour characteristics that can further improve outcomes, often with fewer adverse effects compared with traditional chemotherapies.32–35 However, this type of progress has beenlimitedforpancreaticcancer,whichcontinuestohaveanexcep tionally low 5-year net survival of 8%.1,16 Clearly, this is a cancer for whichfurtherresearchisneededtoimprovetherapeuticoutcomes. Limitations We provide projected estimates, which give an indication of what might be expected if the analytic assumptions were to hold true over theprojectedtimeframeandmustbeinterpretedwithcaution. The data used for most provinces and territories are based on data to 2015, but incidence data for Quebec, the second most populous province in Canada, are only to 2010. Therefore, addi tional assumptions were required for these projections. Notably, the method we used to project Quebec incidence for 2011–2020 assumes that the ratio of rates between Quebec and the rest of Canada remained constant over time, which may not be the case. Data for Canada’s 3 territories were included in the national estimates. However, owing to their small population sizes and the resulting imprecision of the projections, we did not report cancer-specific data for the territories. Conclusion Continued declines in the age-standardized incidence and mortal ity rates for many cancers show that progress is being made in pre venting and treating cancer. This is especially true for lung cancer, yet it remains the leading cause of cancer incidence and death in Canada, underscoring the need for stronger tobacco control pol icies and improvements in early detection and treatment. The declining mortality rates for breast, colorectal and prostate cancers also reflect continued success in prevention, screening and treat ment. Despite these positive findings, a lack of progress with pan creatic and other cancers highlights the need for further research and innovative treatment options. The overall burden of cancer remains high in Canada and, owing to the growing and aging population, the number of cases and deaths will likely continue to increase. Additional efforts to improve uptake of existing programs, as well as to advance research, prevention, screening and treatment, are needed. References 1. Canadian Cancer Statistics Advisory Committee. Canadian cancer statistics 2019. Toronto: Canadian Cancer Society; 2019. Available: www.cancer.ca/~/ media/cancer.ca/CW/publications/Canadian%20Cancer%20Statistics/Canadian -Cancer-Statistics-2019-EN.pdf (accessed 2020 Jan. 17). 2. Table 13-10-0394-01: Leading causes of death, total population, by age group. Ottawa: Statistics Canada. Available: www150.statcan.gc.ca/t1/tbl1/en/tv. action?pid=1310039401 (accessed 2020 Jan. 17). 3. Canadian Cancer Society’s Advisory Committee on Cancer Statistics. Canadian can- cer statistics 2015. Toronto: Canadian Cancer Society; 2015. Available: www.cancer .ca/~/media/cancer.ca/CW/cancer%20information/cancer%20101/Canadian%20 cancer%20statistics/Canadian-Cancer-Statistics-2015-EN.pdf?la=en (accessed 2020 Jan. 17).
- 7. RESEARCH CMAJ | MARCH 2, 2020 | VOLUME 192 | ISSUE 9 E205 4. Xie L, Semenciw R, Mery L. Cancer incidence in Canada: trends and projections (1983–2032). Health Promot Chronic Dis Prev Can 2015;35(Suppl 1):2-186. 5. Rahib L, Smith BD, Aizenberg R, et al. Projecting cancer incidence and deaths to 2030: the unexpected burden of thyroid, liver, and pancreas cancers in the United States. Cancer Res 2014;74:2913-21. 6. de Oliveira C, Weir S, Rangrej J, et al. The economic burden of cancer care in Canada: a population-based cost study. CMAJ Open 2018;6:E1-10. 7. Canadian Cancer Registry (CCR). Ottawa: Statistics Canada; modified 2019 Jan. 28. Available: www23.statcan.gc.ca/imdb/p2SV.pl?Function=getSurvey&SDDS=3207 (accessed 2020Jan. 17). 8. Vital statistics: death database (CVSD). Ottawa: Statistics Canada; modified 2019 Nov. 25. Available: www23.statcan.gc.ca/imdb/p2SV.pl?Function=getSurvey &SDDS=3233 (accessed 2020 Jan. 17). 9. Annual demographic estimates: Canada, provinces and territories 2016. Ottawa: Statistics Canada; 2017. Cat no 91-215-X. Available: www.statcan.gc.ca/ pub/91-215-x/91-215-x2016000-eng.pdf (accessed 2018 Dec. 15). 10. Table 17-10-0005-01: Population estimates on July 1st, by age group and sex. Ottawa: Statistics Canada. Available: www5.statcan.gc.ca/cansim/a26?lang =eng&retrLang=eng&id=0510001&paSer=&pattern=&stByVal=1&p1=1&p2=31& tabMode=dataTable&csid= (accessed 2018 Dec. 15). 11. Population projections for Canada (2013 to 2063), provinces and territories (2013 to 2038. Ottawa: Statistics Canada; 2010. Cat No 91-520-X. Available: www150.statcan .gc.ca/n1/pub/91-520-x/91-520-x2014001-eng.htm (accessed March 2019). 12. Qiu Z, Hatcher J.; Team C-PW. CANPROJ— The R package of cancer projection methods based on generalized linear models for age, period, and/or cohort. Technique Report for Cancer Projections Network (C-Proj) Alberta. Edmonton: Alberta Health Services; 2011. 13. Daily smokers (indicator). Paris (FR): Organisation for Economic Co-operation andDevelopment(OECD).Available:https://data.oecd.org/healthrisk/daily-smokers .htm (accessed 2010 Jan. 17). 14. Cronin KA, Lake AJ, Scott S, et al. Annual report to the nation on the status of cancer, Part I: national cancer statistics. Cancer 2018;124:2785-800. 15. Percentage of cancers that are preventable in Canada. Canadian Population Attributable Risk of Cancer (ComPARe); 2019. Available: https://prevent.cancer.ca /wp-content/uploads/2019/05/CMPR_1pgr_PctCncrsPrev-CA-EN.pdf (accessed 2020 Jan. 17). 16. Ellison LF. Progress in net cancer survival in Canada over 20 years. Health Rep 2018;29:10-8. 17. Lung cancer screening in Canada: environmental scan. Toronto: Canadian Partner ship Against Cancer; 2018, revised 2019. Available: https://s22457.pcdn.co/wp -content/uploads/2019/04/Lung-Cancer-Screening-Environmental-Scan_EN_2018 _final.pdf (accessed 2020 Jan. 17). 18. Mortality from breast cancer: age-standardised rate (World), all ages. Lyon (FR): International Agency for Research on Cancer (IARC); 2010. Available: www-dep.iarc.fr/WHOdb/Graph4p.asp?cancer%5B%5D=92&female=2&country %5B%5D=5020&country%5B%5D=2090&country%5B%5D=4308&country%5B %5D=2450&sYear=1950&eYear=2020&stat=3&age_from=1&age_to=18&orientation =1&window=1&grid=1&line=2&moving=1&scale=0&submit=%A0%A0%A0Execute %A0%A0%A0 (accessed 2020 Jan. 17). 19. Shields M, Wilkins K. An update on mammography use in Canada. Health Rep 2009;20:7-19. 20. Edwards BK, Brown ML, Wingo PA, et al. Annual report to the nation on the sta tus of cancer, 1975–2002, featuring population-based trends in cancer treat ment. J Natl Cancer Inst 2005;97:1407-27. 21. Canadian Cancer Society’s Advisory Committee on Cancer Statistics. Canadian cancer statistics 2017. Special topic: pancreatic cancer. Toronto: Canadian Can cer Society; 2017. Available: www.cancer.ca/~/media/cancer.ca/CW/cancer% 20information/cancer%20101/Canadian%20cancer%20statistics/Canadian-Cancer -Statistics-2017-EN.pdf (accessed 2020 Jan. 17). 22. Colorectal cancer screening in Canada: monitoring and evaluation of quality indicators — results report, 2013 to 2014. Toronto: Canadian Partnership Against Cancer; 2017. 23. Austin H, Henley SJ, King J, et al. Changes in colorectal cancer incidence rates in young and older adults in the United States: what does it tell us about screening. Cancer Causes Control 2014;25:191-201. 24. Brenner DR, Ruan Y, Shaw E, et al. Increasing colorectal cancer incidence trends among younger adults in Canada. Prev Med 2017;105:345-9. 25. Brenner DR, Heer E, Sutherland RL, et al. National trends in colorectal cancer inci denceamongolderandyoungeradultsinCanada.JAMANetwOpen2019;2:e198090. 26. LeBlanc AG, Demers A, Shaw A. Recent trends in prostate cancer in Canada. Health Rep 2019;30:12-7. 27. Siegel RL, Miller KD, Jemal A. Cancer statistics, 2018. CA Cancer J Clin 2018;68:7-30. 28. Lin K, Croswell JM, Koenig H, et al. Prostate-specific antigen-based screening for prostate cancer: an evidence update for the U.S. Preventive Services Task Force. In: U.S. Preventive Services Task Force Evidence Syntheses, formerly Sys- tematic Evidence Reviews. Rep No 12-05160-EF-1. Rockville (MD): Agency for Healthcare Research and Quality (US); 2011. 29. Bell N, Connor Gorber S, Shane A, et al.; Canadian Task Force on Preventive Health Care. Recommendations on screening for prostate cancer with the prostate-specific antigen test. CMAJ 2014;186:1225-34. 30. James ND, Spears MR, Sydes MR. Abiraterone in metastatic prostate cancer. N Engl J Med 2017;377:1696-7. 31. Siegel RL, Miller KD, Jemal A. Cancer statistics, 2019. CACancerJClin 2019;69:7-34. 32. Stinchcombe TE. Targeted therapies for lung cancer. Cancer Treat Res 2016;170: 165-82. 33. Masoud V, Pagès G. Targeted therapies in breast cancer: new challenges to fight against resistance. World J Clin Oncol 2017;8:120-34. 34. Price TJ, Tang M, Gibbs P, et al. Targeted therapy for metastatic colorectal can cer. Expert Rev Anticancer Ther 2018;18:991-1006. 35. Crawford ED, Heidenreich A, Lawrentschuk N, et al. Androgen-targeted ther apy in men with prostate cancer: evolving practice and future considerations. Prostate Cancer Prostatic Dis 2019;22:24-38. Competing interests: None declared. This article has been peer reviewed. Affiliations: Departments of Oncology and Community Health Sciences (Brenner), Cumming School of Medicine, University of Calgary, Calgary, Alta.; Division of Cancer Prevention and Control (Weir), Centers for Disease Control and Prevention, Atlanta, Ga.; Centre for Surveillance and Applied Research (Demers, Shaw), Public Health Agency of Canada; Centre for Population Health Data (Ellison), Statistics Canada, Ottawa, Ont.; Data Link age and Integration (Louzado), Canadian Partnership Against Cancer, Toronto, Ont.; Population Oncology (Turner), CancerCare Manitoba, Winni peg, Man.; Population Oncology (Woods), BC Cancer, Vancouver, BC; Can adianCancerSociety(Smith),St.John’s,N.L. Contributors: Darren Brenner and Hannah Weir drafted the article. Alain Demers analyzed the data. All of the authors contributed sub stantially to the conception and design of the work, revised it crit ically for important intellectual content, gave final approval of the version to be published and agreed to be accountable for all aspects of the work. Funding: This work was conducted through a partnership between the Canadian Cancer Society, the Public Health Agency of Canada and Statis tics Canada. The Public Health Agency of Canada funded the translation of this work into French. The French version will be posted at cmaj.ca once it is available. Copyright: This is an Open Access article distributed in accordance with the terms of the Creative Commons Attribution (CC BY 4.0) license, which permits others to distribute, remix, adapt and build upon this work, for commercial use, provided the original work is properly cited. See: http://creativecommons.org/licenses/by/4.0/. Data sharing: Data from the Canadian Cancer Registry and Canadian Vital Statistics Death Database are available in Statistics Canada’s Research Data Centres (RDCs). Access to RDCs is granted to researchers with an approved project who have undergone a security check and have become deemed employeesofStatisticsCanada.MoredetailsabouttheRDCapplicationpro cessandguidelinesareavailableatwww.statcan.gc.ca/eng/rdc/process. Disclaimer: The findings and conclusions in this report are those of the authors and do not necessarily represent the official positions of the Centers for Disease Control and Prevention, the Canadian Cancer Society, the Public Health Agency of Canada, Statistics Canada or the other affiliated organizations. Accepted: Jan. 27, 2020 Correspondence to: Leah Smith, leah.smith@cancer.ca