1) Pell grant recipients made up approximately 25% of the incoming freshman class in 2006 and were more likely to be minorities, first-generation students, and those with lower SAT scores and high school GPAs.
2) About 33% of students received a Pell grant at some point in their first four years, with higher representation of disadvantaged groups.
3) Only 16-19% of students received a Pell grant all four years of college. These students had lower academic profiles on average than 4-year non-recipients.
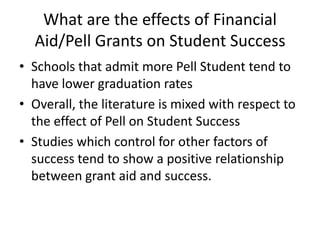
4) Pell recipients showed slightly lower first-year persistence rates but the effect disappeared after controlling for academic factors. Graduation rates were 8-10% lower