Download to read offline

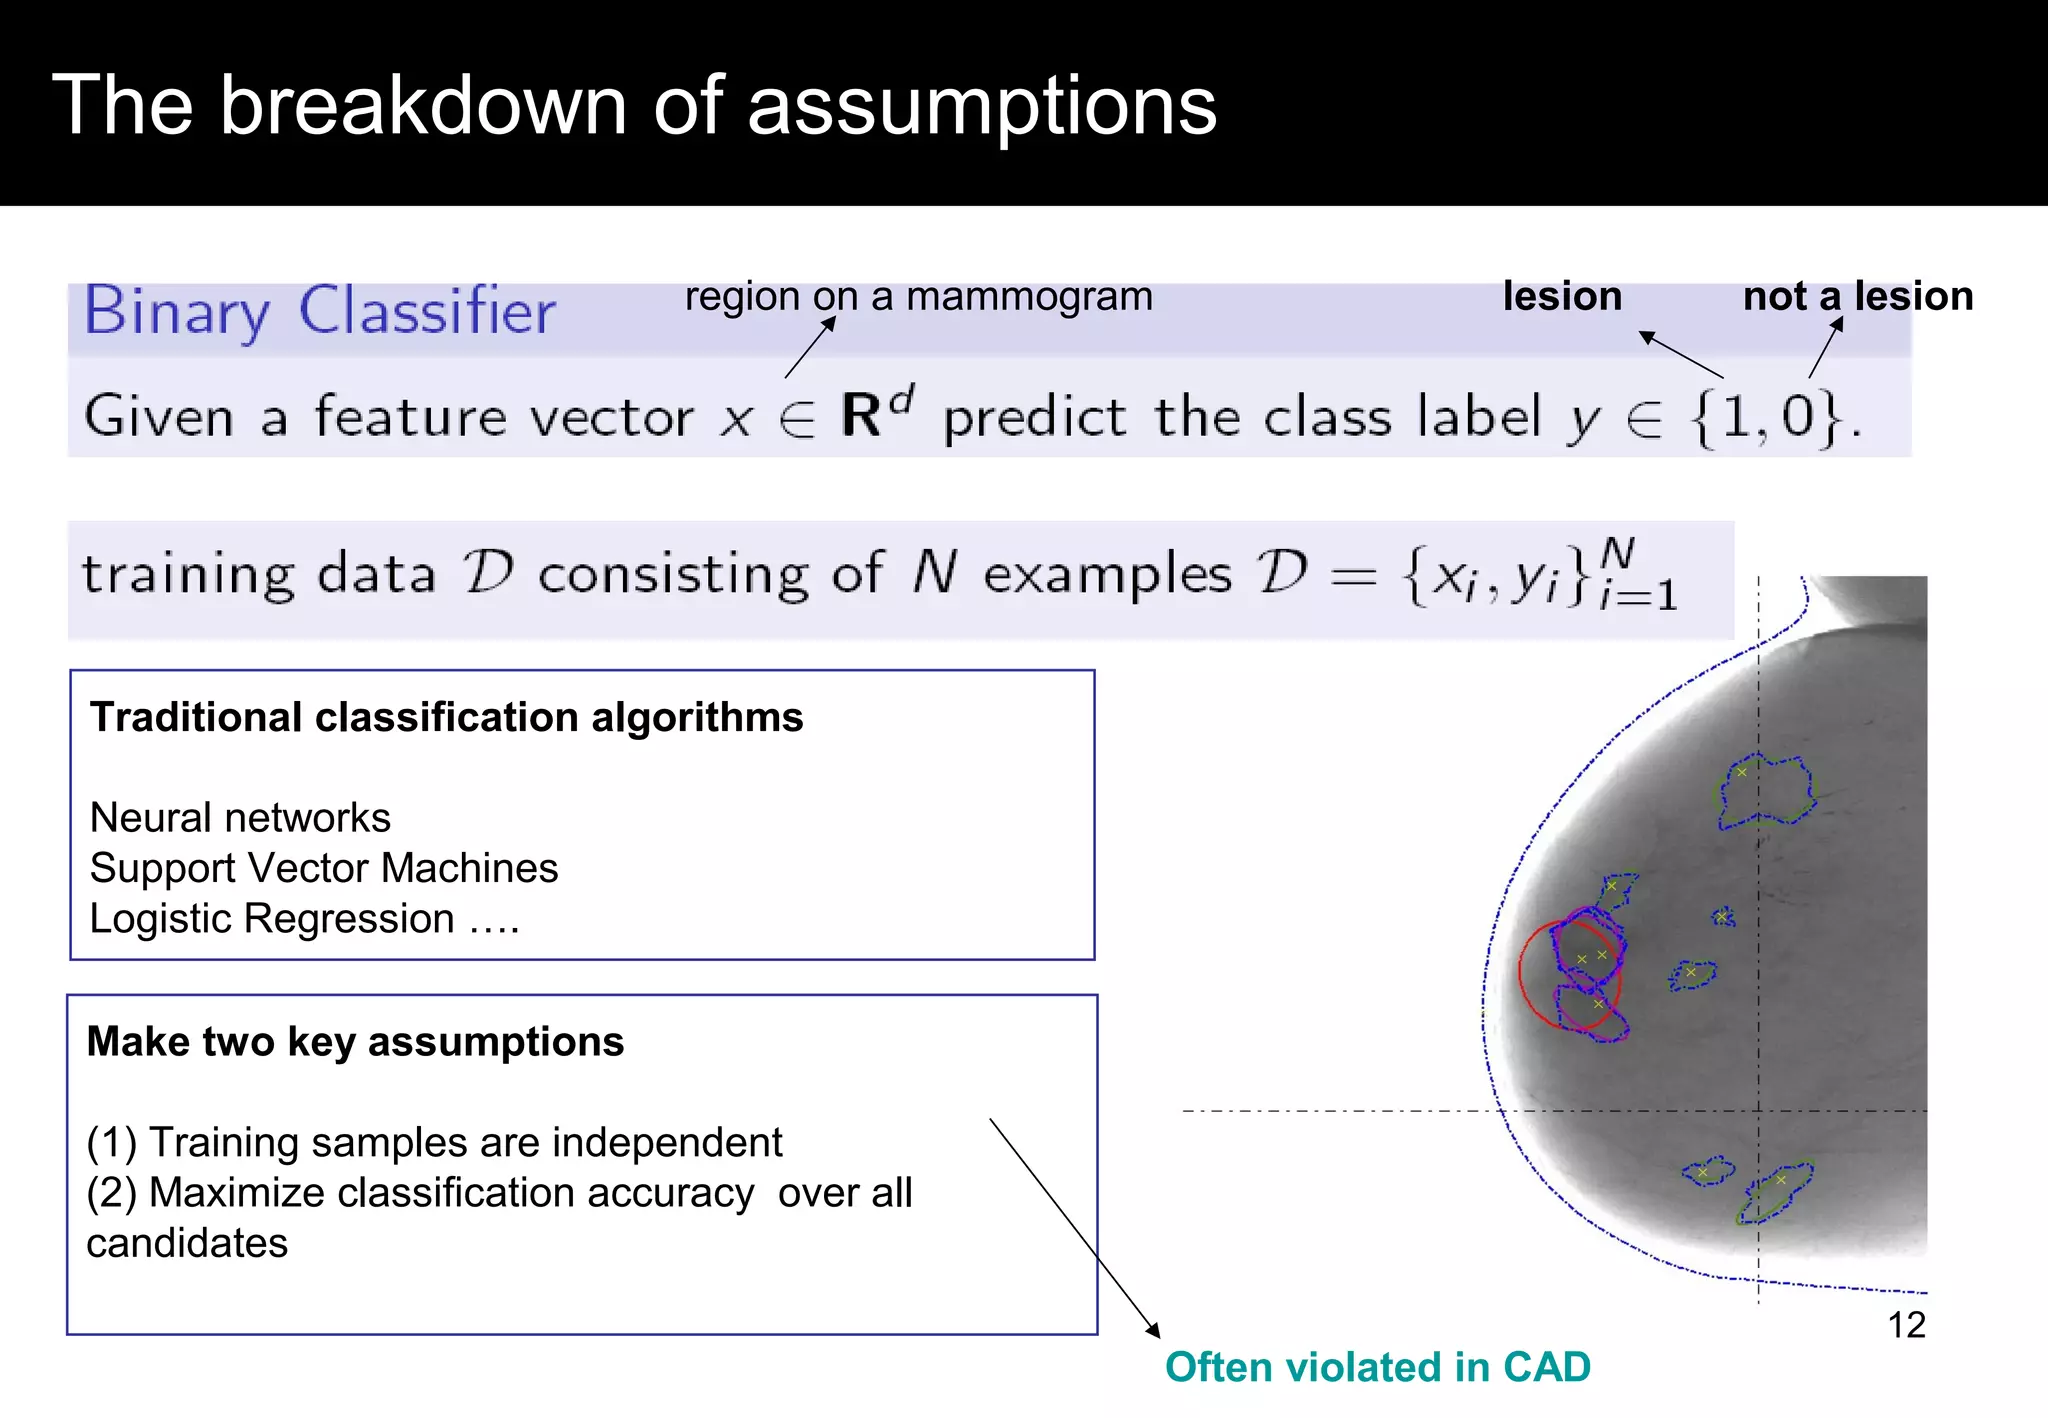
![Typical CAD architecture
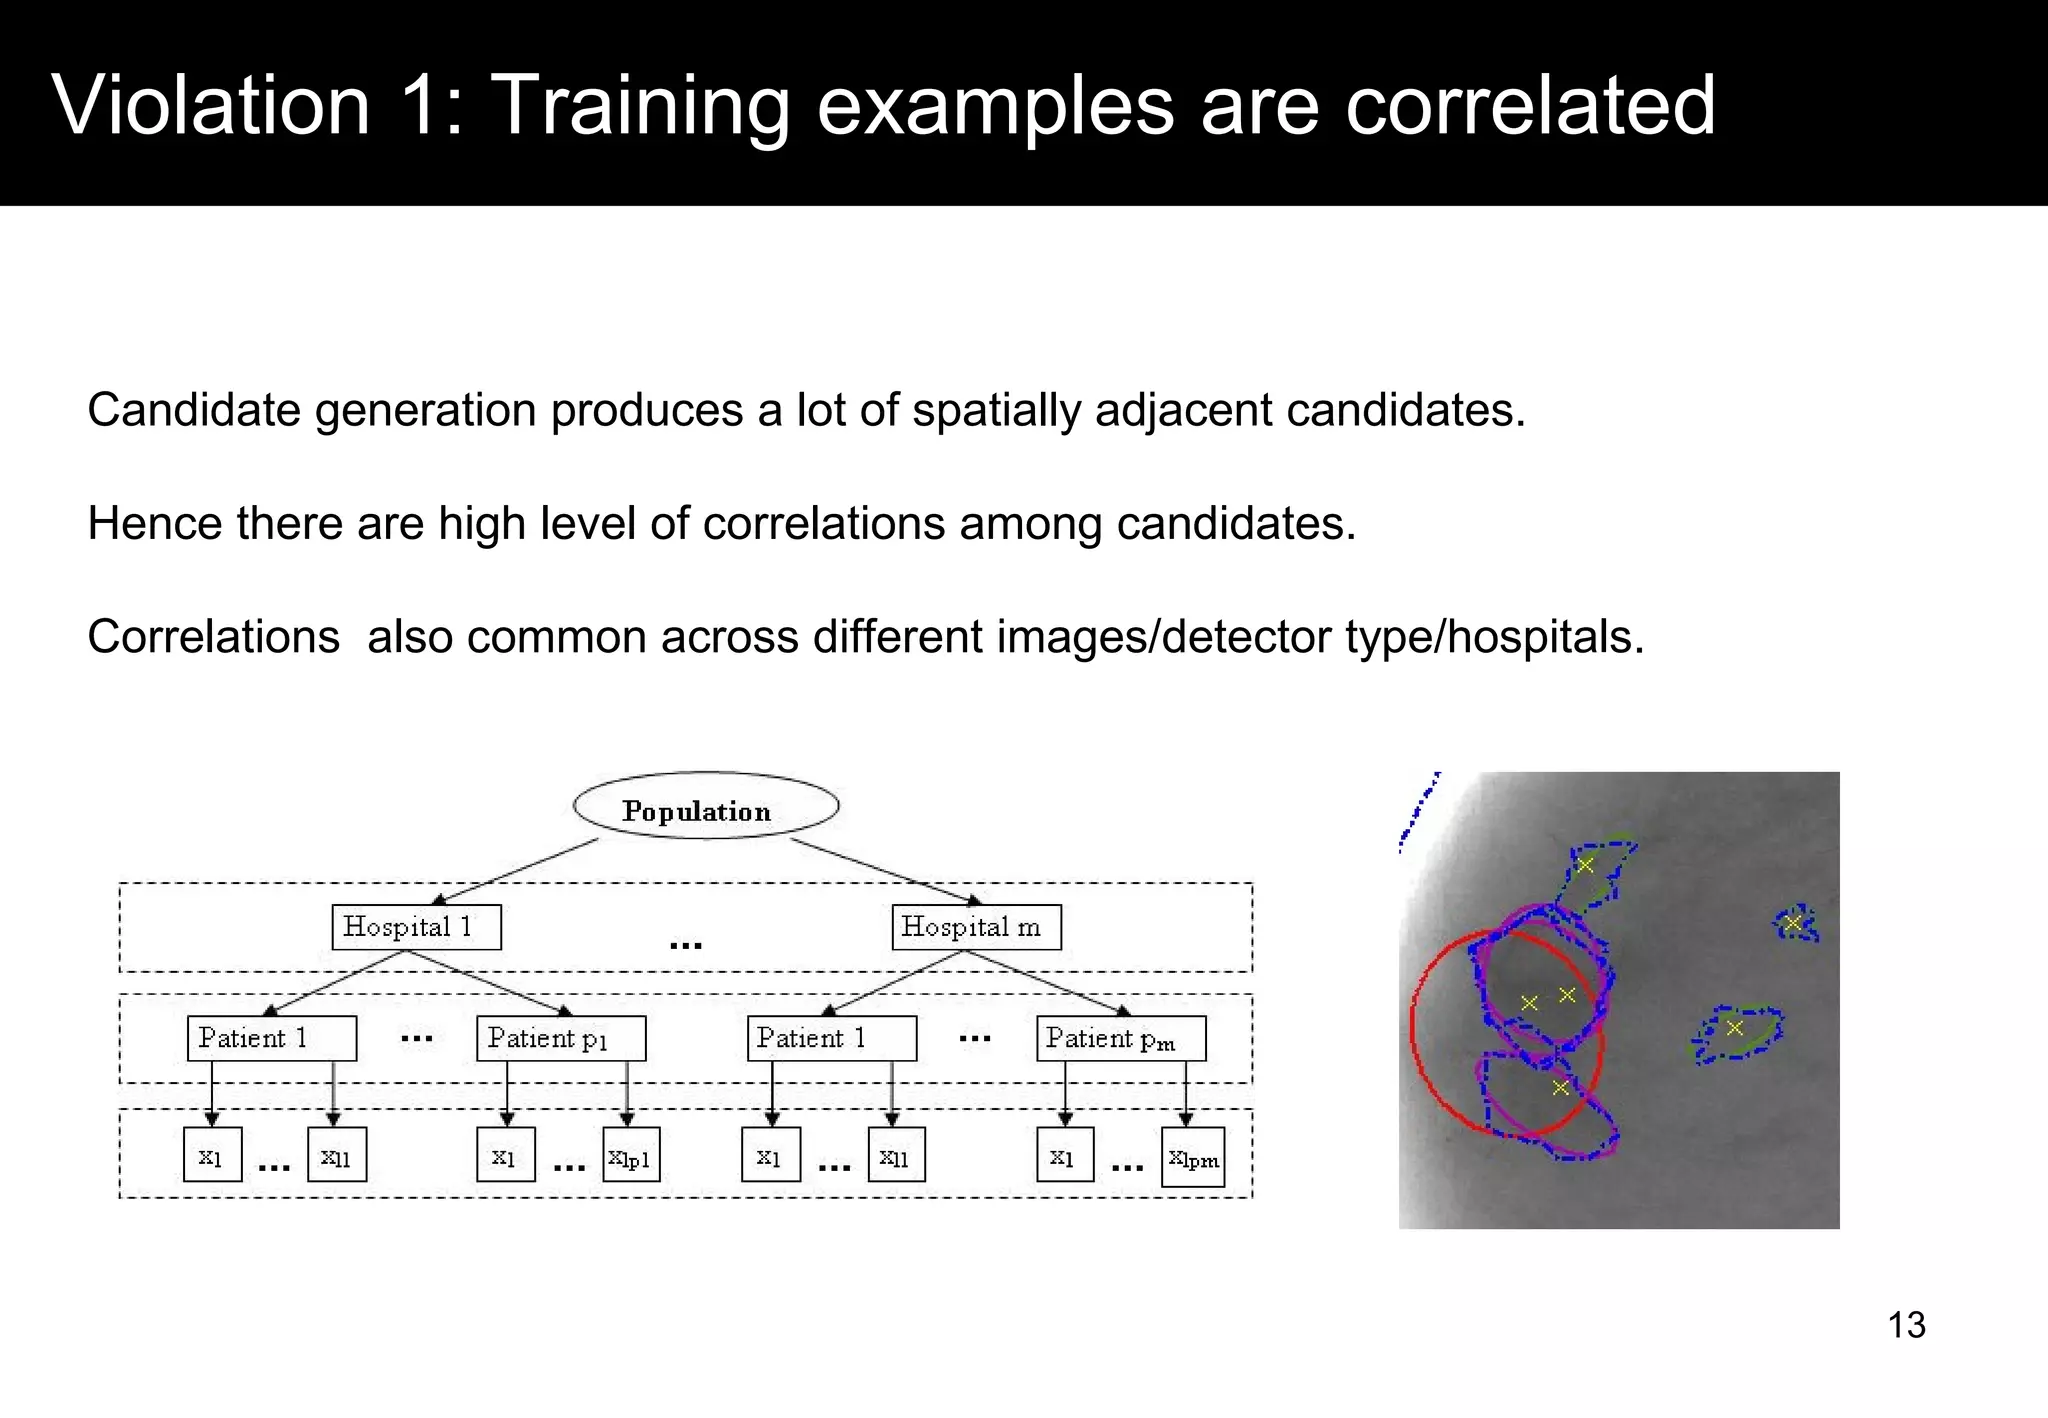
Candidate Generation
Feature Computation
Classification
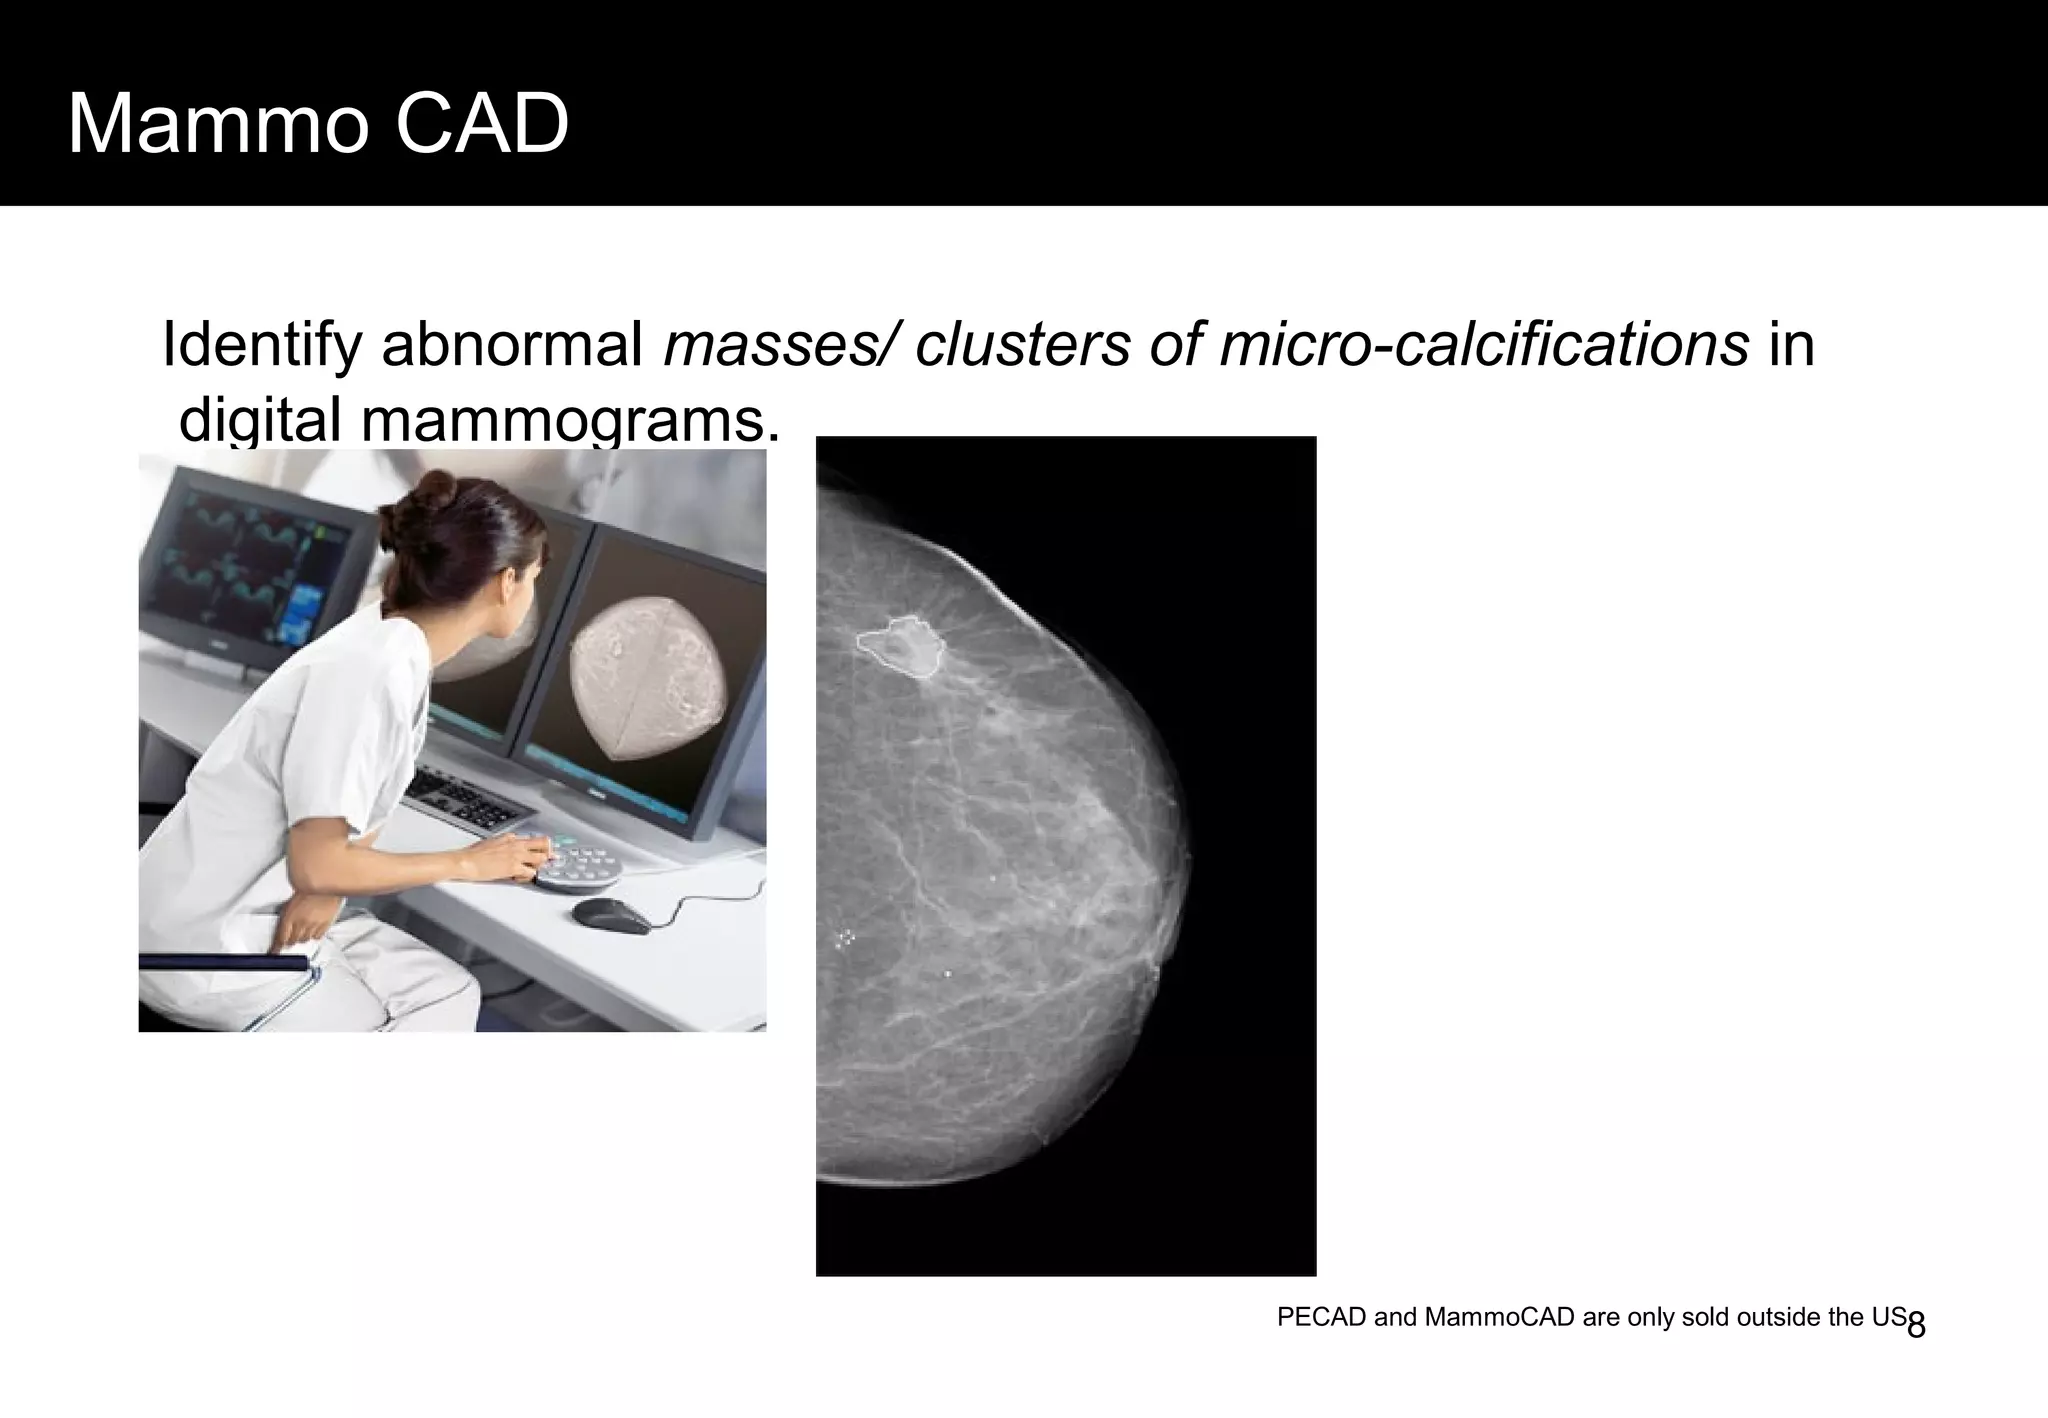
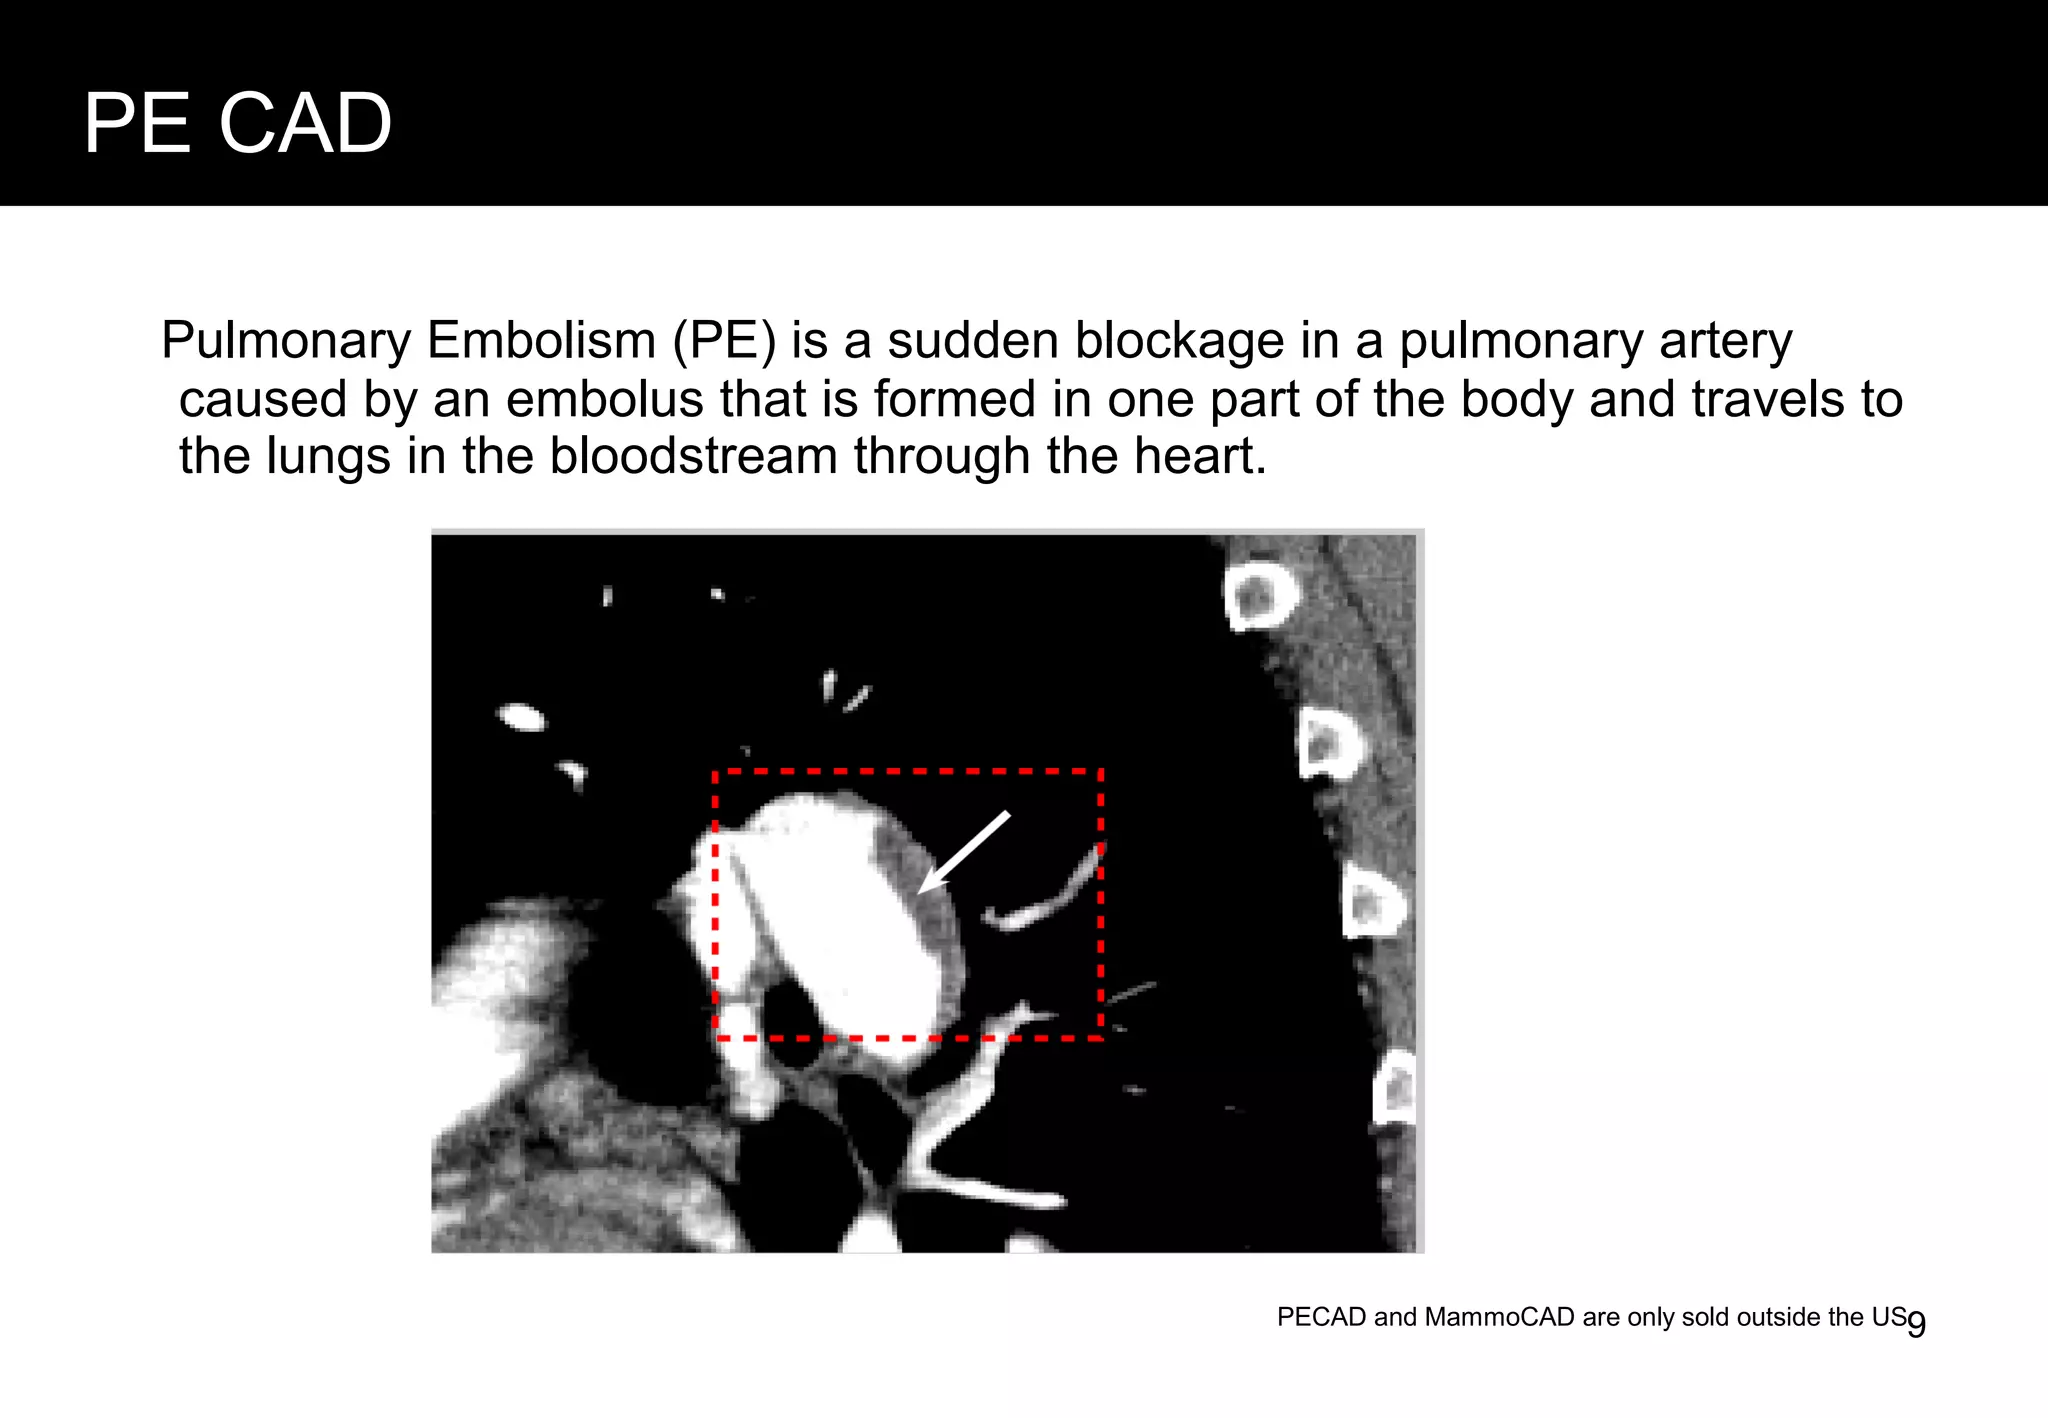
Image [ X-ray | CT scan | MRI ]
Location of lesions
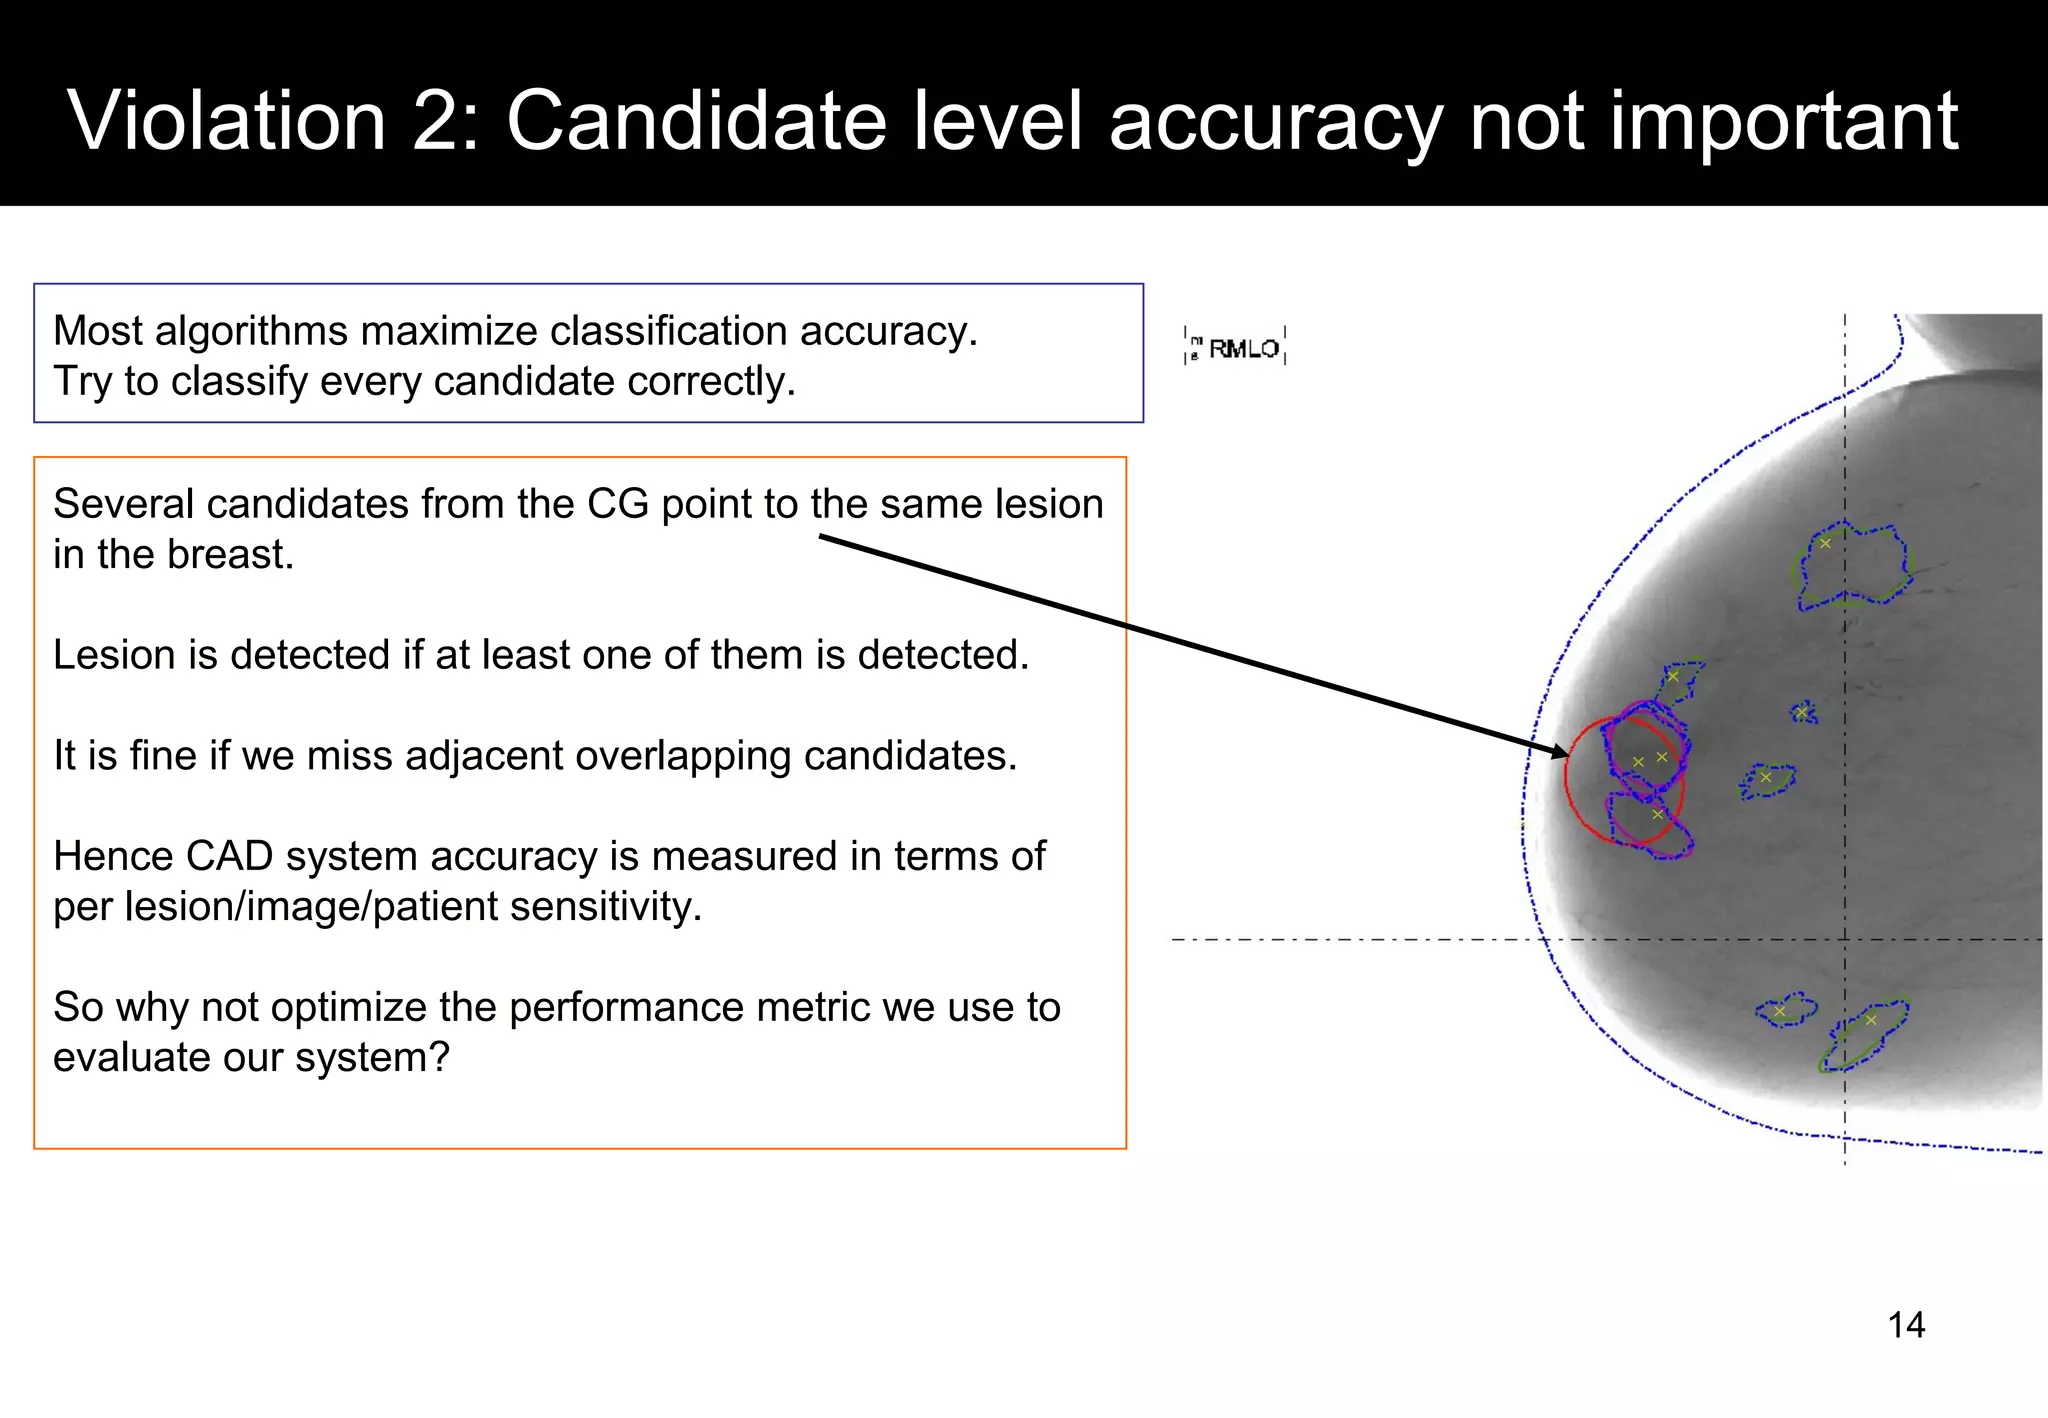
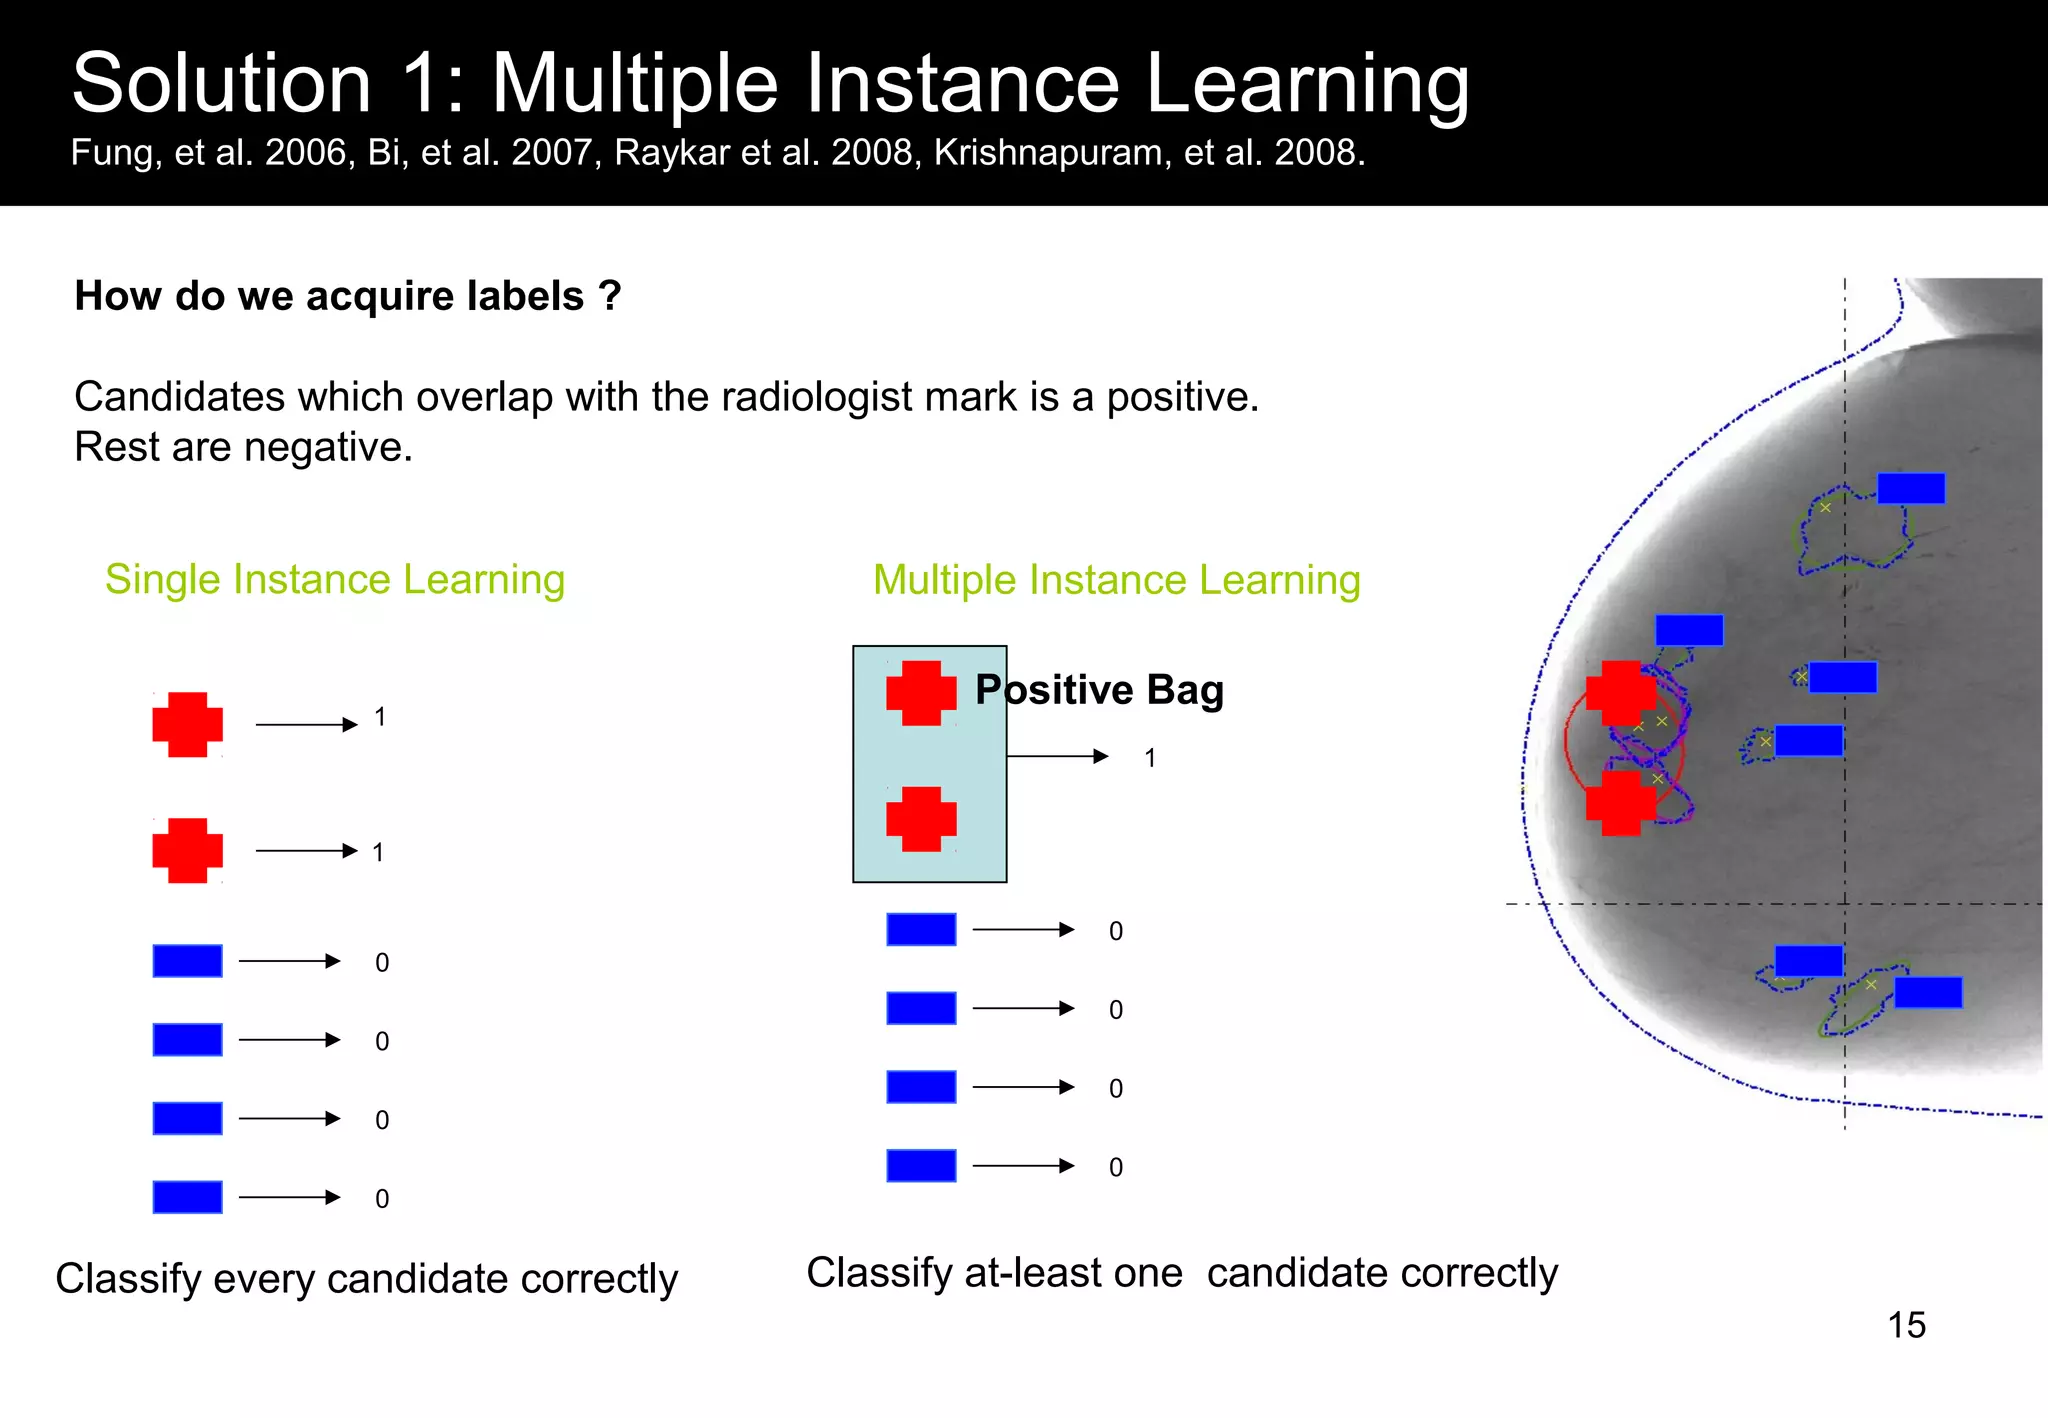
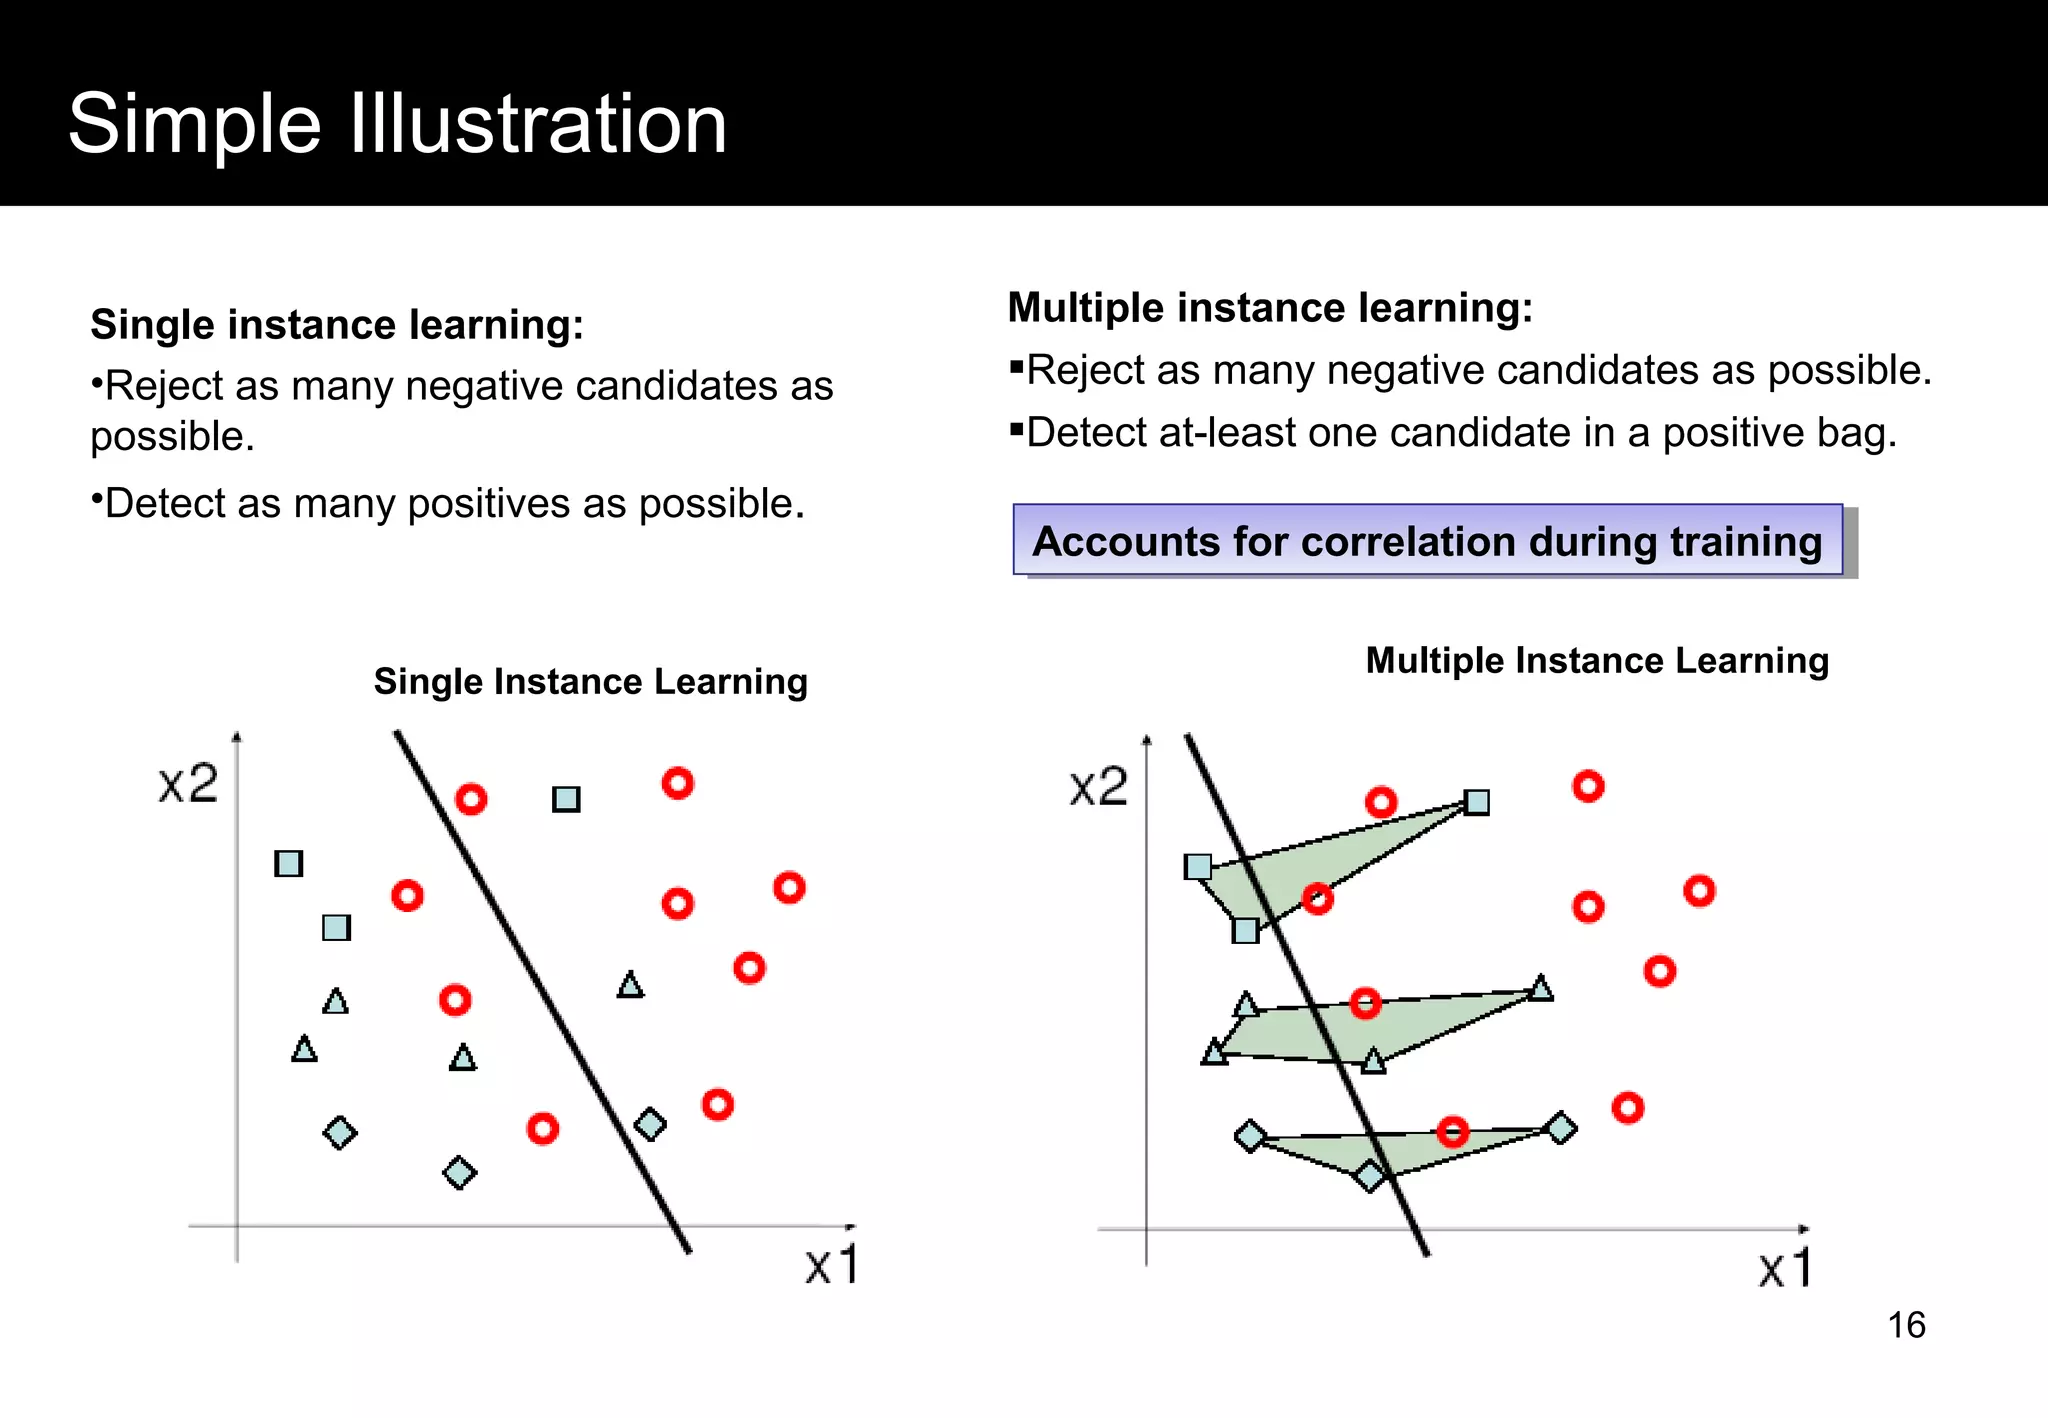
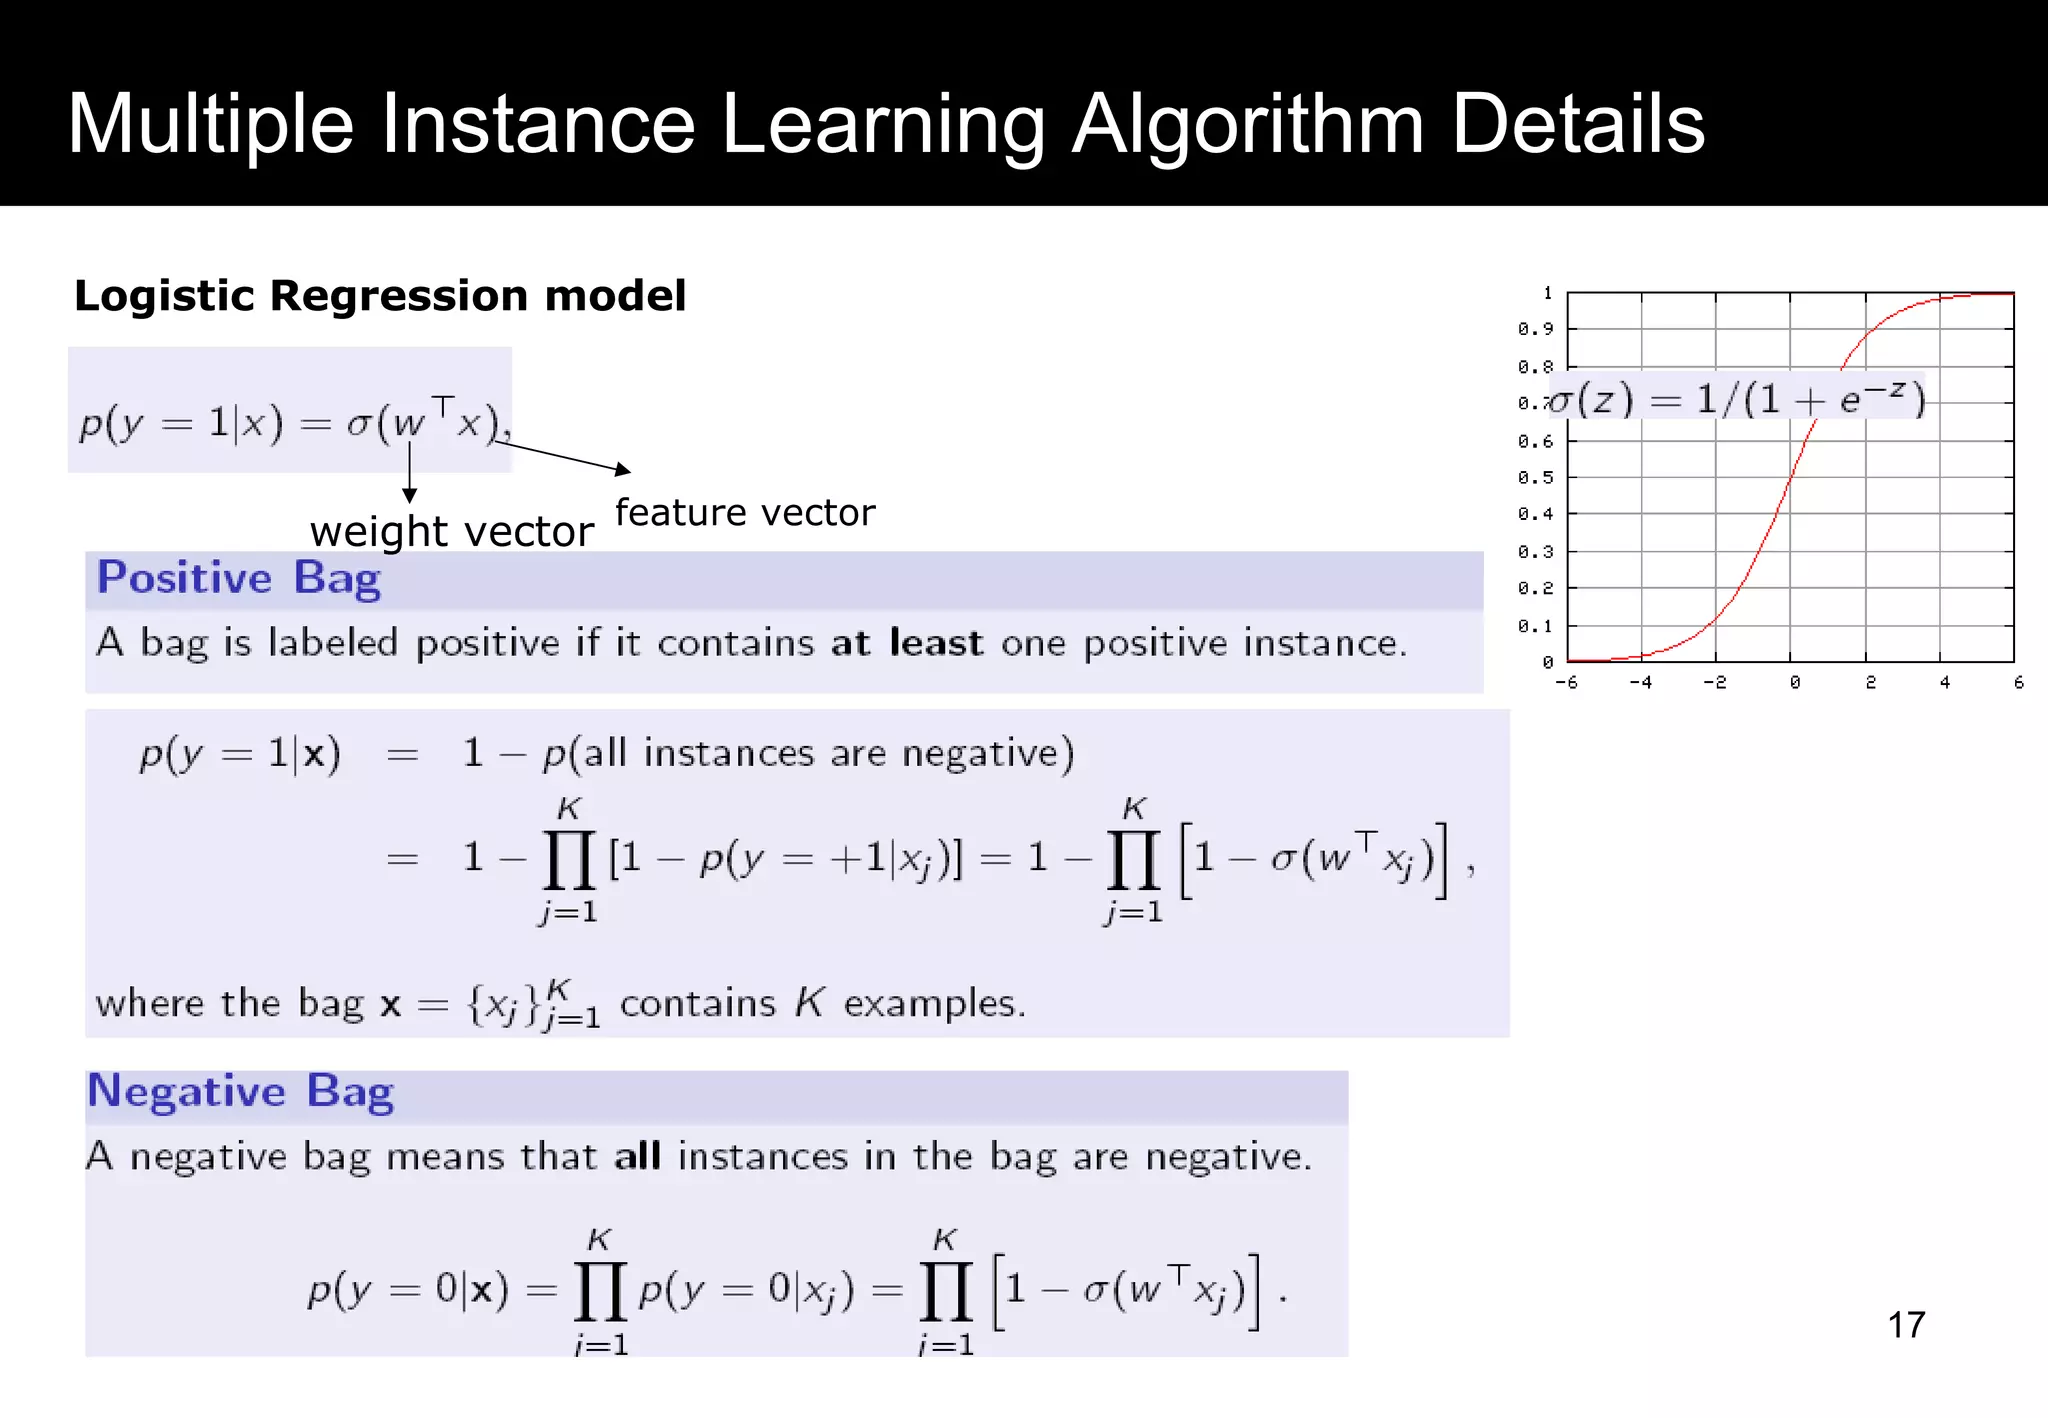
Focus of the current talk
Potential candidates
Lesion
> 90% sensitivity
60-300 FP/image
> 80% sensitivity
2-5 FP/image
10](https://image.slidesharecdn.com/d77eda1e-9269-4323-a3e3-7d7f43201624-150112095632-conversion-gate02/75/CAD-v2-10-2048.jpg)


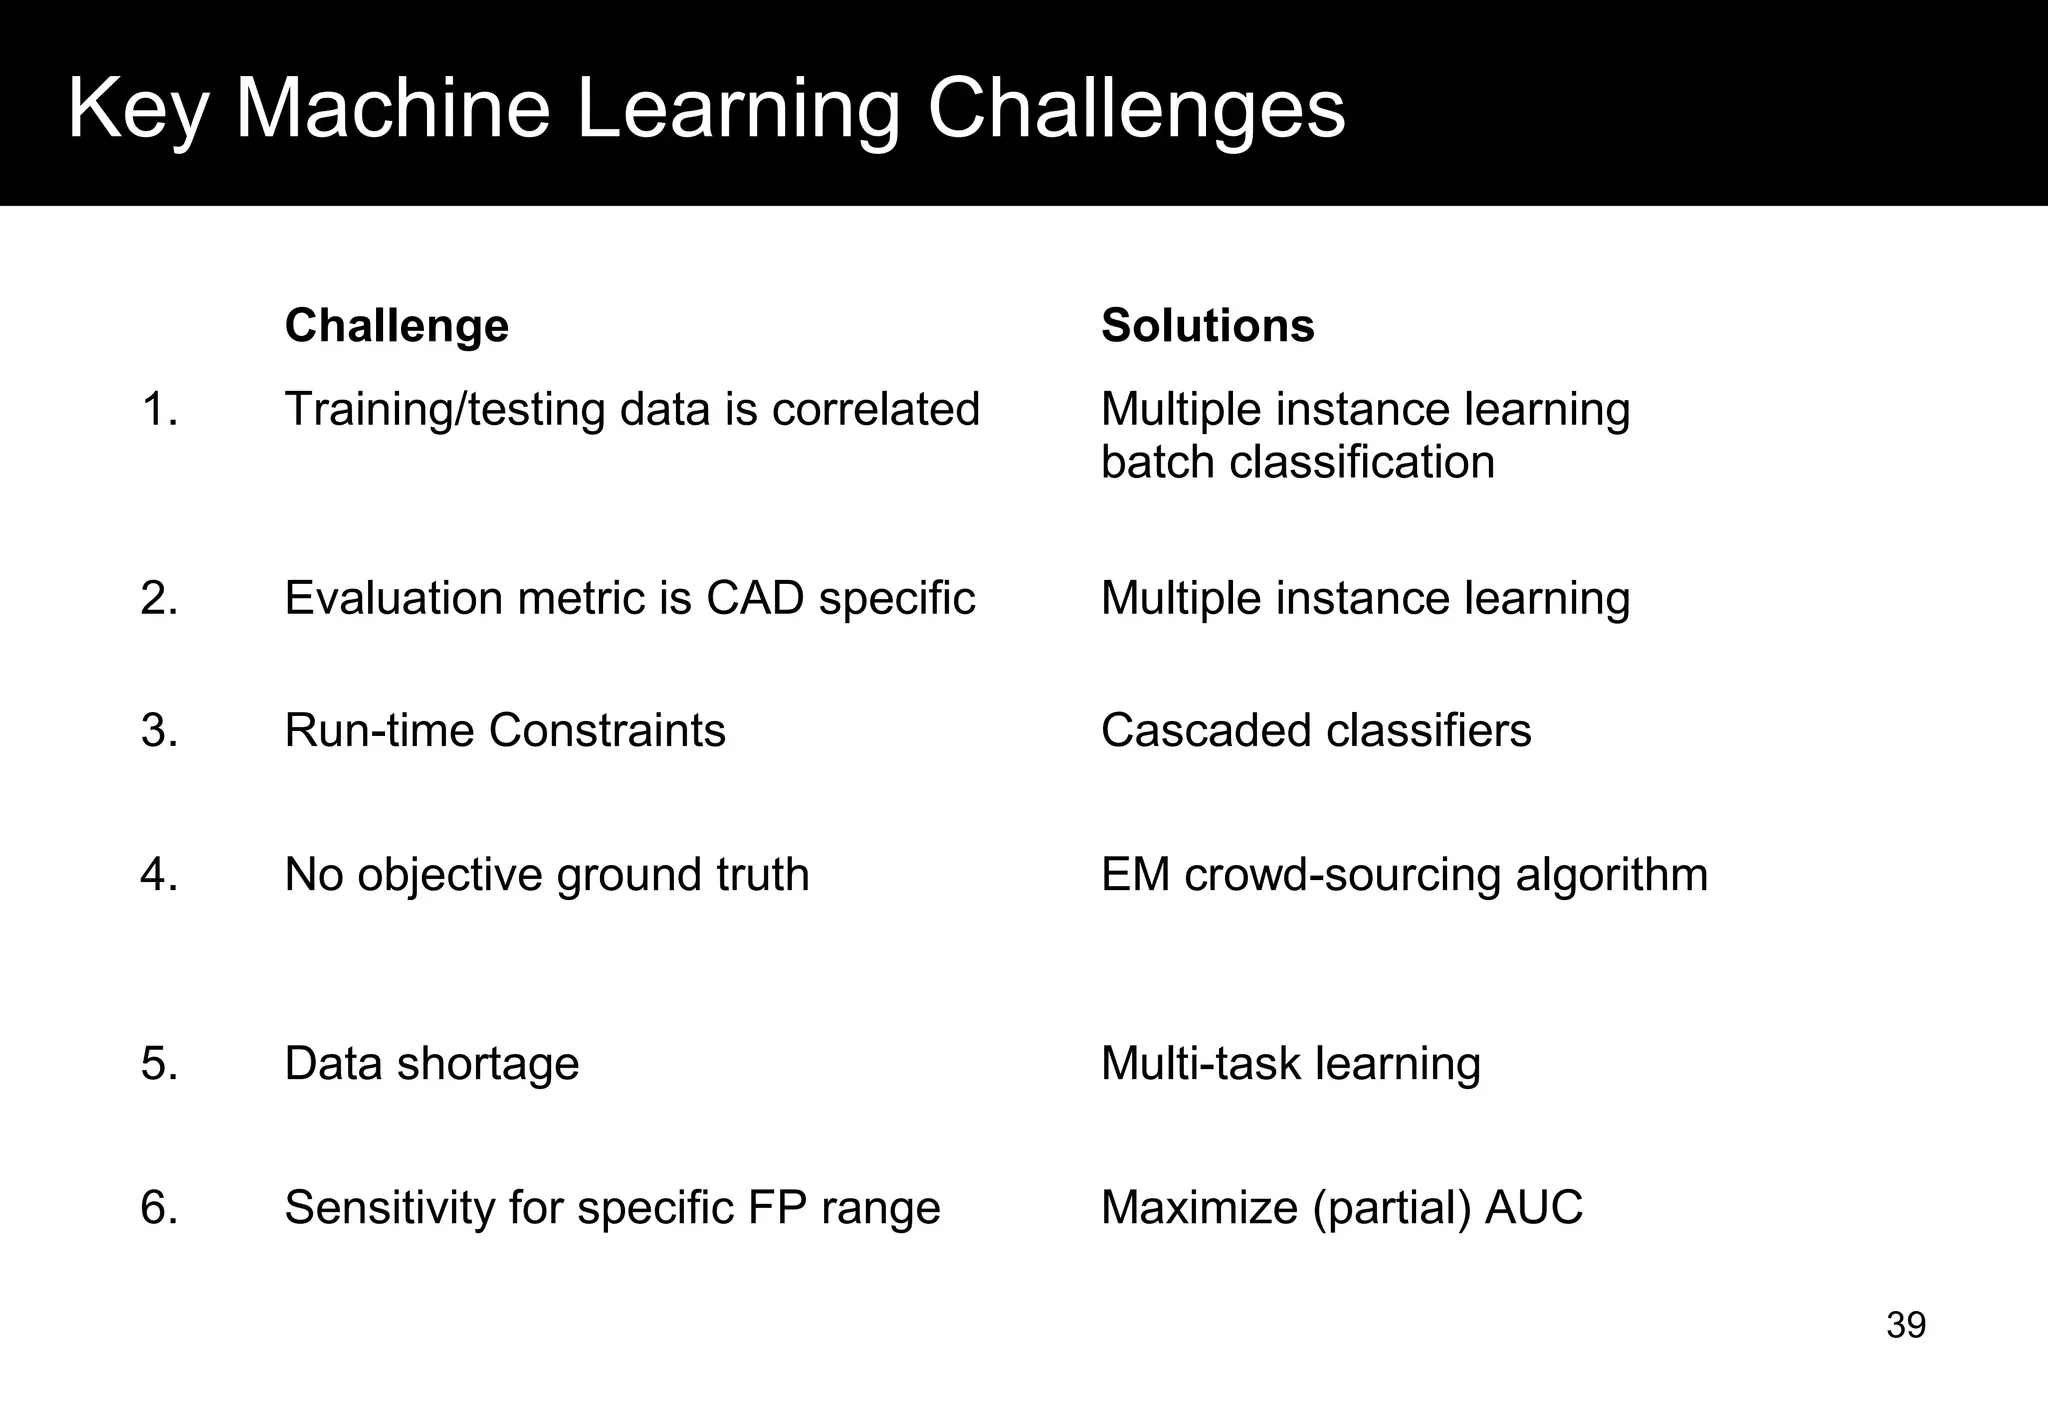


This document discusses computer aided detection (CAD) of abnormalities in medical images. It begins by outlining CAD and some of the key machine learning challenges, including correlated training data, non-standard evaluation metrics, runtime constraints, lack of objective ground truths, and data shortages. It then describes solutions like multiple instance learning, batch classification, cascaded classifiers, crowdsourcing algorithms, and multi-task learning. The document concludes by reviewing the clinical impact of CAD systems through several independent studies, which demonstrated improved radiologist performance and sensitivity in detecting diseases.