Download to read offline
![IOSR Journal of Applied Chemistry (IOSR-JAC)
e-ISSN: 2278-5736.Volume 4, Issue 6 (May. – Jun. 2013), PP 11-20
www.iosrjournals.org
www.iosrjournals.org 11 | Page
Batch Thermodynamics and Kinetic Study for Removal of
Cationic Dye from Aqueous Solution Using Iraqi Limestone
Mohammed Hussein Ali
Chemistry Dep. /College of Science/ AL-Nahrain University
Abstract: Model using Iraqi limestone as an adsorbent has been investigated. The influences of equilibrium
time, limestone dosage, limestone particle size, pH of solution, adsorption isotherms and temperature on
adsorption performance have been experimentally verified by a batch method. The adsorbent used in this study
exhibited a good adsorption potential at initial pH 10, temperatures 28ºC, particle size 75 µm, limestone dosage
0.1g for equilibrium time 140 min. The removal efficiency and distribution coefficient have also been
determined for the adsorption system as a function of dosage of the adsorbent. The experimental results are
described by Langmuir and Freundlich isotherm models. Experimental results show that the kinetic model of
pseudo-second order provided a good description of the whole experimental data more than the kinetic of the
Lagergren-first order.
Keyword: Batch adsorption, Methyl Violet, Thermodynamics and Kinetic models.
I. Introduction
Dye contaminated wastewater originates from a number of industries, such as textile, metal plating,
packaging, and paper industry. The need for the treatment of dye contaminated wastewater arose from the
environmental impact. They impart objectionable color on water bodies and retard photosynthesis hence leads
the aquatic life on the path of extinction. Some dyes have been found to act as substrate for metal ions and may
import contamination by heavy metals [1]. It has also been reported that many dyes and pigments have toxic as
well as carcinogenic, mutagenic, and teratogenic effects on aquatic life as well as humans [2, 3].
They are water soluble, and are responsible for the blue, red, violet and purple colorations in several
plants [4]. Methyl violate dye, which is known to be highly toxic to mammalian cells and to act as a tumors
enhancing agent. However, despite the large amount of data on its toxic effects, it is still used in aquaculture and
other industries [4], [5]. This dye can be partially or totally purified by adsorption process.
Adsorption of dye at the solid/liquid interface has been extensively studied the last years. One reason
for this interest is that importance of adsorption on solid surfaces in many industrial applications in order to
improve efficiency and economy. Therefore, it is essential to understand the mechanism and kinetics of
adsorption.
Adsorption techniques have proven successful in removing colored organic species with activated
carbon being the most widely used adsorbent due to its high capacity for the adsorption of organic materials [6–
7]. However, due to its high cost and the difficulty of regeneration, a search for cheap, effective adsorbents such
as Iraqi limestone. Unlike activated carbons, limestone is relatively cheap due to its accessibility and abundance
[7]. In recent years, limestone is important in many different fields such as agriculture, oil drilling, and the
building industry.
A large variety of non-conventional adsorbent materials have been also proposed and studied for their
ability to remove dyes [8]. Therefore, in recent years, many investigators have studied the feasibility of using
low cost substances, such as: plum kernels [9], chitin [10] ,chitosan [11], perlite [12], natural clay [13, 14],
bagasse pith [15], fly ash [16, 17], wood [18, 19], rice husk [20] and peat [21, 22].
Thus, this investigation aims at to study kinetics and thermodynamic activation parameters, to describe
the rate and mechanism of adsorption, to determine the factors controlling the rate of adsorption and to find out
the possibility of using this material as low-cost adsorbent for the removal of dye. The effect of equilibrium
time, limestone dosage, limestone particle size, pH of solution, adsorption isotherms and temperature on methyl
violet adsorption rate have been evaluated.
II. Experimental Techniqe
2.1. Materials:
2.1.1. Limestone
Iraqi limestone used in this investigation is brought from Bahr Al-Najaf Area (about 20 km to the west
of Al-Najaf City). It is crushed to the required size by means of laboratorial mechanical crusher .There are huge
quantities (about 75 million tons) of limestone is found in Bahr Al –Najaf Area [23, 24].](https://image.slidesharecdn.com/c0461120-150425004202-conversion-gate01/75/Batch-Thermodynamics-and-Kinetic-Study-for-Removal-of-Cationic-Dye-from-Aqueous-Solution-Using-Iraqi-Limestone-1-2048.jpg)
![Batch Thermodynamics And Kinetic Study For Removal Of Cationic Dye From Aqueous Solution
www.iosrjournals.org 12 | Page
Table (1) shows the chemical composition of limestone, the results represent the average of three
samples.
Table 1. Chemical Composition of Limestone
Oxides Percentage (%)
Lime –CaO 38.90
Silica – SiO2 9.17
Magnesia – MgO 5.37
Ferric Oxide – Fe 2O3 1.16
Alumina – Al 2O3 0.89
Sulphuric Anhydride – SO 3 0.35
Loss of Ignition (L.O.I) 43.70
2.1.2. Methyl violet
Methyl violet contains a secondary amine group. The color of methyl violet changes from yellow to
green in the pH range 0.13–0.5, from green to blue in the Ph range 2.0–3.0. When pH is higher than 3, the
solubility of methyl violet are essentially unchanged. Methyl violet has a molecular weight of 393.96 g mol_1.
The structure of this dye is shown in Fig. 1 [25].
Fig. 1. The structure of methyl violet.
2.1. Batch equilibrium time Study
The experiments were carried out at constant initial concentration, 10, 20 and 30 ppm at constant
temperature (28 ºC) and agitated at 120 rpm. The samples (1ml) were withdrawn before mixing the adsorbent
and the dye bearing solution and at pre-determined time intervals; every 5 minutes for the first 30 minutes and at
every 10 minutes for the next 30 minutes. For the next 120 minutes, sampling was in every 30 minutes. For the
last 120 minutes, sampling was in every 60 minutes.
2.2. Effect of limestone dosage
The effect of limestone dosage on the adsorption process was investigated by varying limestone dosage
from (10, 20, 30, 40, 50, 60, 70, 80, 90 and 100 mg per 100 ml) in the test solution while keeping the initial dye
concentration (10 ppm) constant, at equilibrium times during 140 min.
2.3. Effect of limestone particle size
Effect of limestone particle size was investigated by varying limestone particle sizes from 75 μm to 350
μm. In experiments, a 0.1 g sample of limestone, add to constant concentration of methyl violate 20ppm in 100
ml, at equilibrium times during 140 min.
2.4. The effect of pH on adsorption process
Effect of initial pH was investigated at various pH (3–10), In the experiments, a 0.1 g sample of
limestone was added to each 100mL volume of methyl violate aqueous solution having an initial concentration
20ppm for a constant sorption time, 140 min.](https://image.slidesharecdn.com/c0461120-150425004202-conversion-gate01/75/Batch-Thermodynamics-and-Kinetic-Study-for-Removal-of-Cationic-Dye-from-Aqueous-Solution-Using-Iraqi-Limestone-2-2048.jpg)
![Batch Thermodynamics And Kinetic Study For Removal Of Cationic Dye From Aqueous Solution
www.iosrjournals.org 13 | Page
2.5. The Batch Adsorption Studies
The adsorption experiment was carried by adding fixed amount of adsorbent (0.1 g) into 100ml of dye
standard solution with the range of initial concentration within 5 to 30 ppm (at optimum pH), which was put
inside the 250ml conical flask (Pyrex, England). The conical flask with limestone–dye mixture were then
covered with aluminum foil to avoid evaporation of dye solution before it being put into the incubator shaker
(Cretomat Is) which operated at 120 rpm and with constant temperature 28ºC until it reach equilibrium.
The amount of dye adsorbed which is also known as adsorption capacity, Qe (mg/g) can be calculated
from equation (1)
𝑄𝑒 =
𝑉 𝐶𝑜 − 𝐶𝑒
𝑚
(1)
Where Co is the initial concentration, Ce is the final concentration, m is the mass of adsorbent used and V is the
volume of dye solution.
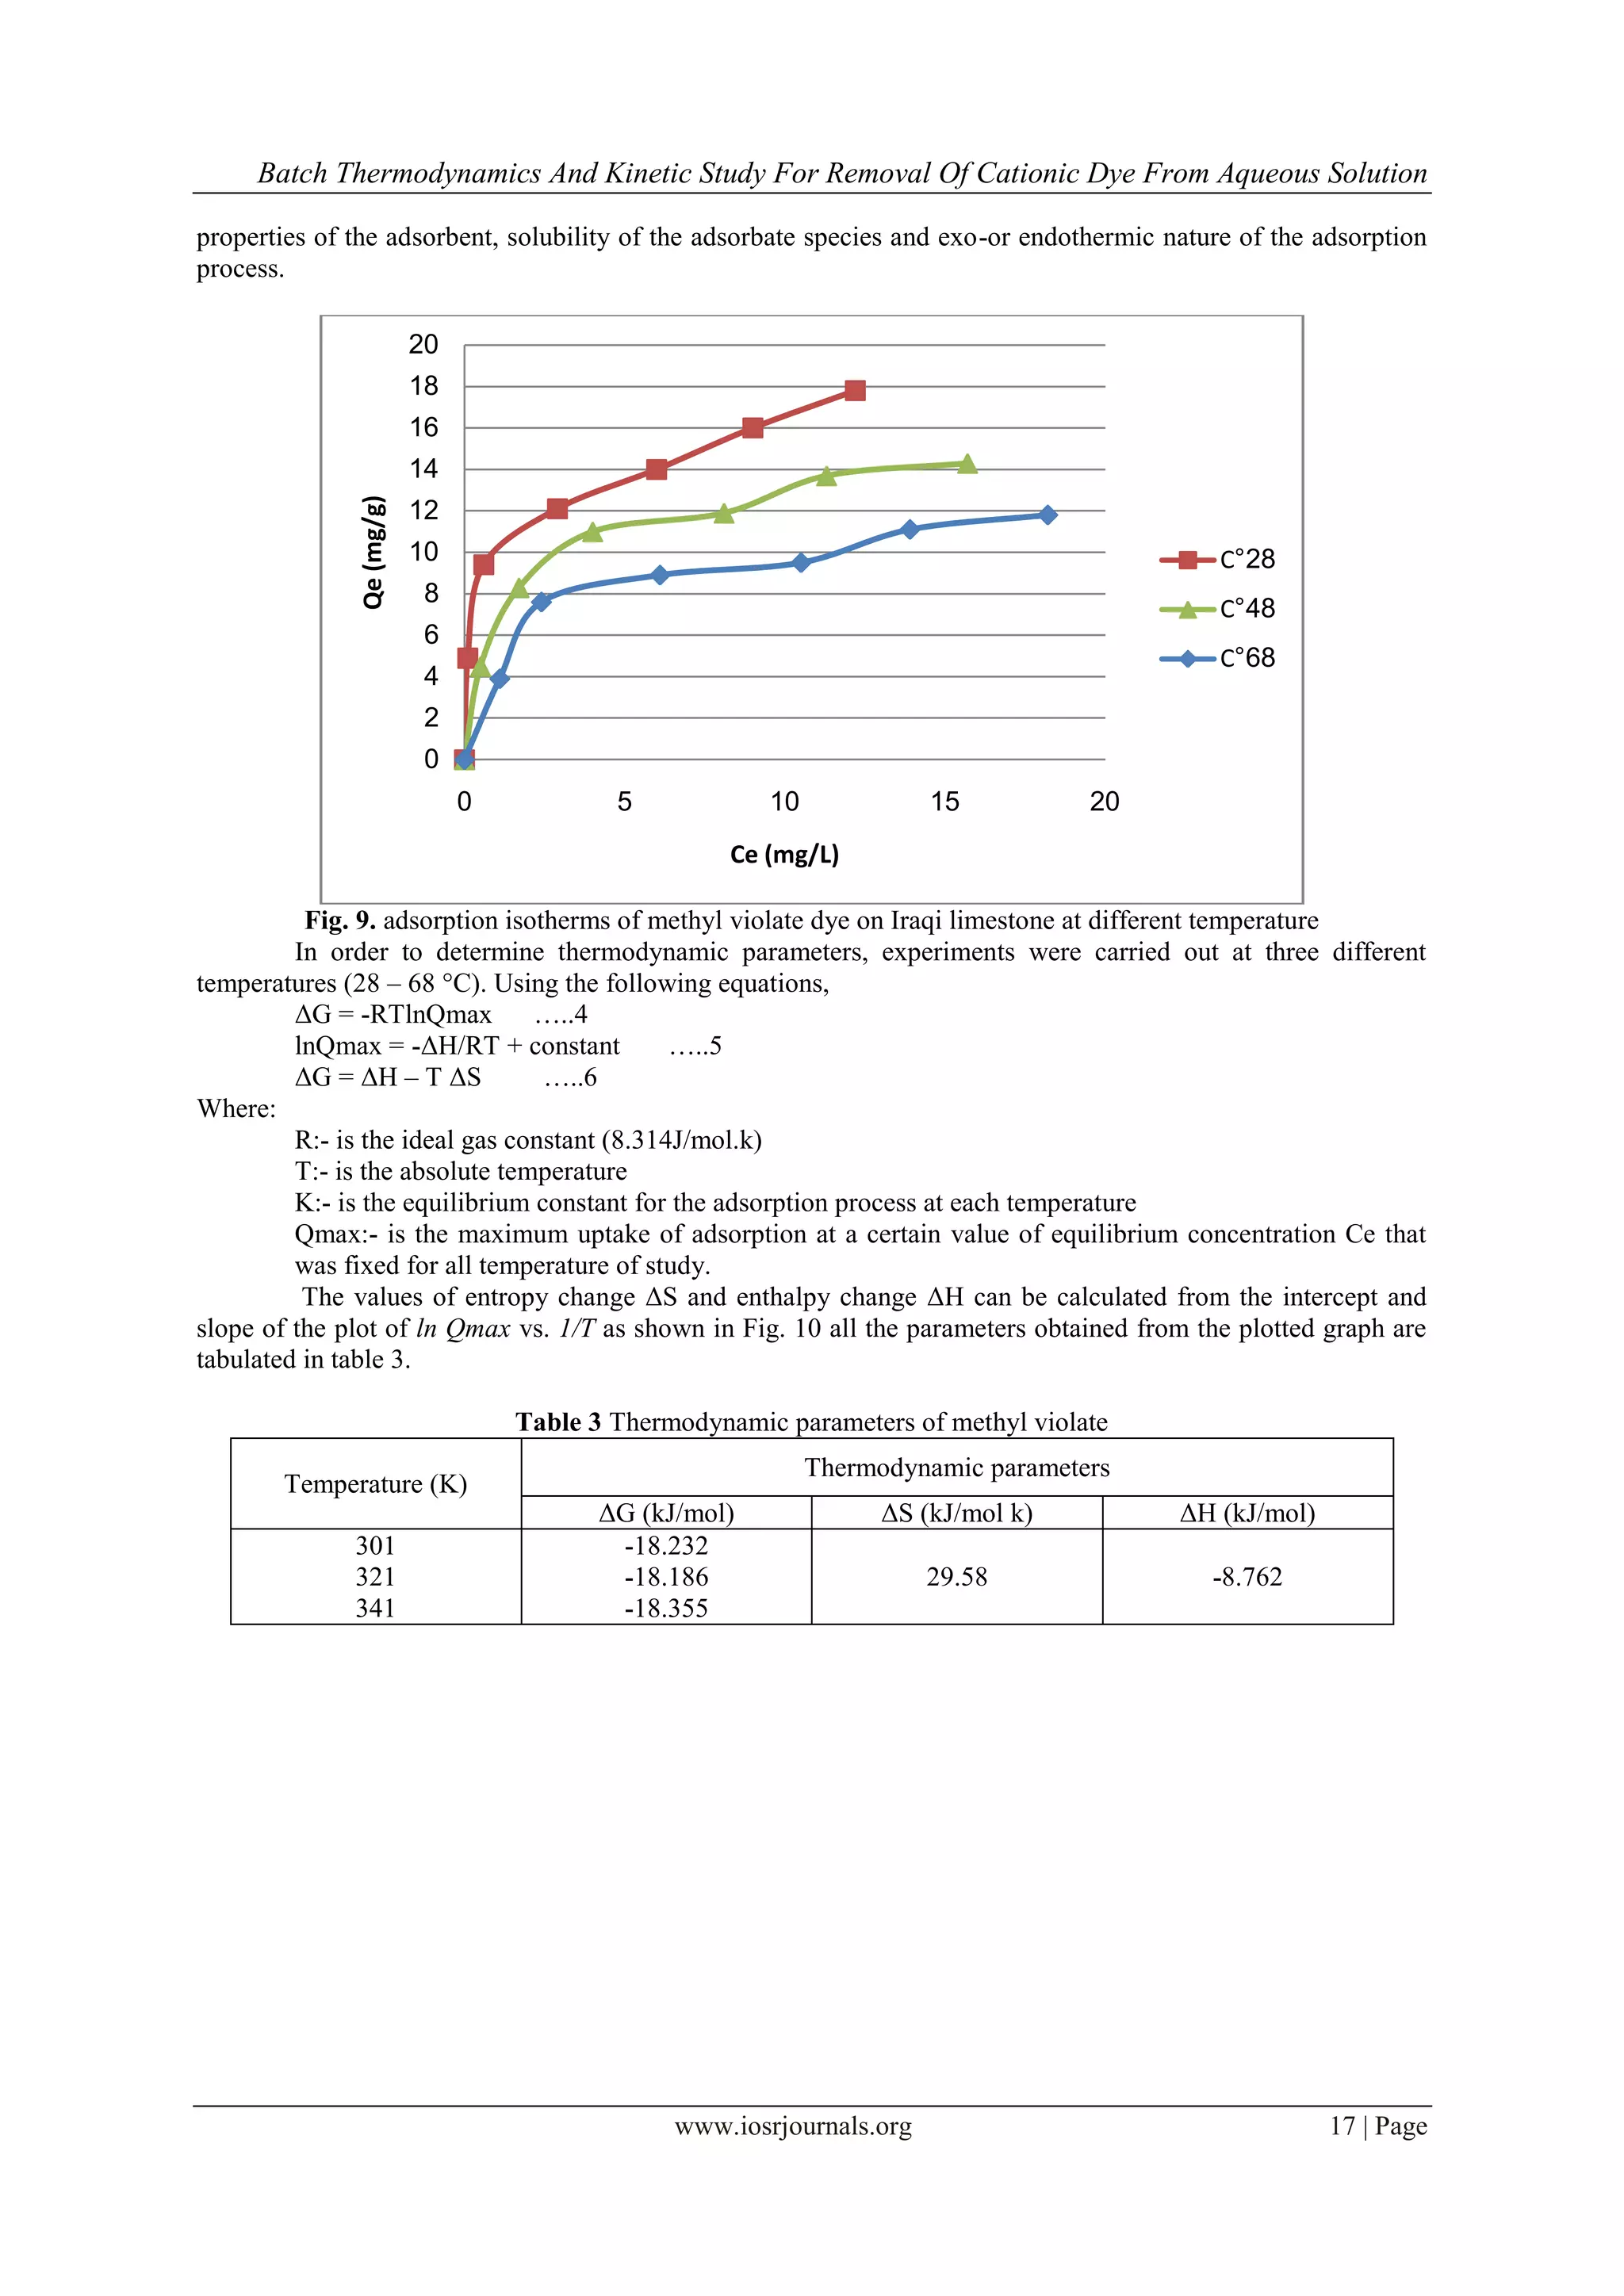
2.6. Effect of temperature
A 0.1 g sample of limestone was added to each 100mL volume of methyl violate aqueous solution
having an initial concentration (5, 10, 15, 20, 25, and 30) ppm. The experiments were carried out at 28, 48, and
68 ◦C in a constant temperature shaker bath which controlled the temperature to within ±1 ◦C for a constant
equilibrium time, 140 min.
2.7. Analysis of Dye
All the samples were analyzed using UV-Visible spectrophotometer (Genesys 10uv) at maximum
wavelength (λmax) of 597 nm.
III. Result And Discution
3.1. Equilibrium time
Figure 2 represents the variation in methyl violet adsorption on limestone with shaking time at different
methyl violet solution concentrations (10, 20, and 30 ppm). This figure indicates that while the adsorption of
methyl violet is quite rapid initially, the rate of adsorption becomes slower with the passage of time and reaches
a constant value at 140 min (equilibrium time). The initial faster rate may be due to the availability of the
uncovered surface area of the adsorbents, since the adsorption kinetics depends on the surface area of the
adsorbent [26]. It is quite evident from this figure that the percentage adsorption at equilibrium, as well as prior
to equilibrium, decreases with an increase in methyl violet concentration.
Fig. 2. Variation of % adsorption with shaking time for the adsorption of methyl violet on limestone from
aqueous solutions.
3.2. Effect of limestone dosage
The adsorption of methyl violet onto Iraqi limestone was studied by changing the amount of adsorbent
(10, 20, 30, 40, 50, 60, 70, 80, 90 and 100 mg per 100 ml) in the test solution while keeping the initial dye
concentration (10 ppm) constant, at equilibrium times during 140 min the results are shown in Fig. 3.
0
10
20
30
40
50
60
70
80
90
100
0 50 100 150 200 250
%Adsorption
Shaking time (min)
10ppm
20ppm
30ppm](https://image.slidesharecdn.com/c0461120-150425004202-conversion-gate01/75/Batch-Thermodynamics-and-Kinetic-Study-for-Removal-of-Cationic-Dye-from-Aqueous-Solution-Using-Iraqi-Limestone-3-2048.jpg)
![Batch Thermodynamics And Kinetic Study For Removal Of Cationic Dye From Aqueous Solution
www.iosrjournals.org 14 | Page
Fig. 3. Effect of adsorbent amount (10 mg, to 100 mg, teq = 140min).on the equilibrium concentration of methyl
violet adsorbed onto Iraqi limestone
In the methyl violet removal, it is seen that the adsorption efficiency increases as the limestone amount
increases. The increase in the efficiency can be explained by the increasing surface area where the adsorption
takes place [17]. As seen in Fig. 3, optimum limestone dosage that can be used in methyl violet removal is 100
mg (of limestone) per 100 ml. Thus, further experiments were carried on by using 100 mg of adsorbent.
3.3. Effect of limestone particle size
The experimental results of the adsorption of methyl violet on the Iraqi limestone are reported. Fig. 4
shows the amount adsorbed against a fixed weight (0.1 g) of different particle sizes of the adsorbent. As the
particle size of the adsorbent increased from 75 μm to 350 μm, the adsorbed amount decreased. It was observed
that there is a best adsorption as the particle size 75 μm is approached. As a result, the particle size of 75 μm
was used in the subsequent experiments of this work.
Fig. 4. Amount adsorbed (mg/g) against particle size (μm) for methyl violet adsorption onto Iraqi limestone
3.4. The effect of pH on adsorption process
The magnitude of electrostatic charges imparted by the ionized dye molecules is primarily controlled
by the pH of medium. The amount of dye adsorbed or rate of adsorption tends to vary with pH (3–10) of
aqueous medium. The amount of methyl violet adsorbed on the limestone as a function of pH at an initial dye
concentration of 20ppm and temperature 28Cо
is shown in Fig. 5. The amount of methyl violet adsorbed
increased with increase in pH (i.e., as the solution became more basic). The adsorption of methyl violet on
limestone increased from 7mg/g to 16mg/g, when pH was increased from 3 to 10 (Fig. 4) at 28 о
C and
Co=20ppm. This indicates that the adsorption capacity of the limestone is pH dependent. Thus, it is clear that pH
determined the speciation of the methyl violet as well as providing a favorable adsorbent surface charge for the
0
2
4
6
8
10
12
0 20 40 60 80 100 120
Ce(mg/g)
Adsorbent mass (mg)
0
2
4
6
8
10
12
14
16
0 50 100 150 200 250 300 350 400
Amountadsorbed(mg/g)
Particle size (µm)](https://image.slidesharecdn.com/c0461120-150425004202-conversion-gate01/75/Batch-Thermodynamics-and-Kinetic-Study-for-Removal-of-Cationic-Dye-from-Aqueous-Solution-Using-Iraqi-Limestone-4-2048.jpg)
![Batch Thermodynamics And Kinetic Study For Removal Of Cationic Dye From Aqueous Solution
www.iosrjournals.org 15 | Page
adsorption to occur. As the pH increased from 3 to 10, the number of ionizable sites on the limestone increased.
These observations are in line with earlier findings of Lafferty and Hobday [27].
SOH + OH-
= SO-
+ H2O
It had been shown that limestone samples had no point of zero charge and exhibited negative zeta
potential values in the pH range 3–11 [28, 29]. As the pH of the dye solution became higher, the association of
dye cations with more negatively charged limestone could more easily take place;
SO-
+ Dye+
= S–O–Dye
Fig. 5. Amount adsorbed (mg/g) against pH for methyl violet adsorption onto Iraqi limestone
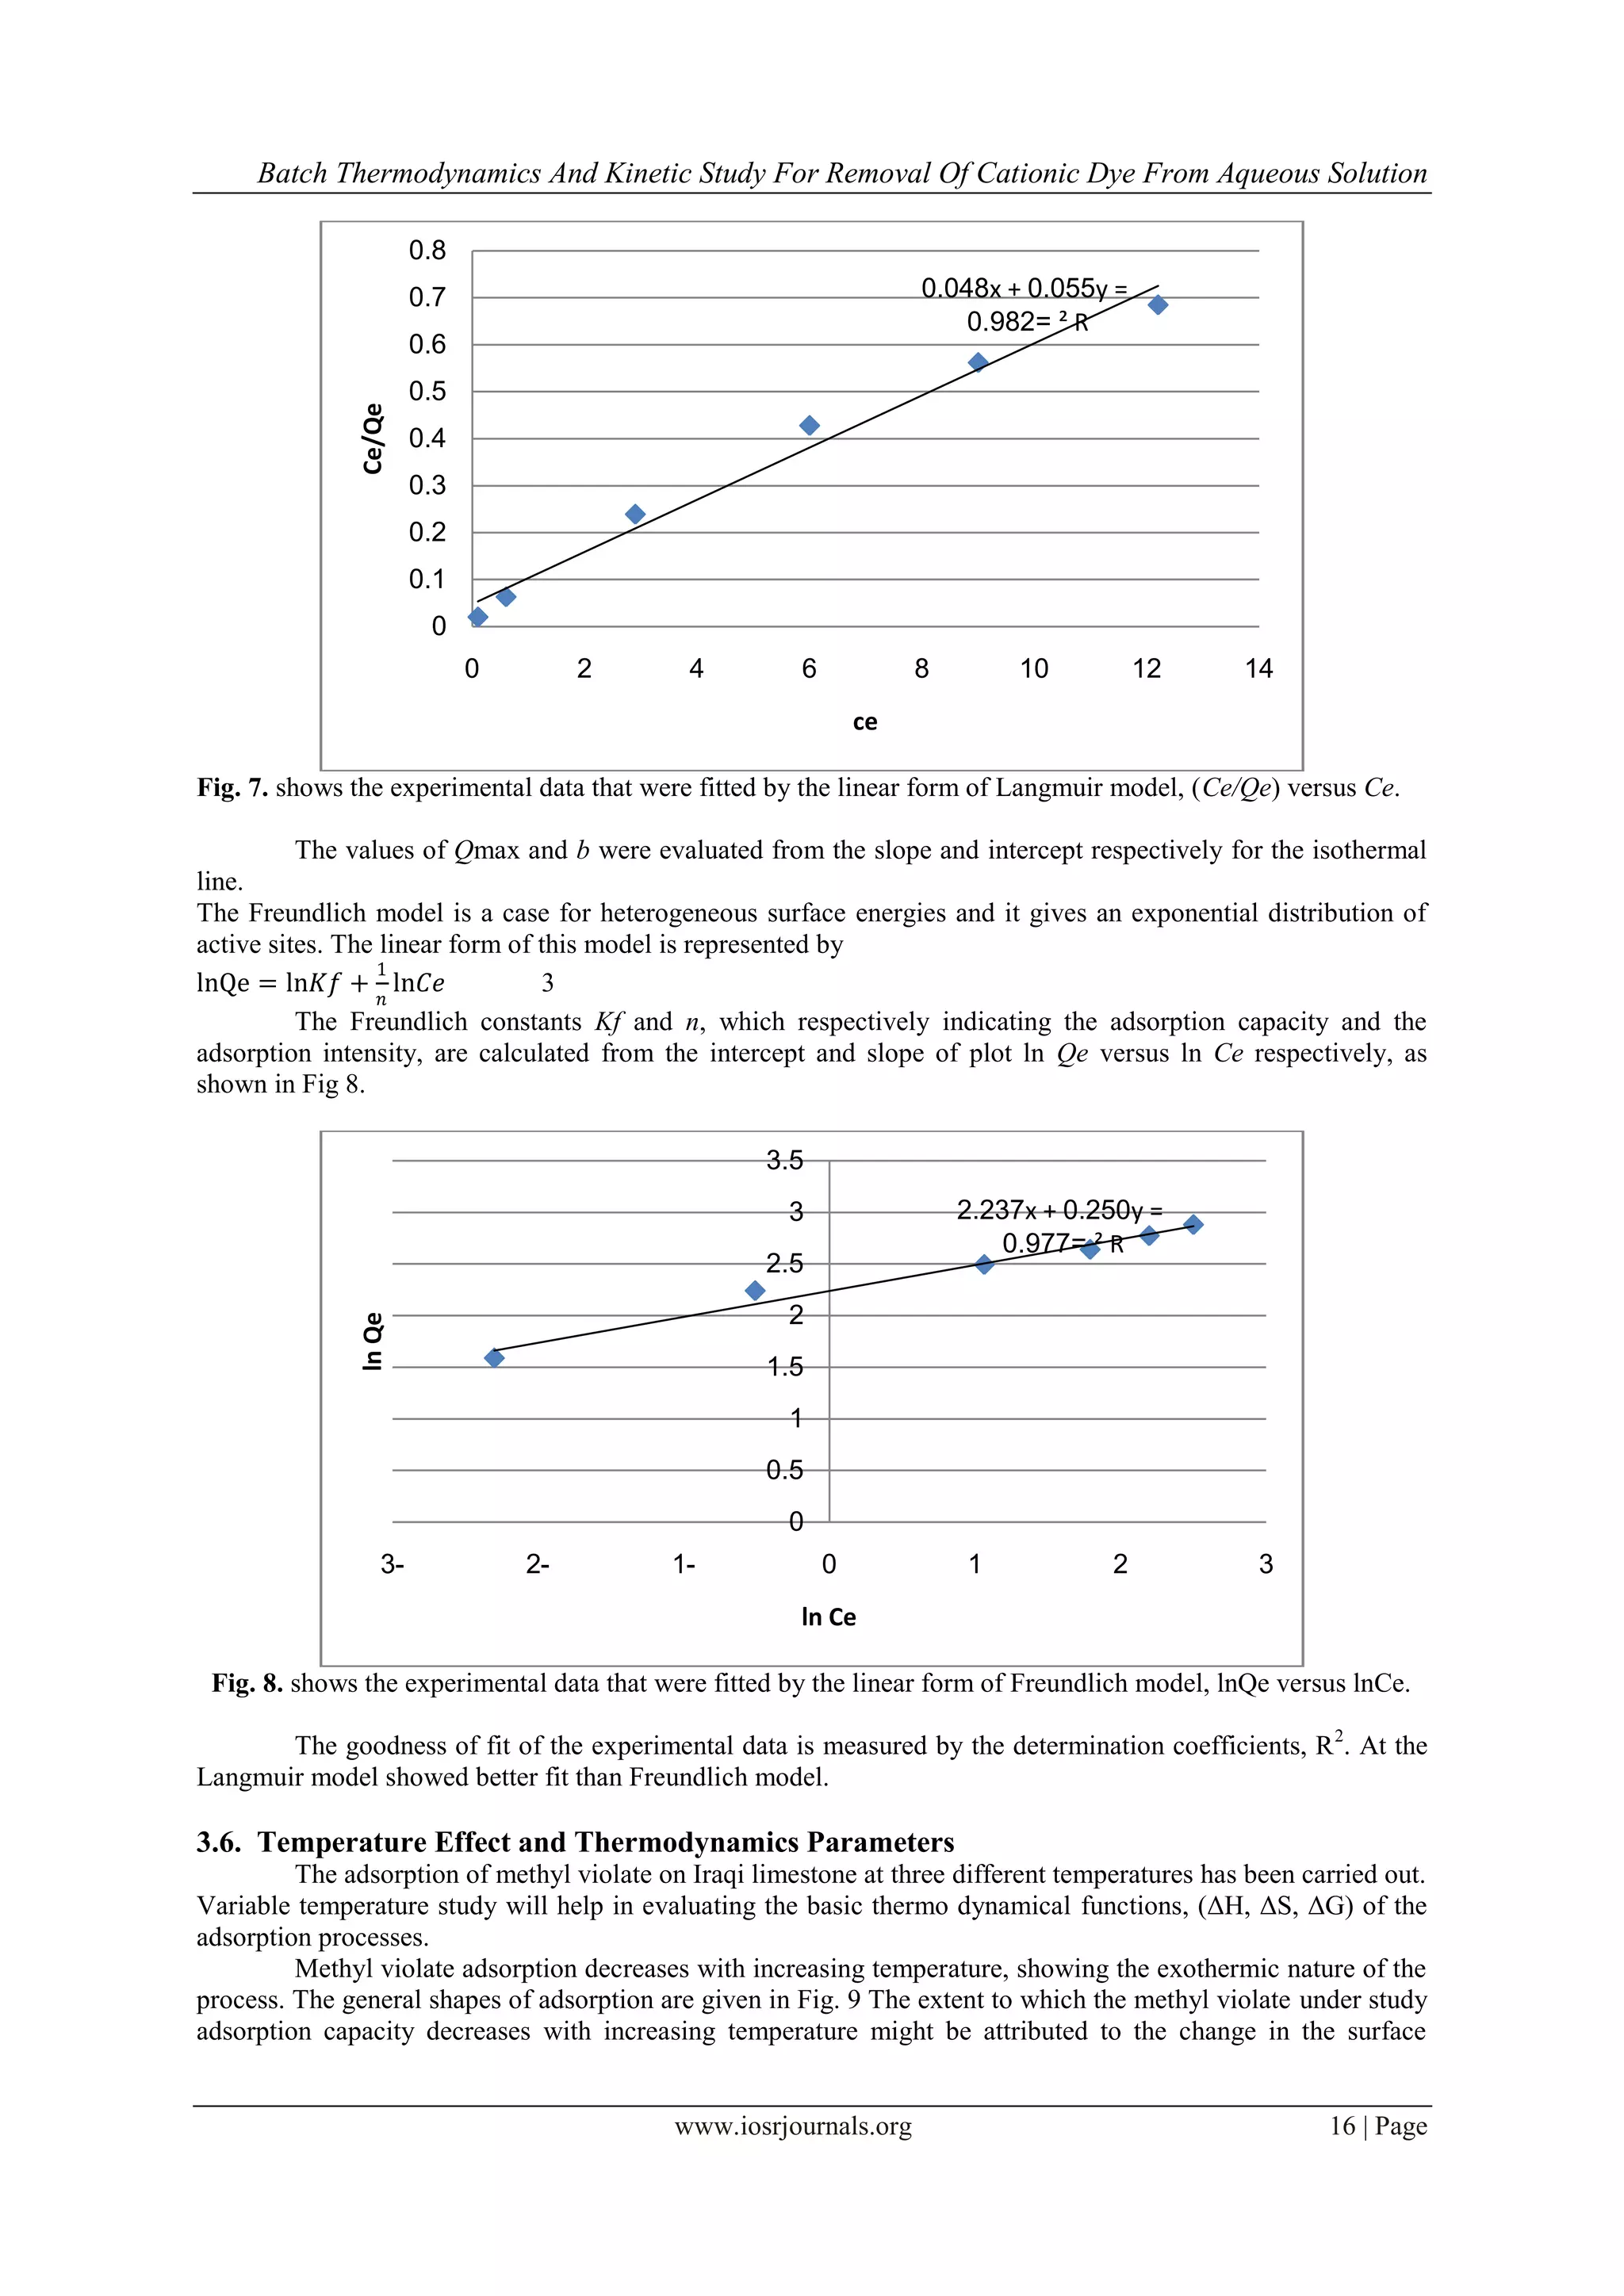
3.5. Adsorption isotherms
In order to optimize the design of an adsorption system to remove basic dyes from effluents, it is
important to establish the most appropriate correlation for the equilibrium curves. In this respect, the equilibrium
experimental data for adsorbed methyl violet onto Iraqi limestone were compared using two isotherm equations
namely, Langmuir, and Freundlich.
Fig. 6. adsorption isotherms for methyl violate dye for the Iraqi limestone
Tow adsorption isotherms models were used: Langmuir, and Freundlich. Langmuir’s isotherm model
suggests that the uptake occurs on homogeneous surface by monolayer sorption without interaction between
adsorbed ions. The linear form of Langmuir isotherm equation is represented by the following equation
Ce
Qe
=
1
𝑄𝑚𝑎𝑥 𝑏
+
1
𝑄𝑚𝑎𝑥
𝐶𝑒 2
Where Qmax is the maximum methyl violate uptake per unit mass of limestone (mg/g) related to
adsorption capacity and b is Langmuir constant (L/mol) related to energy of sorption.
Therefore, a plot of Ce/qe versus Ce, gives a straight line of slope 1/Qmax and intercept 1/(Qmax b).
0
2
4
6
8
10
12
14
16
18
0 2 4 6 8 10 12
Qe(mg/g)
pH
0
2
4
6
8
10
12
14
16
18
20
0 2 4 6 8 10 12 14
Qe(mg/g)
Ce (mg/L)](https://image.slidesharecdn.com/c0461120-150425004202-conversion-gate01/75/Batch-Thermodynamics-and-Kinetic-Study-for-Removal-of-Cationic-Dye-from-Aqueous-Solution-Using-Iraqi-Limestone-5-2048.jpg)
![Batch Thermodynamics And Kinetic Study For Removal Of Cationic Dye From Aqueous Solution
www.iosrjournals.org 18 | Page
Fig. 11. Plot of lnQmax vs. 1/T for estimation of thermodynamic parameters
The negative ΔG value obtained from the equation 11 confirmed that the feasibility of the adsorption
process and the spontaneous nature of the adsorption. Negative value of ΔH indicates the exothermic nature of
the process. This is also confirms the possibility of physical adsorption as with the increase in temperature of the
system [30]. Moreover, the positive value of ΔS corresponds to a increase in degree of freedom of the adsorbed
species.
3.7. Kinetics study
The kinetic results obtained from batch experiments were analyzed using different kinetics models such
as Lagergren pseudo first-order [35], pseudo second-order [36] models. Equation 12 gives the linear form of
Lagergren pseudo first-order models
1/Qt = Qe + K1 1/t 12
Where Qt is methyl violate concentration adsorbed on limestone at any time (mg of methyl violate/g of
limestone) and K1 is the adsorption rate constant (min–1). A linear plot of 1/Qt against 1/t gives the slope = k1
and intercept = Qe.
Fig. 12. Pseudo-first-order kinetic plots for the adsorption of methyl violate on limestone.
The equation that describes the pseudo-second order model is given in the following linear form
𝑡
𝑄𝑡
= 𝑄𝑒 + 𝐾2 𝑡 13
Where K2 is the adsorption rate constant (g/mg-min). The K2 and
y =1053.x -0.622
2.4
2.45
2.5
2.55
2.6
2.65
2.7
2.75
2.8
2.85
2.9
0.0029 0.003 0.0031 0.0032 0.0033 0.0034
lnQmax
1/T
y =0.396x +0.102
R²=0.992
0
0.02
0.04
0.06
0.08
0.1
0.12
0.14
0.16
0 0.02 0.04 0.06 0.08 0.1 0.12
1/Qt
1/t](https://image.slidesharecdn.com/c0461120-150425004202-conversion-gate01/75/Batch-Thermodynamics-and-Kinetic-Study-for-Removal-of-Cationic-Dye-from-Aqueous-Solution-Using-Iraqi-Limestone-8-2048.jpg)
![Batch Thermodynamics And Kinetic Study For Removal Of Cationic Dye From Aqueous Solution
www.iosrjournals.org 19 | Page
Qe are found from the intercept and slop of t/Qt versus t linear plot such that Qe = intercept and k2 = slope.
Fig. 13. Pseudo-second-order kinetic plots for the adsorption of methyl violate on limestone.
Table 4. The adsorption kinetic model rate constants for adsorption of Methyl violate on limestone.
Pseudo first-order Pseudo second-order
K1 Qe R2
K2 Qe R2
0.3965 0.1025 0.9923 0.1037 0.3579 0.9999
K1 in (1/min), K2 in (g/mg-min), Qe in (mg/g ).
The degree of goodness of linear plot of these kinetic models can be judged from the value of the
determination coefficient of the plot, which can also be regarded as a criterion in the determination of the
adequacy of kinetic model.
From the determination coefficient (R2
) and adsorption quantity (Qe) values above, adsorption of
methyl violate on the limestone is regarded as pseudo-second order rather than pseudo-first-order.
IV. Conclusions
Based upon the experimental results of this study, the following conclusions can be drawn:
1. The maximum removal efficiency of methyl violate occurs at 75 μm particle size, pH = 10 and solution
temperature 28 ºC.
2. The removal efficiency of methyl violate increases as the dosage of the adsorbent increases.
3. The isotherm study indicates that the Freundlich and Langmuir isotherms models can adequately model
sorption data.
4. The equilibrium removal of methyl violate decreases as the temperature of solution increases.
5. The removal of methyl violate by this limestone is an exothermic process.
6. It is found that the pseudo-second order model is applicable for whole the range of contact time while not for
the pseudo-first order
Acknowledgments
Thanks go to the Directorate of Laboratories in Chemical Engineering Dep / AL-Nahrain University for analyzing
the samples.
References
[1] Strivastava, K.A., Gupta, S.K., and Iyer, M.V.S.,“Colour Removal from Paper Mill Waste”, J. of Inst. Public Health Eng. India, Part
2/3, 1984, 59-64.
[2] McKay, G., Oterburn M.S. and Aga, D.A., “Fullers Earth and Fired Clay as Adsorbent for Dye Stuffs, Equilibrium and Rate
Constants”, Water. Air , soil Pollut., 24, 1985, 307-322.
[3] Gregory, A.R., Elliot, S Kluge. and P. Ames., “Testing of Direct Black 3Bparallel Carcinogenicity” J. Appl. Toxicol 1, 1991, 308-
313.
[4] Stringheta, Identificacao da estrutura e estudo da estabilidade das antocianinas extraidas da inflorescencia de capim gordura
(Mellinis minutuflora, Pal de Beauv.). Tese, UNICAMP, Campinas-SP, P. C. 1991.
[5] Geankoplis, C. J., Transport Process and unit operations, Prentice-Hall. pp. 1993, 697-707.
[6] B. Chen, C.W. Hui, G. McKay, Pore-surface diffusion modeling for dyes from effluent on pith, Langmuir 17, 2001, 740–748.
y =0.103x +0.357
R²=0.999
0
2
4
6
8
10
12
14
16
0 20 40 60 80 100 120 140 160
t/Qe
t](https://image.slidesharecdn.com/c0461120-150425004202-conversion-gate01/75/Batch-Thermodynamics-and-Kinetic-Study-for-Removal-of-Cationic-Dye-from-Aqueous-Solution-Using-Iraqi-Limestone-9-2048.jpg)
![Batch Thermodynamics And Kinetic Study For Removal Of Cationic Dye From Aqueous Solution
www.iosrjournals.org 20 | Page
[7] L. Markovska, V. Meshko, V. Noveski, M. Marinovski, Solid diffusion control of the adsorption of basic dyes onto granular
activated carbon and natural zeolite in fixed bed columns, J. Serbian Chem. Soc. 66, 2001, 463–475.
[8] G. Crini, Bioresource Technology, 97, 2006, 1061.
[9] F.-C. Wu, R.-L. Tseng. and R.-S. Juang, Journal of Hazardous Materials, 69, 1999, 287.
[10] R. Dolphen, N. Sakkayawong, P. Thiravetyan. and W. Nakbanpote, Journal of Hazardous Materials, 145, 2007, 250.
[11] G. Annadurai, L. Y. Ling. and J. F. Lee, Journal of Hazardous Materials, 152, 2008, 337.
[12] M. Dogan, M. Alkan, A. Turkyilmaz. and Y. Ozdemir, Journal of Hazardous Materials, 109, 2004, 141.
[13] P. Liu and L. Zhang, Separation and Purification Technology, 58, 2007, 32.
[14] T. B. Iyim and G. Guclu, Desalination, 249, 2009, 1377.
[15] G. McKay, M. El Geundi. and M. M. Nassar, Process Safety and Environmental Protection, 74, 1996, 277.
[16] J. X. Lin, S. L. Zhan, M. H. Fang, X. Q. Qian. and H. Yang, Journal of Environmental Management, 87, 2008, 193.
[17] N. Dizge, C. Aydiner, E. Demirbas, M. Kobya and S. Kara, Journal of Hazardous Materials, 150, 2008, 737.
[18] S. Jain and R. V. Jayaram, Desalination, 250, 2010, 921.
[19] A. L. Ahmad, M. M. Loh and J. A. Aziz, Dyes and Pigments, 75, 2007, 263.
[20] Y. Guo, S. Yang, W. Fu, J. Qi, R. Li, Z. Wang and H. Xu, Dyes and Pigments, 56, 2003, 219.
[21] V. K. C. Lee, J. F. Porter and G. McKay, Food and Bioproducts Processing, 79, 2001, 21.
[22] Q. Sun and L. Yang, Water Research, 37, 2003, 1535.
[23] Habeeb G .M, “Use of Crushed Limestone from Bahr Al-Najaf as an Aggregate for Concrete” Al Najaf Technical Institute, 1990.
[24] Cement Public Company, “hydrological Investigation", Danish Geotechnical Institute and Iraq Cement Public Company Report,
1960.
[25] Dai, M., J. Colloid Interface Sci. 164, 1994, 223–228.
[26] J.M. Smith, Chemical Engineering Kinetics, McGraw-Hill, New York, 1970.
[27] Lafferty, C., Hobday, M., Fuel 69, 1990, 78–83.
[28] Do_gan, M., Ph.D. Thesis, Department of Chemistry, Balıkesir University, Balıkesir, Turkey (in Turkish), 2001.
[29] Alkan, M., Do_gan, M., Perlite Surfaces, Encyclopedia of Surface and Colloid Science, Marcel Dekker, New York, pp. 2002,
3945–3958.
[30] Mall, I.D., Srivastava, W. and K, Argawal., “Removal of orange G and Methyl Violet Dyes by Adsorption Onto Bagasse Fly Ash-
Kinetic Study and Equilibrium Isotherm Analyses”, Dyes and Pigments, 69, 2006, 210-223.
[31] Lagergren, S. Zur Theorie der sogenannten Adsorption gelöster Stoffe. Kungliga Svenska Vetenskapsakademiens Handlingar, Vol.
24, 1898, 1-39.
[32] Ho, Y. S.; McKay, G. Process Biochem. 34, 1999, 451-465.](https://image.slidesharecdn.com/c0461120-150425004202-conversion-gate01/75/Batch-Thermodynamics-and-Kinetic-Study-for-Removal-of-Cationic-Dye-from-Aqueous-Solution-Using-Iraqi-Limestone-10-2048.jpg)

This study investigates the use of Iraqi limestone as an adsorbent for the removal of the cationic dye methyl violet from aqueous solutions. Key factors influencing the adsorption performance, including equilibrium time, limestone dosage, particle size, pH, and temperature, were systematically examined, revealing optimal conditions for dye removal. Results indicate that the adsorption process is best described by the Langmuir isotherm model, with a pseudosecond order kinetic model providing a good fit for the experimental data.


