najoomi asli amil baba kala jadu expert rawalpindi bangladesh uk usa
C0 ntents empowerment
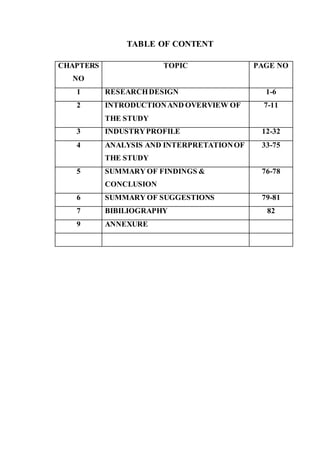
1. TABLE OF CONTENT
CHAPTERS
NO
TOPIC PAGE NO
1 RESEARCHDESIGN 1-6
2 INTRODUCTIONAND OVERVIEW OF
THE STUDY
7-11
3 INDUSTRYPROFILE 12-32
4 ANALYSIS AND INTERPRETATIONOF
THE STUDY
33-75
5 SUMMARY OF FINDINGS &
CONCLUSION
76-78
6 SUMMARY OF SUGGESTIONS 79-81
7 BIBILIOGRAPHY 82
9 ANNEXURE
2. LIST OF TABLES
TABLE
NO
PARTICULARS PAGE
NO
4.1 Table Showing How Long Employees Have Been
Working in BEML
34
4.2 Table Showing Work Environment in BEML 36
4.3 Table Showing Management Solve all the Grievances 38
4.4 Table Showing Differences of Opinion, Values, And
Beliefs Are Respected
40
4.5 Table Showing Improvements in The Working
Environment of the Organization
42
4.6 Table Showing Health Insurance and Accidents Benefits 44
4.7 Table Showing Training Programme 46
4.8 Table Showing Guidance and Assistance to Move
Further in The Set Of Careers
48
4.9 Table Showing Action and Feedback Given on The
Employees
50
4.10 Table Showing Reward System for The Effective
Performance by The Employee’s Performance
52
4.11 Table Showing Organizational Success 54
4.12 Table showing the leaders and managers are role
models of openness
56
4.13 Table Showing Safety Measures Followed in Handling
Hazardous Machines Is Appropriate
58
4.14 table showing leadership helps in maximizing the
organization results
60
4.15 Table Showing Interpersonal Communication and
Relationships Contributes to An Organization
Productivity
62
4.16 Table Showing Senior Management Treats the
Employees Fairly
64
4.17 Table Showing Clearness of Goals and Objectives 66
4.18 Table Showing Employees Are Free to Express Their
Views and Suggestions in Decision Making Process and
The Management Will Consider Their Views And
Suggestions
68
4.19 Table showing enhance employees career growth 70
4.20 Table Showing Equal Opportunity to Grow and
DevelopProfessionally And Personally
72
4.21 Table showing newcomers are welcomed and integrated
quickly
74
3. LIST OF CHARTS
CHART
NO
PARTICULARS PAGE
NO
4.1 Chart Showing How Long Employees Have Been
Working in BEML
33
4.2 Chart Showing Work Environment in BEML 35
4.3 Chart Showing Management Solve all the Grievances 37
4.4 Chart Showing Differences of Opinion, Values, And
Beliefs Are Respected
39
4.5 Chart Showing Improvements in The Working
Environment of the Organization
41
4.6 Chart Showing Health Insurance and Accidents
Benefits
43
4.7 Chart Showing Training Programme 45
4.8 Chart Showing Guidance and Assistance to Move
Further in The Set Of Careers
47
4.9 Chart Showing Action and Feedback Given on The
Employees
49
4.10 Chart Showing Reward System for The Effective
Performance by The Employee’s Performance
51
4.11 Chart Showing Organizational Success 53
4.12 Chart showing the leaders and managers are role
models of openness
55
4.13 Chart Showing Safety Measures Followed in Handling
Hazardous Machines Is Appropriate
57
4.14 Chart showing leadership helps in maximizing the
organization results
59
4.15 Chart Showing Interpersonal Communication and
Relationships Contributes to An Organization
Productivity
61
4.16 Chart Showing Senior Management Treats the
Employees Fairly
63
4.17 Chart Showing Clearness of Goals and Objectives 65
4.18 Chart Showing Employees Are Free to Express Their
Views and Suggestions in Decision Making Process
and The Management Will Consider Their Views and
Suggestions
67
4.19 Chart showing enhance employees career growth 69
4.20 Chart Showing Equal Opportunity to Grow and
DevelopProfessionally And Personally
71
4.21 Chart showing newcomers are welcomed and
integrated quickly
73