SlideShare a Scribd company logo
1 of 27
Download to read offline
Berkshire’s Corporate Performance vs. the S&P 500

                                                                                                   Annual Percentage Change
                                                                                                in Per-Share      in S&P 500
                                                                                               Book Value of     with Dividends   Relative
                                                                                                  Berkshire         Included      Results
Year                                                                                                 (1)               (2)         (1)-(2)
1965    ...................................................                                           23.8             10.0          13.8
1966    ...................................................                                           20.3            (11.7)         32.0
1967    ...................................................                                           11.0             30.9         (19.9)
1968    ...................................................                                           19.0             11.0           8.0
1969    ...................................................                                           16.2             (8.4)         24.6
1970    ...................................................                                           12.0              3.9           8.1
1971    ...................................................                                           16.4             14.6           1.8
1972    ...................................................                                           21.7             18.9           2.8
1973    ...................................................                                             4.7           (14.8)         19.5
1974    ...................................................                                             5.5           (26.4)         31.9
1975    ...................................................                                           21.9             37.2         (15.3)
1976    ...................................................                                           59.3             23.6          35.7
1977    ...................................................                                           31.9             (7.4)         39.3
1978    ...................................................                                           24.0              6.4          17.6
1979    ...................................................                                           35.7             18.2          17.5
1980    ...................................................                                           19.3             32.3         (13.0)
1981    ...................................................                                           31.4             (5.0)         36.4
1982    ...................................................                                           40.0             21.4          18.6
1983    ...................................................                                           32.3             22.4           9.9
1984    ...................................................                                           13.6              6.1           7.5
1985    ...................................................                                           48.2             31.6          16.6
1986    ...................................................                                           26.1             18.6           7.5
1987    ...................................................                                           19.5              5.1          14.4
1988    ...................................................                                           20.1             16.6           3.5
1989    ...................................................                                           44.4             31.7          12.7
1990    ...................................................                                             7.4            (3.1)         10.5
1991    ...................................................                                           39.6             30.5           9.1
1992    ...................................................                                           20.3              7.6          12.7
1993    ...................................................                                           14.3             10.1           4.2
1994    ...................................................                                           13.9              1.3          12.6
1995    ...................................................                                           43.1             37.6           5.5
1996    ...................................................                                           31.8             23.0           8.8
1997    ...................................................                                           34.1             33.4            .7
1998    ...................................................                                           48.3             28.6          19.7
1999    ...................................................                                              .5            21.0         (20.5)
2000    ...................................................                                             6.5            (9.1)         15.6
2001    ...................................................                                            (6.2)          (11.9)          5.7
2002    ...................................................                                           10.0            (22.1)         32.1
2003    ...................................................                                           21.0             28.7          (7.7)
2004    ...................................................                                           10.5             10.9           (.4)
2005    ...................................................                                             6.4             4.9           1.5
2006    ...................................................                                           18.4             15.8           2.6
2007    ...................................................                                           11.0              5.5           5.5
2008    ...................................................                                            (9.6)          (37.0)         27.4
2009    ...................................................                                           19.8             26.5          (6.7)
2010    ...................................................                                           13.0             15.1          (2.1)
Compounded Annual Gain – 1965-2010 . . . . . . . . . . . . . . . . . . . . . . .                     20.2%              9.4%        10.8
Overall Gain – 1964-2010 . . . . . . . . . . . . . . . . . . . . . . . . . . . . . . . . . .      490,409%           6,262%
Notes: Data are for calendar years with these exceptions: 1965 and 1966, year ended 9/30; 1967, 15 months ended
12/31.
Starting in 1979, accounting rules required insurance companies to value the equity securities they hold at market
rather than at the lower of cost or market, which was previously the requirement. In this table, Berkshire’s results
through 1978 have been restated to conform to the changed rules. In all other respects, the results are calculated using
the numbers originally reported.
The S&P 500 numbers are pre-tax whereas the Berkshire numbers are after-tax. If a corporation such as Berkshire
were simply to have owned the S&P 500 and accrued the appropriate taxes, its results would have lagged the S&P 500
in years when that index showed a positive return, but would have exceeded the S&P 500 in years when the index
showed a negative return. Over the years, the tax costs would have caused the aggregate lag to be substantial.

                                                                              2
BERKSHIRE HATHAWAY INC.


To the Shareholders of Berkshire Hathaway Inc.:

          The per-share book value of both our Class A and Class B stock increased by 13% in 2010. Over the
last 46 years (that is, since present management took over), book value has grown from $19 to $95,453, a rate of
20.2% compounded annually.*

          The highlight of 2010 was our acquisition of Burlington Northern Santa Fe, a purchase that’s working
out even better than I expected. It now appears that owning this railroad will increase Berkshire’s “normal”
earning power by nearly 40% pre-tax and by well over 30% after-tax. Making this purchase increased our share
count by 6% and used $22 billion of cash. Since we’ve quickly replenished the cash, the economics of this
transaction have turned out very well.

          A “normal year,” of course, is not something that either Charlie Munger, Vice Chairman of Berkshire
and my partner, or I can define with anything like precision. But for the purpose of estimating our current earning
power, we are envisioning a year free of a mega-catastrophe in insurance and possessing a general business
climate somewhat better than that of 2010 but weaker than that of 2005 or 2006. Using these assumptions, and
several others that I will explain in the “Investment” section, I can estimate that the normal earning power of the
assets we currently own is about $17 billion pre-tax and $12 billion after-tax, excluding any capital gains or
losses. Every day Charlie and I think about how we can build on this base.

           Both of us are enthusiastic about BNSF’s future because railroads have major cost and environmental
advantages over trucking, their main competitor. Last year BNSF moved each ton of freight it carried a record
500 miles on a single gallon of diesel fuel. That’s three times more fuel-efficient than trucking is, which means
our railroad owns an important advantage in operating costs. Concurrently, our country gains because of reduced
greenhouse emissions and a much smaller need for imported oil. When traffic travels by rail, society benefits.

          Over time, the movement of goods in the United States will increase, and BNSF should get its full
share of the gain. The railroad will need to invest massively to bring about this growth, but no one is better
situated than Berkshire to supply the funds required. However slow the economy, or chaotic the markets, our
checks will clear.

           Last year – in the face of widespread pessimism about our economy – we demonstrated our enthusiasm
for capital investment at Berkshire by spending $6 billion on property and equipment. Of this amount,
$5.4 billion – or 90% of the total – was spent in the United States. Certainly our businesses will expand abroad in
the future, but an overwhelming part of their future investments will be at home. In 2011, we will set a new
record for capital spending – $8 billion – and spend all of the $2 billion increase in the United States.

           Money will always flow toward opportunity, and there is an abundance of that in America.
Commentators today often talk of “great uncertainty.” But think back, for example, to December 6,
1941, October 18, 1987 and September 10, 2001. No matter how serene today may be, tomorrow is always
uncertain.
          * All per-share figures used in this report apply to Berkshire’s A shares. Figures for the B shares are
1/1500th of those shown for A.

                                                        3
Don’t let that reality spook you. Throughout my lifetime, politicians and pundits have constantly
moaned about terrifying problems facing America. Yet our citizens now live an astonishing six times better than
when I was born. The prophets of doom have overlooked the all-important factor that is certain: Human potential
is far from exhausted, and the American system for unleashing that potential – a system that has worked wonders
for over two centuries despite frequent interruptions for recessions and even a Civil War – remains alive and
effective.

         We are not natively smarter than we were when our country was founded nor do we work harder. But
look around you and see a world beyond the dreams of any colonial citizen. Now, as in 1776, 1861, 1932 and
1941, America’s best days lie ahead.

Performance

          Charlie and I believe that those entrusted with handling the funds of others should establish
performance goals at the onset of their stewardship. Lacking such standards, managements are tempted to shoot
the arrow of performance and then paint the bull’s-eye around wherever it lands.

          In Berkshire’s case, we long ago told you that our job is to increase per-share intrinsic value at a rate
greater than the increase (including dividends) of the S&P 500. In some years we succeed; in others we fail. But,
if we are unable over time to reach that goal, we have done nothing for our investors, who by themselves could
have realized an equal or better result by owning an index fund.

          The challenge, of course, is the calculation of intrinsic value. Present that task to Charlie and me
separately, and you will get two different answers. Precision just isn’t possible.

          To eliminate subjectivity, we therefore use an understated proxy for intrinsic-value – book value –
when measuring our performance. To be sure, some of our businesses are worth far more than their carrying
value on our books. (Later in this report, we’ll present a case study.) But since that premium seldom swings
wildly from year to year, book value can serve as a reasonable device for tracking how we are doing.

          The table on page 2 shows our 46-year record against the S&P, a performance quite good in the earlier
years and now only satisfactory. The bountiful years, we want to emphasize, will never return. The huge sums of
capital we currently manage eliminate any chance of exceptional performance. We will strive, however, for
better-than-average results and feel it fair for you to hold us to that standard.

          Yearly figures, it should be noted, are neither to be ignored nor viewed as all-important. The pace of
the earth’s movement around the sun is not synchronized with the time required for either investment ideas or
operating decisions to bear fruit. At GEICO, for example, we enthusiastically spent $900 million last year on
advertising to obtain policyholders who deliver us no immediate profits. If we could spend twice that amount
productively, we would happily do so though short-term results would be further penalized. Many large
investments at our railroad and utility operations are also made with an eye to payoffs well down the road.

          To provide you a longer-term perspective on performance, we present on the facing page the yearly
figures from page 2 recast into a series of five-year periods. Overall, there are 42 of these periods, and they tell
an interesting story. On a comparative basis, our best years ended in the early 1980s. The market’s golden period,
however, came in the 17 following years, with Berkshire achieving stellar absolute returns even as our relative
advantage narrowed.

         After 1999, the market stalled (or have you already noticed that?). Consequently, the satisfactory
performance relative to the S&P that Berkshire has achieved since then has delivered only moderate absolute
results.

          Looking forward, we hope to average several points better than the S&P – though that result is, of
course, far from a sure thing. If we succeed in that aim, we will almost certainly produce better relative results in
bad years for the stock market and suffer poorer results in strong markets.

                                                         4
Berkshire’s Corporate Performance vs. the S&P 500 by Five-Year Periods

                                                                            Annual Percentage Change
                                                                         in Per-Share      in S&P 500
                                                                        Book Value of     with Dividends     Relative
                                                                           Berkshire         Included        Results
Five-Year Period                                                              (1)               (2)           (1)-(2)
1965-1969   ...............................................                  17.2                5.0           12.2
1966-1970   ...............................................                  14.7                3.9           10.8
1967-1971   ...............................................                  13.9                9.2            4.7
1968-1972   ...............................................                  16.8                7.5            9.3
1969-1973   ...............................................                  17.7                2.0           15.7
1970-1974   ...............................................                  15.0               (2.4)          17.4
1971-1975   ...............................................                  13.9                3.2           10.7
1972-1976   ...............................................                  20.8                4.9           15.9
1973-1977   ...............................................                  23.4               (0.2)          23.6
1974-1978   ...............................................                  24.4                4.3           20.1
1975-1979   ...............................................                  30.1               14.7           15.4
1976-1980   ...............................................                  33.4               13.9           19.5
1977-1981   ...............................................                  29.0                8.1           20.9
1978-1982   ...............................................                  29.9               14.1           15.8
1979-1983   ...............................................                  31.6               17.3           14.3
1980-1984   ...............................................                  27.0               14.8           12.2
1981-1985   ...............................................                  32.6               14.6           18.0
1982-1986   ...............................................                  31.5               19.8           11.7
1983-1987   ...............................................                  27.4               16.4           11.0
1984-1988   ...............................................                  25.0               15.2            9.8
1985-1989   ...............................................                  31.1               20.3           10.8
1986-1990   ...............................................                  22.9               13.1            9.8
1987-1991   ...............................................                  25.4               15.3           10.1
1988-1992   ...............................................                  25.6               15.8            9.8
1989-1993   ...............................................                  24.4               14.5            9.9
1990-1994   ...............................................                  18.6                8.7            9.9
1991-1995   ...............................................                  25.6               16.5            9.1
1992-1996   ...............................................                  24.2               15.2            9.0
1993-1997   ...............................................                  26.9               20.2            6.7
1994-1998   ...............................................                  33.7               24.0            9.7
1995-1999   ...............................................                  30.4               28.5            1.9
1996-2000   ...............................................                  22.9               18.3            4.6
1997-2001   ...............................................                  14.8               10.7            4.1
1998-2002   ...............................................                  10.4               (0.6)          11.0
1999-2003   ...............................................                   6.0               (0.6)           6.6
2000-2004   ...............................................                   8.0               (2.3)          10.3
2001-2005   ...............................................                   8.0                0.6            7.4
2002-2006   ...............................................                  13.1                6.2            6.9
2003-2007   ...............................................                  13.3               12.8            0.5
2004-2008   ...............................................                   6.9               (2.2)           9.1
2005-2009   ...............................................                   8.6                0.4            8.2
2006-2010   ...............................................                  10.0                2.3            7.7
Notes: The first two periods cover the five years beginning September 30 of the previous year. The third period covers
63 months beginning September 30, 1966 to December 31, 1971. All other periods involve calendar years.
The other notes on page 2 also apply to this table.


                                                          5
Intrinsic Value – Today and Tomorrow

         Though Berkshire’s intrinsic value cannot be precisely calculated, two of its three key pillars can be
measured. Charlie and I rely heavily on these measurements when we make our own estimates of Berkshire’s
value.

          The first component of value is our investments: stocks, bonds and cash equivalents. At yearend these
totaled $158 billion at market value.

           Insurance float – money we temporarily hold in our insurance operations that does not belong to us –
funds $66 billion of our investments. This float is “free” as long as insurance underwriting breaks even, meaning
that the premiums we receive equal the losses and expenses we incur. Of course, underwriting results are volatile,
swinging erratically between profits and losses. Over our entire history, though, we’ve been significantly
profitable, and I also expect us to average breakeven results or better in the future. If we do that, all of our
investments – those funded both by float and by retained earnings – can be viewed as an element of value for
Berkshire shareholders.

          Berkshire’s second component of value is earnings that come from sources other than investments and
insurance underwriting. These earnings are delivered by our 68 non-insurance companies, itemized on page 106.
In Berkshire’s early years, we focused on the investment side. During the past two decades, however, we’ve
increasingly emphasized the development of earnings from non-insurance businesses, a practice that will
continue.

          The following tables illustrate this shift. In the first table, we present per-share investments at decade
intervals beginning in 1970, three years after we entered the insurance business. We exclude those investments
applicable to minority interests.

                                             Per-Share                      Compounded Annual Increase
          Yearend                           Investments         Period        in Per-Share Investments
          1970   ...................          $    66
          1980   ...................              754         1970-1980                 27.5%
          1990   ...................            7,798         1980-1990                 26.3%
          2000   ...................           50,229         1990-2000                 20.5%
          2010   ...................           94,730         2000-2010                  6.6%

         Though our compounded annual increase in per-share investments was a healthy 19.9% over the
40-year period, our rate of increase has slowed sharply as we have focused on using funds to buy operating
businesses.

         The payoff from this shift is shown in the following table, which illustrates how earnings of our
non-insurance businesses have increased, again on a per-share basis and after applicable minority interests.

                                      Per-Share                           Compounded Annual Increase in
          Year                     Pre-Tax Earnings           Period       Per-Share Pre-Tax Earnings
          1970   ............          $    2.87
          1980   ............              19.01          1970-1980                   20.8%
          1990   ............             102.58          1980-1990                   18.4%
          2000   ............             918.66          1990-2000                   24.5%
          2010   ............           5,926.04          2000-2010                   20.5%


                                                          6
For the forty years, our compounded annual gain in pre-tax, non-insurance earnings per share is 21.0%.
During the same period, Berkshire’s stock price increased at a rate of 22.1% annually. Over time, you can expect
our stock price to move in rough tandem with Berkshire’s investments and earnings. Market price and intrinsic
value often follow very different paths – sometimes for extended periods – but eventually they meet.

          There is a third, more subjective, element to an intrinsic value calculation that can be either positive or
negative: the efficacy with which retained earnings will be deployed in the future. We, as well as many other
businesses, are likely to retain earnings over the next decade that will equal, or even exceed, the capital we presently
employ. Some companies will turn these retained dollars into fifty-cent pieces, others into two-dollar bills.

           This “what-will-they-do-with-the-money” factor must always be evaluated along with the
“what-do-we-have-now” calculation in order for us, or anybody, to arrive at a sensible estimate of a company’s
intrinsic value. That’s because an outside investor stands by helplessly as management reinvests his share of the
company’s earnings. If a CEO can be expected to do this job well, the reinvestment prospects add to the
company’s current value; if the CEO’s talents or motives are suspect, today’s value must be discounted. The
difference in outcome can be huge. A dollar of then-value in the hands of Sears Roebuck’s or Montgomery
Ward’s CEOs in the late 1960s had a far different destiny than did a dollar entrusted to Sam Walton.

                                                ************

           Charlie and I hope that the per-share earnings of our non-insurance businesses continue to increase at a
decent rate. But the job gets tougher as the numbers get larger. We will need both good performance from our
current businesses and more major acquisitions. We’re prepared. Our elephant gun has been reloaded, and my
trigger finger is itchy.

          Partially offsetting our anchor of size are several important advantages we have. First, we possess a
cadre of truly skilled managers who have an unusual commitment to their own operations and to Berkshire.
Many of our CEOs are independently wealthy and work only because they love what they do. They are
volunteers, not mercenaries. Because no one can offer them a job they would enjoy more, they can’t be lured
away.

           At Berkshire, managers can focus on running their businesses: They are not subjected to meetings at
headquarters nor financing worries nor Wall Street harassment. They simply get a letter from me every two years
(it’s reproduced on pages 104-105) and call me when they wish. And their wishes do differ: There are managers
to whom I have not talked in the last year, while there is one with whom I talk almost daily. Our trust is in people
rather than process. A “hire well, manage little” code suits both them and me.

         Berkshire’s CEOs come in many forms. Some have MBAs; others never finished college. Some use
budgets and are by-the-book types; others operate by the seat of their pants. Our team resembles a baseball squad
composed of all-stars having vastly different batting styles. Changes in our line-up are seldom required.

           Our second advantage relates to the allocation of the money our businesses earn. After meeting the
needs of those businesses, we have very substantial sums left over. Most companies limit themselves to
reinvesting funds within the industry in which they have been operating. That often restricts them, however, to a
“universe” for capital allocation that is both tiny and quite inferior to what is available in the wider world.
Competition for the few opportunities that are available tends to become fierce. The seller has the upper hand, as
a girl might if she were the only female at a party attended by many boys. That lopsided situation would be great
for the girl, but terrible for the boys.

          At Berkshire we face no institutional restraints when we deploy capital. Charlie and I are limited only
by our ability to understand the likely future of a possible acquisition. If we clear that hurdle – and frequently we
can’t – we are then able to compare any one opportunity against a host of others.


                                                           7
When I took control of Berkshire in 1965, I didn’t exploit this advantage. Berkshire was then only in
textiles, where it had in the previous decade lost significant money. The dumbest thing I could have done was to
pursue “opportunities” to improve and expand the existing textile operation – so for years that’s exactly what I
did. And then, in a final burst of brilliance, I went out and bought another textile company. Aaaaaaargh!
Eventually I came to my senses, heading first into insurance and then into other industries.

           There is even a supplement to this world-is-our-oyster advantage: In addition to evaluating the
attractions of one business against a host of others, we also measure businesses against opportunities available in
marketable securities, a comparison most managements don’t make. Often, businesses are priced ridiculously
high against what can likely be earned from investments in stocks or bonds. At such moments, we buy securities
and bide our time.

          Our flexibility in respect to capital allocation has accounted for much of our progress to date. We have
been able to take money we earn from, say, See’s Candies or Business Wire (two of our best-run businesses, but
also two offering limited reinvestment opportunities) and use it as part of the stake we needed to buy BNSF.

          Our final advantage is the hard-to-duplicate culture that permeates Berkshire. And in businesses,
culture counts.

          To start with, the directors who represent you think and act like owners. They receive token
compensation: no options, no restricted stock and, for that matter, virtually no cash. We do not provide them
directors and officers liability insurance, a given at almost every other large public company. If they mess up
with your money, they will lose their money as well. Leaving my holdings aside, directors and their families own
Berkshire shares worth more than $3 billion. Our directors, therefore, monitor Berkshire’s actions and results
with keen interest and an owner’s eye. You and I are lucky to have them as stewards.

         This same owner-orientation prevails among our managers. In many cases, these are people who have
sought out Berkshire as an acquirer for a business that they and their families have long owned. They came to us
with an owner’s mindset, and we provide an environment that encourages them to retain it. Having managers
who love their businesses is no small advantage.

          Cultures self-propagate. Winston Churchill once said, “You shape your houses and then they shape
you.” That wisdom applies to businesses as well. Bureaucratic procedures beget more bureaucracy, and imperial
corporate palaces induce imperious behavior. (As one wag put it, “You know you’re no longer CEO when you
get in the back seat of your car and it doesn’t move.”) At Berkshire’s “World Headquarters” our annual rent is
$270,212. Moreover, the home-office investment in furniture, art, Coke dispenser, lunch room, high-tech
equipment – you name it – totals $301,363. As long as Charlie and I treat your money as if it were our own,
Berkshire’s managers are likely to be careful with it as well.

          Our compensation programs, our annual meeting and even our annual reports are all designed with an
eye to reinforcing the Berkshire culture, and making it one that will repel and expel managers of a different bent.
This culture grows stronger every year, and it will remain intact long after Charlie and I have left the scene.

         We will need all of the strengths I’ve just described to do reasonably well. Our managers will deliver;
you can count on that. But whether Charlie and I can hold up our end in capital allocation depends in part on the
competitive environment for acquisitions. You will get our best efforts.

GEICO

          Now let me tell you a story that will help you understand how the intrinsic value of a business can far
exceed its book value. Relating this tale also gives me a chance to relive some great memories.

         Sixty years ago last month, GEICO entered my life, destined to shape it in a huge way. I was then a
20-year-old graduate student at Columbia, having elected to go there because my hero, Ben Graham, taught a
once-a-week class at the school.

                                                        8
One day at the library, I checked out Ben’s entry in Who’s Who in America and found he was
chairman of Government Employees Insurance Co. (now called GEICO). I knew nothing of insurance and had
never heard of the company. The librarian, however, steered me to a large compendium of insurers and, after
reading the page on GEICO, I decided to visit the company. The following Saturday, I boarded an early train for
Washington.

           Alas, when I arrived at the company’s headquarters, the building was closed. I then rather frantically
started pounding on a door, until finally a janitor appeared. I asked him if there was anyone in the office I could
talk to, and he steered me to the only person around, Lorimer Davidson.

         That was my lucky moment. During the next four hours, “Davy” gave me an education about both
insurance and GEICO. It was the beginning of a wonderful friendship. Soon thereafter, I graduated from
Columbia and became a stock salesman in Omaha. GEICO, of course, was my prime recommendation, which got
me off to a great start with dozens of customers. GEICO also jump-started my net worth because, soon after
meeting Davy, I made the stock 75% of my $9,800 investment portfolio. (Even so, I felt over-diversified.)

          Subsequently, Davy became CEO of GEICO, taking the company to undreamed-of heights before it got
into trouble in the mid-1970s, a few years after his retirement. When that happened – with the stock falling by
more than 95% – Berkshire bought about one-third of the company in the market, a position that over the years
increased to 50% because of GEICO’s repurchases of its own shares. Berkshire’s cost for this half of the business
was $46 million. (Despite the size of our position, we exercised no control over operations.)

         We then purchased the remaining 50% of GEICO at the beginning of 1996, which spurred Davy, at 95,
to make a video tape saying how happy he was that his beloved GEICO would permanently reside with
Berkshire. (He also playfully concluded with, “Next time, Warren, please make an appointment.”)

          A lot has happened at GEICO during the last 60 years, but its core goal – saving Americans substantial
money on their purchase of auto insurance – remains unchanged. (Try us at 1-800-847-7536 or
www.GEICO.com.) In other words, get the policyholder’s business by deserving his business. Focusing on this
objective, the company has grown to be America’s third-largest auto insurer, with a market share of 8.8%.

         When Tony Nicely, GEICO’s CEO, took over in 1993, that share was 2.0%, a level at which it had
been stuck for more than a decade. GEICO became a different company under Tony, finding a path to consistent
growth while simultaneously maintaining underwriting discipline and keeping its costs low.

          Let me quantify Tony’s achievement. When, in 1996, we bought the 50% of GEICO we didn’t already
own, it cost us about $2.3 billion. That price implied a value of $4.6 billion for 100%. GEICO then had tangible
net worth of $1.9 billion.

          The excess over tangible net worth of the implied value – $2.7 billion – was what we estimated
GEICO’s “goodwill” to be worth at that time. That goodwill represented the economic value of the policyholders
who were then doing business with GEICO. In 1995, those customers had paid the company $2.8 billion in
premiums. Consequently, we were valuing GEICO’s customers at about 97% (2.7/2.8) of what they were
annually paying the company. By industry standards, that was a very high price. But GEICO was no ordinary
insurer: Because of the company’s low costs, its policyholders were consistently profitable and unusually loyal.

           Today, premium volume is $14.3 billion and growing. Yet we carry the goodwill of GEICO on our
books at only $1.4 billion, an amount that will remain unchanged no matter how much the value of GEICO
increases. (Under accounting rules, you write down the carrying value of goodwill if its economic value
decreases, but leave it unchanged if economic value increases.) Using the 97%-of-premium-volume yardstick we
applied to our 1996 purchase, the real value today of GEICO’s economic goodwill is about $14 billion. And this
value is likely to be much higher ten and twenty years from now. GEICO – off to a strong start in 2011 – is the
gift that keeps giving.


                                                        9
One not-so-small footnote: Under Tony, GEICO has developed one of the country’s largest personal-
lines insurance agencies, which primarily sells homeowners policies to our GEICO auto insurance customers. In
this business, we represent a number of insurers that are not affiliated with us. They take the risk; we simply sign
up the customers. Last year we sold 769,898 new policies at this agency operation, up 34% from the year before.
The obvious way this activity aids us is that it produces commission revenue; equally important is the fact that it
further strengthens our relationship with our policyholders, helping us retain them.

          I owe an enormous debt to Tony and Davy (and, come to think of it, to that janitor as well).

                                               ************

          Now, let’s examine the four major sectors of Berkshire. Each has vastly different balance sheet and
income characteristics from the others. Lumping them together therefore impedes analysis. So we’ll present them
as four separate businesses, which is how Charlie and I view them.

         We will look first at insurance, Berkshire’s core operation and the engine that has propelled our
expansion over the years.

Insurance

          Property-casualty (“P/C”) insurers receive premiums upfront and pay claims later. In extreme cases,
such as those arising from certain workers’ compensation accidents, payments can stretch over decades. This
collect-now, pay-later model leaves us holding large sums – money we call “float” – that will eventually go to
others. Meanwhile, we get to invest this float for Berkshire’s benefit. Though individual policies and claims
come and go, the amount of float we hold remains remarkably stable in relation to premium volume.
Consequently, as our business grows, so does our float. And how we have grown: Just take a look at the
following table:

                                                                                      Float
                    Yearend                                                      (in $ millions)
                    1970   ........................................                  $    39
                    1980   ........................................                      237
                    1990   ........................................                    1,632
                    2000   ........................................                   27,871
                    2010   ........................................                   65,832

          If our premiums exceed the total of our expenses and eventual losses, we register an underwriting profit
that adds to the investment income that our float produces. When such a profit occurs, we enjoy the use of free
money – and, better yet, get paid for holding it. Alas, the wish of all insurers to achieve this happy result creates
intense competition, so vigorous in most years that it causes the P/C industry as a whole to operate at a
significant underwriting loss. This loss, in effect, is what the industry pays to hold its float. For example, State
Farm, by far the country’s largest insurer and a well-managed company, has incurred an underwriting loss in
seven of the last ten years. During that period, its aggregate underwriting loss was more than $20 billion.

           At Berkshire, we have now operated at an underwriting profit for eight consecutive years, our total
underwriting gain for the period having been $17 billion. I believe it likely that we will continue to underwrite
profitably in most – though certainly not all – future years. If we accomplish that, our float will be better than
cost-free. We will benefit just as we would if some party deposited $66 billion with us, paid us a fee for holding
its money and then let us invest its funds for our own benefit.


                                                         10
Let me emphasize again that cost-free float is not an outcome to be expected for the P/C industry as a
whole: In most years, industry premiums have been inadequate to cover claims plus expenses. Consequently, the
industry’s overall return on tangible equity has for many decades fallen far short of the average return realized by
American industry, a sorry performance almost certain to continue. Berkshire’s outstanding economics exist only
because we have some terrific managers running some unusual businesses. We’ve already told you about GEICO,
but we have two other very large operations, and a bevy of smaller ones as well, each a star in its own way.

                                                            ************

           First off is the Berkshire Hathaway Reinsurance Group, run by Ajit Jain. Ajit insures risks that no one
else has the desire or the capital to take on. His operation combines capacity, speed, decisiveness and, most
importantly, brains in a manner that is unique in the insurance business. Yet he never exposes Berkshire to risks
that are inappropriate in relation to our resources. Indeed, we are far more conservative than most large insurers
in that respect. In the past year, Ajit has significantly increased his life reinsurance operation, developing annual
premium volume of about $2 billion that will repeat for decades.

          From a standing start in 1985, Ajit has created an insurance business with float of $30 billion and
significant underwriting profits, a feat that no CEO of any other insurer has come close to matching. By his
accomplishments, he has added a great many billions of dollars to the value of Berkshire. Even kryptonite
bounces off Ajit.

                                                            ************

          We have another insurance powerhouse in General Re, managed by Tad Montross.

          At bottom, a sound insurance operation requires four disciplines: (1) An understanding of all exposures
that might cause a policy to incur losses; (2) A conservative evaluation of the likelihood of any exposure actually
causing a loss and the probable cost if it does; (3) The setting of a premium that will deliver a profit, on average,
after both prospective loss costs and operating expenses are covered; and (4) The willingness to walk away if the
appropriate premium can’t be obtained.

           Many insurers pass the first three tests and flunk the fourth. The urgings of Wall Street, pressures from
the agency force and brokers, or simply a refusal by a testosterone-driven CEO to accept shrinking volumes has
led too many insurers to write business at inadequate prices. “The other guy is doing it so we must as well” spells
trouble in any business, but none more so than insurance.

           Tad has observed all four of the insurance commandments, and it shows in his results. General Re’s huge
float has been better than cost-free under his leadership, and we expect that, on average, it will continue to be.

                                                            ************

           Finally, we own a group of smaller companies, most of them specializing in odd corners of the
insurance world. In aggregate, their results have consistently been profitable and, as the table below shows, the
float they provide us is substantial. Charlie and I treasure these companies and their managers.

          Here is the record of all four segments of our property-casualty and life insurance businesses:

                                                                    Underwriting Profit           Yearend Float
                                                                                    (in millions)
          Insurance Operations                                       2010        2009          2010         2009
          General Re . . . . . . . . . . . . . . . . . . . . . .    $ 452       $ 477         $20,049      $21,014
          BH Reinsurance . . . . . . . . . . . . . . . . . .           176         250         30,370       27,753
          GEICO . . . . . . . . . . . . . . . . . . . . . . . . .    1,117         649         10,272        9,613
          Other Primary . . . . . . . . . . . . . . . . . . .          268          84          5,141        5,061
                                                                    $2,013      $1,460        $65,832      $63,441

          Among large insurance operations, Berkshire’s impresses me as the best in the world.

                                                                     11
Manufacturing, Service and Retailing Operations

          Our activities in this part of Berkshire cover the waterfront. Let’s look, though, at a summary balance
sheet and earnings statement for the entire group.

                                                      Balance Sheet 12/31/10 (in millions)

Assets                                                                         Liabilities and Equity
Cash and equivalents . . . . . . . . . . . . . . . . .          $ 2,673        Notes payable . . . . . . . . . . . . . . . . . . . . . . .        $ 1,805
Accounts and notes receivable . . . . . . . . . .                 5,396        Other current liabilities . . . . . . . . . . . . . . .              8,169
Inventory . . . . . . . . . . . . . . . . . . . . . . . . . .     7,101        Total current liabilities . . . . . . . . . . . . . . . .            9,974
Other current assets . . . . . . . . . . . . . . . . . .            550
Total current assets . . . . . . . . . . . . . . . . . . .       15,720
Goodwill and other intangibles . . . . . . . . .                 16,976        Deferred taxes . . . . . . . . . . . . . . . . . . . . . .           3,001
Fixed assets . . . . . . . . . . . . . . . . . . . . . . . .     15,421        Term debt and other liabilities . . . . . . . . . .                  6,621
Other assets . . . . . . . . . . . . . . . . . . . . . . . .      3,029        Equity . . . . . . . . . . . . . . . . . . . . . . . . . . . . .    31,550
                                                                $51,146                                                                           $51,146


                                                         Earnings Statement (in millions)
                                                                                                                    2010            2009           2008
Revenues . . . . . . . . . . . . . . . . . . . . . . . . . . . . . . . . . . . . . . . . . . . . . . . . . . . . . . . . .
                                                                                                                   $66,610         $61,665        $66,099
Operating expenses (including depreciation of $1,362 in 2010, $1,422 in 2009
   and $1,280 in 2008) . . . . . . . . . . . . . . . . . . . . . . . . . . . . . . . . . . . . . . . . . . . . . . .        62,225  59,509  61,937
Interest expense . . . . . . . . . . . . . . . . . . . . . . . . . . . . . . . . . . . . . . . . . . . . . . . . . . . .       111      98     139
Pre-tax earnings . . . . . . . . . . . . . . . . . . . . . . . . . . . . . . . . . . . . . . . . . . . . . . . . . . . .     4,274*  2,058*  4,023*
Income taxes and non-controlling interests . . . . . . . . . . . . . . . . . . . . . . . . . . . . . . .                     1,812     945   1,740
Net earnings . . . . . . . . . . . . . . . . . . . . . . . . . . . . . . . . . . . . . . . . . . . . . . . . . . . . . . . $ 2,462 $ 1,113 $ 2,283


*Does not include purchase-accounting adjustments.

           This group of companies sells products ranging from lollipops to jet airplanes. Some of the businesses
enjoy terrific economics, measured by earnings on unleveraged net tangible assets that run from 25% after-tax to
more than 100%. Others produce good returns in the area of 12-20%. Unfortunately, a few have very poor
returns, a result of some serious mistakes I have made in my job of capital allocation. These errors came about
because I misjudged either the competitive strength of the business I was purchasing or the future economics of
the industry in which it operated. I try to look out ten or twenty years when making an acquisition, but sometimes
my eyesight has been poor.

            Most of the companies in this section improved their earnings last year and four set records. Let’s look
first at the record-breakers.

        •     TTI, our electronic components distributor, had sales 21% above its previous high (recorded in 2008)
              and pre-tax earnings that topped its earlier record by 58%. Its sales gains spanned three continents, with
              North America at 16%, Europe at 26%, and Asia at 50%. The thousands of items TTI distributes are
              pedestrian, many selling for less than a dollar. The magic of TTI’s exceptional performance is created
              by Paul Andrews, its CEO, and his associates.


                                                                          12
•   Forest River, our RV and boat manufacturer, had record sales of nearly $2 billion and record earnings
          as well. Forest River has 82 plants, and I have yet to visit one (or the home office, for that matter).
          There’s no need; Pete Liegl, the company’s CEO, runs a terrific operation. Come view his products at
          the annual meeting. Better yet, buy one.

      •   CTB, our farm-equipment company, again set an earnings record. I told you in the 2008 Annual Report
          about Vic Mancinelli, the company’s CEO. He just keeps getting better. Berkshire paid $140 million
          for CTB in 2002. It has since paid us dividends of $160 million and eliminated $40 million of debt.
          Last year it earned $106 million pre-tax. Productivity gains have produced much of this increase. When
          we bought CTB, sales per employee were $189,365; now they are $405,878.

      •   Would you believe shoes? H. H. Brown, run by Jim Issler and best known for its Born brand, set a new
          record for sales and earnings (helped by its selling 1,110 pairs of shoes at our annual meeting). Jim has
          brilliantly adapted to major industry changes. His work, I should mention, is overseen by Frank
          Rooney, 89, a superb businessman and still a dangerous fellow with whom to have a bet on the golf
          course.

           A huge story in this sector’s year-to-year improvement occurred at NetJets. I can’t overstate the
breadth and importance of Dave Sokol’s achievements at this company, the leading provider of fractional
ownership of jet airplanes. NetJets has long been an operational success, owning a 2010 market share five times
that of its nearest competitor. Our overwhelming leadership stems from a wonderful team of pilots, mechanics
and service personnel. This crew again did its job in 2010, with customer satisfaction, as delineated in our regular
surveys, hitting new highs.

          Even though NetJets was consistently a runaway winner with customers, our financial results, since its
acquisition in 1998, were a failure. In the 11 years through 2009, the company reported an aggregate pre-tax loss
of $157 million, a figure that was far understated since borrowing costs at NetJets were heavily subsidized by its
free use of Berkshire’s credit. Had NetJets been operating on a stand-alone basis, its loss over the years would
have been several hundreds of millions greater.

          We are now charging NetJets an appropriate fee for Berkshire’s guarantee. Despite this fee (which
came to $38 million in 2010), NetJets earned $207 million pre-tax in 2010, a swing of $918 million from 2009.
Dave’s quick restructuring of management and the company’s rationalization of its purchasing and spending
policies has ended the hemorrhaging of cash and turned what was Berkshire’s only major business problem into a
solidly profitable operation.

           Dave has meanwhile maintained NetJets’ industry-leading reputation for safety and service. In many
important ways, our training and operational standards are considerably stronger than those required by the FAA.
Maintaining top-of-the-line standards is the right thing to do, but I also have a selfish reason for championing this
policy. My family and I have flown more than 5,000 hours on NetJets (that’s equal to being airborne 24 hours a
day for seven months) and will fly thousands of hours more in the future. We receive no special treatment and
have used a random mix of at least 100 planes and 300 crews. Whichever the plane or crew, we always know we
are flying with the best-trained pilots in private aviation.

         The largest earner in our manufacturing, service and retailing sector is Marmon, a collection of 130
businesses. We will soon increase our ownership in this company to 80% by carrying out our scheduled purchase
of 17% of its stock from the Pritzker family. The cost will be about $1.5 billion. We will then purchase the
remaining Pritzker holdings in 2013 or 2014, whichever date is selected by the family. Frank Ptak runs Marmon
wonderfully, and we look forward to 100% ownership.


                                                         13
Next to Marmon, the two largest earners in this sector are Iscar and McLane. Both had excellent years.
In 2010, Grady Rosier’s McLane entered the wine and spirits distribution business to supplement its $32 billion
operation as a distributor of food products, cigarettes, candy and sundries. In purchasing Empire Distributors, an
operator in Georgia and North Carolina, we teamed up with David Kahn, the company’s dynamic CEO. David is
leading our efforts to expand geographically. By yearend he had already made his first acquisition, Horizon Wine
and Spirits in Tennessee.

         At Iscar, profits were up 159% in 2010, and we may well surpass pre-recession levels in 2011. Sales
are improving throughout the world, particularly in Asia. Credit Eitan Wertheimer, Jacob Harpaz and Danny
Goldman for an exceptional performance, one far superior to that of Iscar’s main competitors.

         All that is good news. Our businesses related to home construction, however, continue to struggle.
Johns Manville, MiTek, Shaw and Acme Brick have maintained their competitive positions, but their profits are
far below the levels of a few years ago. Combined, these operations earned $362 million pre-tax in 2010
compared to $1.3 billion in 2006, and their employment has fallen by about 9,400.

          A housing recovery will probably begin within a year or so. In any event, it is certain to occur at some
point. Consequently: (1) At MiTek, we have made, or committed to, five bolt-on acquisitions during the past
eleven months; (2) At Acme, we just recently acquired the leading manufacturer of brick in Alabama for
$50 million; (3) Johns Manville is building a $55 million roofing membrane plant in Ohio, to be completed next
year; and (4) Shaw will spend $200 million in 2011 on plant and equipment, all of it situated in America. These
businesses entered the recession strong and will exit it stronger. At Berkshire, our time horizon is forever.

Regulated, Capital-Intensive Businesses

           We have two very large businesses, BNSF and MidAmerican Energy, with important common
characteristics that distinguish them from our many others. Consequently, we give them their own sector in this
letter and split out their financial statistics in our GAAP balance sheet and income statement.

           A key characteristic of both companies is the huge investment they have in very long-lived, regulated
assets, with these funded by large amounts of long-term debt that is not guaranteed by Berkshire. Our credit is
not needed: Both businesses have earning power that, even under very adverse business conditions, amply covers
their interest requirements. For example, in recessionary 2010 with BNSF’s car loadings far off peak levels, the
company’s interest coverage was 6:1.

          Both companies are heavily regulated, and both will have a never-ending need to make major
investments in plant and equipment. Both also need to provide efficient, customer-satisfying service to earn the
respect of their communities and regulators. In return, both need to be assured that they will be allowed to earn
reasonable earnings on future capital investments.

          Earlier I explained just how important railroads are to our country’s future. Rail moves 42% of
America’s inter-city freight, measured by ton-miles, and BNSF moves more than any other railroad – about 28%
of the industry total. A little math will tell you that more than 11% of all inter-city ton-miles of freight in the U.S.
is transported by BNSF. Given the shift of population to the West, our share may well inch higher.

           All of this adds up to a huge responsibility. We are a major and essential part of the American
economy’s circulatory system, obliged to constantly maintain and improve our 23,000 miles of track along with
its ancillary bridges, tunnels, engines and cars. In carrying out this job, we must anticipate society’s needs, not
merely react to them. Fulfilling our societal obligation, we will regularly spend far more than our depreciation,
with this excess amounting to $2 billion in 2011. I’m confident we will earn appropriate returns on our huge
incremental investments. Wise regulation and wise investment are two sides of the same coin.

          At MidAmerican, we participate in a similar “social compact.” We are expected to put up ever-
increasing sums to satisfy the future needs of our customers. If we meanwhile operate reliably and efficiently, we
know that we will obtain a fair return on these investments.

                                                          14
MidAmerican supplies 2.4 million customers in the U.S. with electricity, operating as the largest
supplier in Iowa, Wyoming and Utah and as an important provider in other states as well. Our pipelines transport
8% of the country’s natural gas. Obviously, many millions of Americans depend on us every day.

          MidAmerican has delivered outstanding results for both its owners (Berkshire’s interest is 89.8%) and its
customers. Shortly after MidAmerican purchased Northern Natural Gas pipeline in 2002, that company’s
performance as a pipeline was rated dead last, 43 out of 43, by the leading authority in the field. In the most recent
report published, Northern Natural was ranked second. The top spot was held by our other pipeline, Kern River.

           In its electric business, MidAmerican has a comparable record. Iowa rates have not increased since we
purchased our operation there in 1999. During the same period, the other major electric utility in the state has
raised prices more than 70% and now has rates far above ours. In certain metropolitan areas in which the two
utilities operate side by side, electric bills of our customers run far below those of their neighbors. I am told that
comparable houses sell at higher prices in these cities if they are located in our service area.

           MidAmerican will have 2,909 megawatts of wind generation in operation by the end of 2011, more
than any other regulated electric utility in the country. The total amount that MidAmerican has invested or
committed to wind is a staggering $5.4 billion. We can make this sort of investment because MidAmerican
retains all of its earnings, unlike other utilities that generally pay out most of what they earn.

         As you can tell by now, I am proud of what has been accomplished for our society by Matt Rose at
BNSF and by David Sokol and Greg Abel at MidAmerican. I am also both proud and grateful for what they have
accomplished for Berkshire shareholders. Below are the relevant figures:

MidAmerican                                                                                                                               Earnings (in millions)
                                                                                                                                            2010        2009
U.K. utilities . . . . . . . . . . . . . . . . . . . . . . . . . . . . . . . . . . . . . . . . . . . . . . . . . . . . . . . . . . . .     $ 333       $ 248
Iowa utility . . . . . . . . . . . . . . . . . . . . . . . . . . . . . . . . . . . . . . . . . . . . . . . . . . . . . . . . . . . . .       279         285
Western utilities . . . . . . . . . . . . . . . . . . . . . . . . . . . . . . . . . . . . . . . . . . . . . . . . . . . . . . . . .          783         788
Pipelines . . . . . . . . . . . . . . . . . . . . . . . . . . . . . . . . . . . . . . . . . . . . . . . . . . . . . . . . . . . . . . .      378         457
HomeServices . . . . . . . . . . . . . . . . . . . . . . . . . . . . . . . . . . . . . . . . . . . . . . . . . . . . . . . . . . .            42          43
Other (net) . . . . . . . . . . . . . . . . . . . . . . . . . . . . . . . . . . . . . . . . . . . . . . . . . . . . . . . . . . . . . .       47          25
Operating earnings before corporate interest and taxes . . . . . . . . . . . . . . . . . . . . . . . . . . .                                1,862        1,846
Interest, other than to Berkshire . . . . . . . . . . . . . . . . . . . . . . . . . . . . . . . . . . . . . . . . . . . . .                  (323)        (318)
Interest on Berkshire junior debt . . . . . . . . . . . . . . . . . . . . . . . . . . . . . . . . . . . . . . . . . . . . .                   (30)         (58)
Income tax . . . . . . . . . . . . . . . . . . . . . . . . . . . . . . . . . . . . . . . . . . . . . . . . . . . . . . . . . . . . . .       (271)        (313)
Net earnings . . . . . . . . . . . . . . . . . . . . . . . . . . . . . . . . . . . . . . . . . . . . . . . . . . . . . . . . . . . . .     $1,238      $1,157

Earnings applicable to Berkshire* . . . . . . . . . . . . . . . . . . . . . . . . . . . . . . . . . . . . . . . . . . .                    $1,131      $1,071

*Includes interest earned by Berkshire (net of related income taxes) of $19 in 2010 and $38 in 2009.

BNSF
(Historical accounting through 2/12/10; purchase accounting subsequently)                                                                     (in millions)
                                                                                                                                            2010         2009
Revenues . . . . . . . . . . . . . . . . . . . . . . . . . . . . . . . . . . . . . . . . . . . . . . . . . . . . . . . . . . . . . . .    $16,850      $14,016
Operating earnings . . . . . . . . . . . . . . . . . . . . . . . . . . . . . . . . . . . . . . . . . . . . . . . . . . . . . . .            4,495        3,254
Interest (Net) . . . . . . . . . . . . . . . . . . . . . . . . . . . . . . . . . . . . . . . . . . . . . . . . . . . . . . . . . . . .        507          613
Pre-Tax earnings . . . . . . . . . . . . . . . . . . . . . . . . . . . . . . . . . . . . . . . . . . . . . . . . . . . . . . . . .          3,988        2,641
Net earnings . . . . . . . . . . . . . . . . . . . . . . . . . . . . . . . . . . . . . . . . . . . . . . . . . . . . . . . . . . . . .      2,459        1,721


                                                                                    15
Finance and Financial Products

         This, our smallest sector, includes two rental companies, XTRA (trailers) and CORT (furniture), and
Clayton Homes, the country’s leading producer and financer of manufactured homes.

          Both of our leasing businesses improved their performances last year, albeit from a very low base.
XTRA increased the utilization of its equipment from 63% in 2009 to 75% in 2010, thereby raising pre-tax
earnings to $35 million from $17 million in 2009. CORT experienced a pickup in business as the year progressed
and also significantly tightened its operations. The combination increased its pre-tax results from a loss of
$3 million in 2009 to $18 million of profit in 2010.

          At Clayton, we produced 23,343 homes, 47% of the industry’s total of 50,046. Contrast this to the peak
year of 1998, when 372,843 homes were manufactured. (We then had an industry share of 8%.) Sales would have
been terrible last year under any circumstances, but the financing problems I commented upon in the 2009 report
continue to exacerbate the distress. To explain: Home-financing policies of our government, expressed through
the loans found acceptable by FHA, Freddie Mac and Fannie Mae, favor site-built homes and work to negate the
price advantage that manufactured homes offer.

          We finance more manufactured-home buyers than any other company. Our experience, therefore,
should be instructive to those parties preparing to overhaul our country’s home-loan practices. Let’s take a look.

         Clayton owns 200,804 mortgages that it originated. (It also has some mortgage portfolios that it
purchased.) At the origination of these contracts, the average FICO score of our borrowers was 648, and 47%
were 640 or below. Your banker will tell you that people with such scores are generally regarded as questionable
credits.

          Nevertheless, our portfolio has performed well during conditions of stress. Here’s our loss experience
during the last five years for originated loans:

                                                                  Net Losses as a Percentage
                    Year                                               of Average Loans
                    2006   ..............................                     1.53%
                    2007   ..............................                     1.27%
                    2008   ..............................                     1.17%
                    2009   ..............................                     1.86%
                    2010   ..............................                     1.72%

           Our borrowers get in trouble when they lose their jobs, have health problems, get divorced, etc. The
recession has hit them hard. But they want to stay in their homes, and generally they borrowed sensible amounts
in relation to their income. In addition, we were keeping the originated mortgages for our own account, which
means we were not securitizing or otherwise reselling them. If we were stupid in our lending, we were going to
pay the price. That concentrates the mind.

           If home buyers throughout the country had behaved like our buyers, America would not have had the
crisis that it did. Our approach was simply to get a meaningful down-payment and gear fixed monthly payments
to a sensible percentage of income. This policy kept Clayton solvent and also kept buyers in their homes.

           Home ownership makes sense for most Americans, particularly at today’s lower prices and bargain
interest rates. All things considered, the third best investment I ever made was the purchase of my home, though I
would have made far more money had I instead rented and used the purchase money to buy stocks. (The two best
investments were wedding rings.) For the $31,500 I paid for our house, my family and I gained 52 years of
terrific memories with more to come.


                                                       16
But a house can be a nightmare if the buyer’s eyes are bigger than his wallet and if a lender – often
protected by a government guarantee – facilitates his fantasy. Our country’s social goal should not be to put
families into the house of their dreams, but rather to put them into a house they can afford.

Investments

           Below we show our common stock investments that at yearend had a market value of more than
$1 billion.

                                                                                                                        12/31/10
                                                                                                            Percentage of
                                                                                                              Company
    Shares                                           Company                                                   Owned        Cost *     Market
                                                                                                                              (in millions)
 151,610,700     American Express Company . . . . . . . . . . . . . . . . . . . . . . . .                       12.6       $ 1,287 $ 6,507
 225,000,000     BYD Company, Ltd. . . . . . . . . . . . . . . . . . . . . . . . . . . . . . .                   9.9           232       1,182
 200,000,000     The Coca-Cola Company . . . . . . . . . . . . . . . . . . . . . . . . . .                       8.6         1,299      13,154
  29,109,637     ConocoPhillips . . . . . . . . . . . . . . . . . . . . . . . . . . . . . . . . . .              2.0         2,028       1,982
  45,022,563     Johnson & Johnson . . . . . . . . . . . . . . . . . . . . . . . . . . . . . . .                 1.6         2,749       2,785
  97,214,584     Kraft Foods Inc. . . . . . . . . . . . . . . . . . . . . . . . . . . . . . . . . .              5.6         3,207       3,063
  19,259,600     Munich Re . . . . . . . . . . . . . . . . . . . . . . . . . . . . . . . . . . . . . .          10.5         2,896       2,924
   3,947,555     POSCO . . . . . . . . . . . . . . . . . . . . . . . . . . . . . . . . . . . . . . . .           4.6           768       1,706
  72,391,036     The Procter & Gamble Company . . . . . . . . . . . . . . . . . . . .                            2.6           464       4,657
  25,848,838     Sanofi-Aventis . . . . . . . . . . . . . . . . . . . . . . . . . . . . . . . . . .              2.0         2,060       1,656
 242,163,773     Tesco plc . . . . . . . . . . . . . . . . . . . . . . . . . . . . . . . . . . . . . . .         3.0         1,414       1,608
  78,060,769     U.S. Bancorp . . . . . . . . . . . . . . . . . . . . . . . . . . . . . . . . . . . .            4.1         2,401       2,105
  39,037,142     Wal-Mart Stores, Inc. . . . . . . . . . . . . . . . . . . . . . . . . . . . . .                 1.1         1,893       2,105
 358,936,125     Wells Fargo & Company . . . . . . . . . . . . . . . . . . . . . . . . . .                       6.8         8,015      11,123
                 Others . . . . . . . . . . . . . . . . . . . . . . . . . . . . . . . . . . . . . . . . .                    3,020       4,956
                 Total Common Stocks Carried at Market . . . . . . . . . . . . . .                                         $33,733    $61,513


          *This is our actual purchase price and also our tax basis; GAAP “cost” differs in a few cases because of
           write-ups or write-downs that have been required.

           In our reported earnings we reflect only the dividends our portfolio companies pay us. Our share of the
undistributed earnings of these investees, however, was more than $2 billion last year. These retained earnings
are important. In our experience – and, for that matter, in the experience of investors over the past century –
undistributed earnings have been either matched or exceeded by market gains, albeit in a highly irregular manner.
(Indeed, sometimes the correlation goes in reverse. As one investor said in 2009: “This is worse than divorce.
I’ve lost half my net worth – and I still have my wife.”) In the future, we expect our market gains to eventually at
least equal the earnings our investees retain.

                                                           ************

          In our earlier estimate of Berkshire’s normal earning power, we made three adjustments that relate to
future investment income (but did not include anything for the undistributed earnings factor I have just
described).

          The first adjustment was decidedly negative. Last year, we discussed five large fixed-income
investments that have been contributing substantial sums to our reported earnings. One of these – our Swiss Re
note – was redeemed in the early days of 2011, and two others – our Goldman Sachs and General Electric
preferred stocks – are likely to be gone by yearend. General Electric is entitled to call our preferred in October
and has stated its intention to do so. Goldman Sachs has the right to call our preferred on 30 days notice, but has
been held back by the Federal Reserve (bless it!), which unfortunately will likely give Goldman the green light
before long.

                                                                          17
All three of the companies redeeming must pay us a premium to do so – in aggregate about $1.4 billion –
but all of the redemptions are nevertheless unwelcome. After they occur, our earning power will be significantly
reduced. That’s the bad news.

          There are two probable offsets. At yearend we held $38 billion of cash equivalents that have been
earning a pittance throughout 2010. At some point, however, better rates will return. They will add at least
$500 million – and perhaps much more – to our investment income. That sort of increase in money-market yields
is unlikely to come soon. It is appropriate, nevertheless, for us to include improved rates in an estimate of
“normal” earning power. Even before higher rates come about, furthermore, we could get lucky and find an
opportunity to use some of our cash hoard at decent returns. That day can’t come too soon for me: To update
Aesop, a girl in a convertible is worth five in the phone book.

           In addition, dividends on our current common stock holdings will almost certainly increase. The largest
gain is likely to come at Wells Fargo. The Federal Reserve, our friend in respect to Goldman Sachs, has frozen
dividend levels at major banks, whether strong or weak, during the last two years. Wells Fargo, though
consistently prospering throughout the worst of the recession and currently enjoying enormous financial strength
and earning power, has therefore been forced to maintain an artificially low payout. (We don’t fault the Fed: For
various reasons, an across-the-board freeze made sense during the crisis and its immediate aftermath.)

          At some point, probably soon, the Fed’s restrictions will cease. Wells Fargo can then reinstate the
rational dividend policy that its owners deserve. At that time, we would expect our annual dividends from just
this one security to increase by several hundreds of millions of dollars annually.

          Other companies we hold are likely to increase their dividends as well. Coca-Cola paid us $88 million
in 1995, the year after we finished purchasing the stock. Every year since, Coke has increased its dividend. In
2011, we will almost certainly receive $376 million from Coke, up $24 million from last year. Within ten years, I
would expect that $376 million to double. By the end of that period, I wouldn’t be surprised to see our share of
Coke’s annual earnings exceed 100% of what we paid for the investment. Time is the friend of the wonderful
business.

         Overall, I believe our “normal” investment income will at least equal what we realized in 2010, though
the redemptions I described will cut our take in 2011 and perhaps 2012 as well.

                                               ************

          Last summer, Lou Simpson told me he wished to retire. Since Lou was a mere 74 – an age Charlie and
I regard as appropriate only for trainees at Berkshire – his call was a surprise.

          Lou joined GEICO as its investment manager in 1979, and his service to that company has been
invaluable. In the 2004 Annual Report, I detailed his record with equities, and I have omitted updates only
because his performance made mine look bad. Who needs that?

         Lou has never been one to advertise his talents. But I will: Simply put, Lou is one of the investment
greats. We will miss him.

                                               ************

          Four years ago, I told you that we needed to add one or more younger investment managers to carry on
when Charlie, Lou and I weren’t around. At that time we had multiple outstanding candidates immediately
available for my CEO job (as we do now), but we did not have backup in the investment area.

           It’s easy to identify many investment managers with great recent records. But past results, though
important, do not suffice when prospective performance is being judged. How the record has been achieved is
crucial, as is the manager’s understanding of – and sensitivity to – risk (which in no way should be measured by
beta, the choice of too many academics). In respect to the risk criterion, we were looking for someone with a
hard-to-evaluate skill: the ability to anticipate the effects of economic scenarios not previously observed. Finally,
we wanted someone who would regard working for Berkshire as far more than a job.

                                                         18
When Charlie and I met Todd Combs, we knew he fit our requirements. Todd, as was the case with
Lou, will be paid a salary plus a contingent payment based on his performance relative to the S&P. We have
arrangements in place for deferrals and carryforwards that will prevent see-saw performance being met by
undeserved payments. The hedge-fund world has witnessed some terrible behavior by general partners who have
received huge payouts on the upside and who then, when bad results occurred, have walked away rich, with their
limited partners losing back their earlier gains. Sometimes these same general partners thereafter quickly started
another fund so that they could immediately participate in future profits without having to overcome their past
losses. Investors who put money with such managers should be labeled patsies, not partners.


          As long as I am CEO, I will continue to manage the great majority of Berkshire’s holdings, both bonds
and equities. Todd initially will manage funds in the range of one to three billion dollars, an amount he can reset
annually. His focus will be equities but he is not restricted to that form of investment. (Fund consultants like to
require style boxes such as “long-short,” “macro,” “international equities.” At Berkshire our only style box is
“smart.”)


          Over time, we may add one or two investment managers if we find the right individuals. Should we do
that, we will probably have 80% of each manager’s performance compensation be dependent on his or her own
portfolio and 20% on that of the other manager(s). We want a compensation system that pays off big for
individual success but that also fosters cooperation, not competition.


          When Charlie and I are no longer around, our investment manager(s) will have responsibility for the
entire portfolio in a manner then set by the CEO and Board of Directors. Because good investors bring a useful
perspective to the purchase of businesses, we would expect them to be consulted – but not to have a vote – on the
wisdom of possible acquisitions. In the end, of course, the Board will make the call on any major acquisition.


         One footnote: When we issued a press release about Todd’s joining us, a number of commentators
pointed out that he was “little-known” and expressed puzzlement that we didn’t seek a “big-name.” I wonder
how many of them would have known of Lou in 1979, Ajit in 1985, or, for that matter, Charlie in 1959. Our goal
was to find a 2-year-old Secretariat, not a 10-year-old Seabiscuit. (Whoops – that may not be the smartest
metaphor for an 80-year-old CEO to use.)


Derivatives


          Two years ago, in the 2008 Annual Report, I told you that Berkshire was a party to 251 derivatives
contracts (other than those used for operations at our subsidiaries, such as MidAmerican, and the few left over at
Gen Re). Today, the comparable number is 203, a figure reflecting both a few additions to our portfolio and the
unwinding or expiration of some contracts.


           Our continuing positions, all of which I am personally responsible for, fall largely into two categories.
We view both categories as engaging us in insurance-like activities in which we receive premiums for assuming
risks that others wish to shed. Indeed, the thought processes we employ in these derivatives transactions are
identical to those we use in our insurance business. You should also understand that we get paid up-front when
we enter into the contracts and therefore run no counterparty risk. That’s important.


         Our first category of derivatives consists of a number of contracts, written in 2004-2008, that required
payments by us if there were bond defaults by companies included in certain high-yield indices. With minor
exceptions, we were exposed to these risks for five years, with each contract covering 100 companies.


           In aggregate, we received premiums of $3.4 billion for these contracts. When I originally told you in
our 2007 Annual Report about them, I said that I expected the contracts would deliver us an “underwriting
profit,” meaning that our losses would be less than the premiums we received. In addition, I said we would
benefit from the use of float.

                                                        19
Subsequently, as you know too well, we encountered both a financial panic and a severe recession. A
number of the companies in the high-yield indices failed, which required us to pay losses of $2.5 billion. Today,
however, our exposure is largely behind us because most of our higher-risk contracts have expired. Consequently, it
appears almost certain that we will earn an underwriting profit as we originally anticipated. In addition, we have had
the use of interest-free float that averaged about $2 billion over the life of the contracts. In short, we charged the
right premium, and that protected us when business conditions turned terrible three years ago.

           Our other large derivatives position – whose contracts go by the name of “equity puts” – involves
insurance we wrote for parties wishing to protect themselves against a possible decline in equity prices in the
U.S., U.K., Europe and Japan. These contracts are tied to various equity indices, such as the S&P 500 in the U.S.
and the FTSE 100 in the U.K. In the 2004-2008 period, we received $4.8 billion of premiums for 47 of these
contracts, most of which ran for 15 years. On these contracts, only the price of the indices on the termination date
counts: No payments can be required before then.

         As a first step in updating you about these contracts, I can report that late in 2010, at the instigation of
our counterparty, we unwound eight contracts, all of them due between 2021 and 2028. We had originally
received $647 million in premiums for these contracts, and the unwinding required us to pay $425 million.
Consequently, we realized a gain of $222 million and also had the interest-free and unrestricted use of that
$647 million for about three years.

           Those 2010 transactions left us with 39 equity put contracts remaining on our books at yearend. On
these, at their initiation, we received premiums of $4.2 billion.

           The future of these contracts is, of course, uncertain. But here is one perspective on them. If the prices
of the relevant indices are the same at the contract expiration dates as these prices were on December 31, 2010 –
and foreign exchange rates are unchanged – we would owe $3.8 billion on expirations occurring from 2018 to
2026. You can call this amount “settlement value.”

           On our yearend balance sheet, however, we carry the liability for those remaining equity puts at
$6.7 billion. In other words, if the prices of the relevant indices remain unchanged from that date, we will record
a $2.9 billion gain in the years to come, that being the difference between the liability figure of $6.7 billion and
the settlement value of $3.8 billion. I believe that equity prices will very likely increase and that our liability will
fall significantly between now and settlement date. If so, our gain from this point will be even greater. But that,
of course, is far from a sure thing.

          What is sure is that we will have the use of our remaining “float” of $4.2 billion for an average of about
10 more years. (Neither this float nor that arising from the high-yield contracts is included in the insurance float
figure of $66 billion.) Since money is fungible, think of a portion of these funds as contributing to the purchase
of BNSF.

           As I have told you before, almost all of our derivatives contracts are free of any obligation to post
collateral – a fact that cut the premiums we could otherwise have charged. But that fact also left us feeling
comfortable during the financial crisis, allowing us in those days to commit to some advantageous purchases.
Foregoing some additional derivatives premiums proved to be well worth it.

On Reporting and Misreporting: The Numbers That Count and Those That Don’t

         Earlier in this letter, I pointed out some numbers that Charlie and I find useful in valuing Berkshire and
measuring its progress.

          Let’s focus here on a number we omitted, but which many in the media feature above all others: net
income. Important though that number may be at most companies, it is almost always meaningless at Berkshire.
Regardless of how our businesses might be doing, Charlie and I could – quite legally – cause net income in any
given period to be almost any number we would like.

                                                          20
We have that flexibility because realized gains or losses on investments go into the net income figure,
whereas unrealized gains (and, in most cases, losses) are excluded. For example, imagine that Berkshire had a
$10 billion increase in unrealized gains in a given year and concurrently had $1 billion of realized losses. Our net
income – which would count only the loss – would be reported as less than our operating income. If we had
meanwhile realized gains in the previous year, headlines might proclaim that our earnings were down X% when
in reality our business might be much improved.

          If we really thought net income important, we could regularly feed realized gains into it simply because
we have a huge amount of unrealized gains upon which to draw. Rest assured, though, that Charlie and I have
never sold a security because of the effect a sale would have on the net income we were soon to report. We both
have a deep disgust for “game playing” with numbers, a practice that was rampant throughout corporate America
in the 1990s and still persists, though it occurs less frequently and less blatantly than it used to.

          Operating earnings, despite having some shortcomings, are in general a reasonable guide as to how our
businesses are doing. Ignore our net income figure, however. Regulations require that we report it to you. But if
you find reporters focusing on it, that will speak more to their performance than ours.

           Both realized and unrealized gains and losses are fully reflected in the calculation of our book value.
Pay attention to the changes in that metric and to the course of our operating earnings, and you will be on the
right track.

                                               ************

            As a p.s., I can’t resist pointing out just how capricious reported net income can be. Had our equity puts
had a termination date of June 30, 2010, we would have been required to pay $6.4 billion to our counterparties at
that date. Security prices then generally rose in the next quarter, a move that brought the corresponding figure
down to $5.8 billion on September 30th. Yet the Black-Scholes formula that we use in valuing these contracts
required us to increase our balance-sheet liability during this period from $8.9 billion to $9.6 billion, a change
that, after the effect of tax accruals, reduced our net income for the quarter by $455 million.

          Both Charlie and I believe that Black-Scholes produces wildly inappropriate values when applied to
long-dated options. We set out one absurd example in these pages two years ago. More tangibly, we put our
money where our mouth was by entering into our equity put contracts. By doing so, we implicitly asserted that
the Black-Scholes calculations used by our counterparties or their customers were faulty.

           We continue, nevertheless, to use that formula in presenting our financial statements. Black-Scholes is
the accepted standard for option valuation – almost all leading business schools teach it – and we would be
accused of shoddy accounting if we deviated from it. Moreover, we would present our auditors with an
insurmountable problem were we to do that: They have clients who are our counterparties and who use Black-
Scholes values for the same contracts we hold. It would be impossible for our auditors to attest to the accuracy of
both their values and ours were the two far apart.

          Part of the appeal of Black-Scholes to auditors and regulators is that it produces a precise number.
Charlie and I can’t supply one of those. We believe the true liability of our contracts to be far lower than that
calculated by Black-Scholes, but we can’t come up with an exact figure – anymore than we can come up with a
precise value for GEICO, BNSF, or for Berkshire Hathaway itself. Our inability to pinpoint a number doesn’t
bother us: We would rather be approximately right than precisely wrong.

          John Kenneth Galbraith once slyly observed that economists were most economical with ideas: They
made the ones learned in graduate school last a lifetime. University finance departments often behave similarly.
Witness the tenacity with which almost all clung to the theory of efficient markets throughout the 1970s and
1980s, dismissively calling powerful facts that refuted it “anomalies.” (I always love explanations of that kind:
The Flat Earth Society probably views a ship’s circling of the globe as an annoying, but inconsequential,
anomaly.)

                                                         21
Academics’ current practice of teaching Black-Scholes as revealed truth needs re-examination. For that
matter, so does the academic’s inclination to dwell on the valuation of options. You can be highly successful as
an investor without having the slightest ability to value an option. What students should be learning is how to
value a business. That’s what investing is all about.

Life and Debt

          The fundamental principle of auto racing is that to finish first, you must first finish. That dictum is
equally applicable to business and guides our every action at Berkshire.

           Unquestionably, some people have become very rich through the use of borrowed money. However,
that’s also been a way to get very poor. When leverage works, it magnifies your gains. Your spouse thinks you’re
clever, and your neighbors get envious. But leverage is addictive. Once having profited from its wonders, very
few people retreat to more conservative practices. And as we all learned in third grade – and some relearned in
2008 – any series of positive numbers, however impressive the numbers may be, evaporates when multiplied by a
single zero. History tells us that leverage all too often produces zeroes, even when it is employed by very smart
people.

          Leverage, of course, can be lethal to businesses as well. Companies with large debts often assume that
these obligations can be refinanced as they mature. That assumption is usually valid. Occasionally, though, either
because of company-specific problems or a worldwide shortage of credit, maturities must actually be met by
payment. For that, only cash will do the job.

          Borrowers then learn that credit is like oxygen. When either is abundant, its presence goes unnoticed.
When either is missing, that’s all that is noticed. Even a short absence of credit can bring a company to its knees.
In September 2008, in fact, its overnight disappearance in many sectors of the economy came dangerously close
to bringing our entire country to its knees.

           Charlie and I have no interest in any activity that could pose the slightest threat to Berkshire’s well-
being. (With our having a combined age of 167, starting over is not on our bucket list.) We are forever conscious
of the fact that you, our partners, have entrusted us with what in many cases is a major portion of your savings. In
addition, important philanthropy is dependent on our prudence. Finally, many disabled victims of accidents
caused by our insureds are counting on us to deliver sums payable decades from now. It would be irresponsible
for us to risk what all these constituencies need just to pursue a few points of extra return.

          A little personal history may partially explain our extreme aversion to financial adventurism. I didn’t
meet Charlie until he was 35, though he grew up within 100 yards of where I have lived for 52 years and also
attended the same inner-city public high school in Omaha from which my father, wife, children and two
grandchildren graduated. Charlie and I did, however, both work as young boys at my grandfather’s grocery store,
though our periods of employment were separated by about five years. My grandfather’s name was Ernest, and
perhaps no man was more aptly named. No one worked for Ernest, even as a stock boy, without being shaped by
the experience.

          On the facing page you can read a letter sent in 1939 by Ernest to his youngest son, my Uncle Fred.
Similar letters went to his other four children. I still have the letter sent to my Aunt Alice, which I found – along
with $1,000 of cash – when, as executor of her estate, I opened her safe deposit box in 1970.

          Ernest never went to business school – he never in fact finished high school – but he understood the
importance of liquidity as a condition for assured survival. At Berkshire, we have taken his $1,000 solution a bit
further and have pledged that we will hold at least $10 billion of cash, excluding that held at our regulated utility
and railroad businesses. Because of that commitment, we customarily keep at least $20 billion on hand so that we
can both withstand unprecedented insurance losses (our largest to date having been about $3 billion from Katrina,
the insurance industry’s most expensive catastrophe) and quickly seize acquisition or investment opportunities,
even during times of financial turmoil.


                                                         22
23
Buffett 2010ltr
Buffett 2010ltr
Buffett 2010ltr
Buffett 2010ltr
Buffett 2010ltr

More Related Content

What's hot

Technical Report: Mount Bisson Property (Rare Earth Industries)
Technical Report: Mount Bisson Property (Rare Earth Industries)Technical Report: Mount Bisson Property (Rare Earth Industries)
Technical Report: Mount Bisson Property (Rare Earth Industries)Rocky Mountain Rare Metal Belt
 
Fateful Triangle-The United States, Israel & The Palestinians
Fateful Triangle-The United States, Israel & The PalestiniansFateful Triangle-The United States, Israel & The Palestinians
Fateful Triangle-The United States, Israel & The PalestiniansYousef al-Khattab
 
Peraturan Permainan FIBA 2017
Peraturan Permainan FIBA 2017Peraturan Permainan FIBA 2017
Peraturan Permainan FIBA 2017Jimmy L
 
Geological characterization and hazard assessment of a selected unstable rock...
Geological characterization and hazard assessment of a selected unstable rock...Geological characterization and hazard assessment of a selected unstable rock...
Geological characterization and hazard assessment of a selected unstable rock...Maryam Izadifar
 
Biblical Dream Study Nineteen Hours of Study in Allegorical Context
Biblical Dream Study Nineteen Hours of Study in Allegorical ContextBiblical Dream Study Nineteen Hours of Study in Allegorical Context
Biblical Dream Study Nineteen Hours of Study in Allegorical ContextSister Lara
 
The complete book of poses for artists a comprehensive photographic and illus...
The complete book of poses for artists a comprehensive photographic and illus...The complete book of poses for artists a comprehensive photographic and illus...
The complete book of poses for artists a comprehensive photographic and illus...MariGiopato
 
Planning Commission Opposition Brief - 2015-3-23_Appellee_PC_Opposition_Brief...
Planning Commission Opposition Brief - 2015-3-23_Appellee_PC_Opposition_Brief...Planning Commission Opposition Brief - 2015-3-23_Appellee_PC_Opposition_Brief...
Planning Commission Opposition Brief - 2015-3-23_Appellee_PC_Opposition_Brief...Kara Nelson
 
The causes and effects of cultural eutrophication at Quidenham Mere, Norfolk,...
The causes and effects of cultural eutrophication at Quidenham Mere, Norfolk,...The causes and effects of cultural eutrophication at Quidenham Mere, Norfolk,...
The causes and effects of cultural eutrophication at Quidenham Mere, Norfolk,...Sophie Studley
 
Crimes against humanity emergence of a law of humanity -mag. jur. thesis
Crimes against humanity emergence of a law of humanity  -mag. jur. thesis Crimes against humanity emergence of a law of humanity  -mag. jur. thesis
Crimes against humanity emergence of a law of humanity -mag. jur. thesis muhsina23
 
Gospel of Matthew Authorship of the Bible and Textual Variants
Gospel of Matthew Authorship of the Bible and Textual VariantsGospel of Matthew Authorship of the Bible and Textual Variants
Gospel of Matthew Authorship of the Bible and Textual VariantsSister Lara
 
2001 The Life of Jacob - LECTURE NOTES
2001 The Life of Jacob - LECTURE NOTES2001 The Life of Jacob - LECTURE NOTES
2001 The Life of Jacob - LECTURE NOTESZaki Luke Swem Beba
 
Financial modeling for managers with excel applications 2nd edition
Financial modeling for managers   with excel applications  2nd editionFinancial modeling for managers   with excel applications  2nd edition
Financial modeling for managers with excel applications 2nd editionHung Pham Thai
 

What's hot (20)

Kaza tourism final_lr
Kaza tourism final_lrKaza tourism final_lr
Kaza tourism final_lr
 
Technical Report: Mount Bisson Property (Rare Earth Industries)
Technical Report: Mount Bisson Property (Rare Earth Industries)Technical Report: Mount Bisson Property (Rare Earth Industries)
Technical Report: Mount Bisson Property (Rare Earth Industries)
 
References
ReferencesReferences
References
 
Fateful Triangle-The United States, Israel & The Palestinians
Fateful Triangle-The United States, Israel & The PalestiniansFateful Triangle-The United States, Israel & The Palestinians
Fateful Triangle-The United States, Israel & The Palestinians
 
Peraturan Permainan FIBA 2017
Peraturan Permainan FIBA 2017Peraturan Permainan FIBA 2017
Peraturan Permainan FIBA 2017
 
Scriptie def single
Scriptie def singleScriptie def single
Scriptie def single
 
Official basketball rules_2014_y
Official basketball rules_2014_yOfficial basketball rules_2014_y
Official basketball rules_2014_y
 
Geological characterization and hazard assessment of a selected unstable rock...
Geological characterization and hazard assessment of a selected unstable rock...Geological characterization and hazard assessment of a selected unstable rock...
Geological characterization and hazard assessment of a selected unstable rock...
 
Biblical Dream Study Nineteen Hours of Study in Allegorical Context
Biblical Dream Study Nineteen Hours of Study in Allegorical ContextBiblical Dream Study Nineteen Hours of Study in Allegorical Context
Biblical Dream Study Nineteen Hours of Study in Allegorical Context
 
The complete book of poses for artists a comprehensive photographic and illus...
The complete book of poses for artists a comprehensive photographic and illus...The complete book of poses for artists a comprehensive photographic and illus...
The complete book of poses for artists a comprehensive photographic and illus...
 
Planning Commission Opposition Brief - 2015-3-23_Appellee_PC_Opposition_Brief...
Planning Commission Opposition Brief - 2015-3-23_Appellee_PC_Opposition_Brief...Planning Commission Opposition Brief - 2015-3-23_Appellee_PC_Opposition_Brief...
Planning Commission Opposition Brief - 2015-3-23_Appellee_PC_Opposition_Brief...
 
The causes and effects of cultural eutrophication at Quidenham Mere, Norfolk,...
The causes and effects of cultural eutrophication at Quidenham Mere, Norfolk,...The causes and effects of cultural eutrophication at Quidenham Mere, Norfolk,...
The causes and effects of cultural eutrophication at Quidenham Mere, Norfolk,...
 
Crimes against humanity emergence of a law of humanity -mag. jur. thesis
Crimes against humanity emergence of a law of humanity  -mag. jur. thesis Crimes against humanity emergence of a law of humanity  -mag. jur. thesis
Crimes against humanity emergence of a law of humanity -mag. jur. thesis
 
97 3rdqr
97 3rdqr97 3rdqr
97 3rdqr
 
Tally Reporting & MIS
Tally Reporting & MISTally Reporting & MIS
Tally Reporting & MIS
 
Gospel of Matthew Authorship of the Bible and Textual Variants
Gospel of Matthew Authorship of the Bible and Textual VariantsGospel of Matthew Authorship of the Bible and Textual Variants
Gospel of Matthew Authorship of the Bible and Textual Variants
 
ETB - Templates
ETB - TemplatesETB - Templates
ETB - Templates
 
2001 The Life of Jacob - LECTURE NOTES
2001 The Life of Jacob - LECTURE NOTES2001 The Life of Jacob - LECTURE NOTES
2001 The Life of Jacob - LECTURE NOTES
 
Shri guruji a new era
Shri guruji   a new eraShri guruji   a new era
Shri guruji a new era
 
Financial modeling for managers with excel applications 2nd edition
Financial modeling for managers   with excel applications  2nd editionFinancial modeling for managers   with excel applications  2nd edition
Financial modeling for managers with excel applications 2nd edition
 

Similar to Buffett 2010ltr

Berkshire’s Corporate Performance vs. the S&P 500Annual Pe.docx
Berkshire’s Corporate Performance vs. the S&P 500Annual Pe.docxBerkshire’s Corporate Performance vs. the S&P 500Annual Pe.docx
Berkshire’s Corporate Performance vs. the S&P 500Annual Pe.docxikirkton
 
Berkshire’s Performance vs. the S&P 500Annual Percentage C.docx
Berkshire’s Performance vs. the S&P 500Annual Percentage C.docxBerkshire’s Performance vs. the S&P 500Annual Percentage C.docx
Berkshire’s Performance vs. the S&P 500Annual Percentage C.docxikirkton
 
Berkshire’s Performance vs. the S&P 500Annual Percentage C
Berkshire’s Performance vs. the S&P 500Annual Percentage CBerkshire’s Performance vs. the S&P 500Annual Percentage C
Berkshire’s Performance vs. the S&P 500Annual Percentage CChantellPantoja184
 
【東京海洋大学】平成19年環境報告書
【東京海洋大学】平成19年環境報告書【東京海洋大学】平成19年環境報告書
【東京海洋大学】平成19年環境報告書env59
 
Shipboard training manual
Shipboard training manualShipboard training manual
Shipboard training manualgclme
 
engineering_manual.pdf
engineering_manual.pdfengineering_manual.pdf
engineering_manual.pdfssuserd84d2b
 
Pmma 技術資料(物性編)mt01
Pmma 技術資料(物性編)mt01Pmma 技術資料(物性編)mt01
Pmma 技術資料(物性編)mt01Chia Ang
 
Undergraduate Mapping Dissertation
Undergraduate Mapping Dissertation Undergraduate Mapping Dissertation
Undergraduate Mapping Dissertation JackConnor11
 
latest_ wasit rp data collection report_korrektur_ar
latest_ wasit  rp data collection report_korrektur_arlatest_ wasit  rp data collection report_korrektur_ar
latest_ wasit rp data collection report_korrektur_arbsv-bup
 
Buku pintar migas indonesia
Buku pintar migas indonesiaBuku pintar migas indonesia
Buku pintar migas indonesiaAsep Imam
 
Gbr Version 060209 Addendum
Gbr Version 060209 AddendumGbr Version 060209 Addendum
Gbr Version 060209 Addendummatthromatka
 
Concept mapping patient initials, age, gender and admitting d
Concept mapping patient initials, age, gender and admitting dConcept mapping patient initials, age, gender and admitting d
Concept mapping patient initials, age, gender and admitting dARIV4
 
American standard version_pdf_bible_ot_nt
American standard version_pdf_bible_ot_ntAmerican standard version_pdf_bible_ot_nt
American standard version_pdf_bible_ot_ntBiblesForYOU
 
Applications Of Dynamic Pricing (5.05.05)
Applications Of Dynamic Pricing (5.05.05)Applications Of Dynamic Pricing (5.05.05)
Applications Of Dynamic Pricing (5.05.05)lmaurer
 
Cooperative Station Observations - 1989
Cooperative Station Observations - 1989Cooperative Station Observations - 1989
Cooperative Station Observations - 1989indiawrm
 

Similar to Buffett 2010ltr (20)

Berkshire’s Corporate Performance vs. the S&P 500Annual Pe.docx
Berkshire’s Corporate Performance vs. the S&P 500Annual Pe.docxBerkshire’s Corporate Performance vs. the S&P 500Annual Pe.docx
Berkshire’s Corporate Performance vs. the S&P 500Annual Pe.docx
 
Berkshire’s Performance vs. the S&P 500Annual Percentage C.docx
Berkshire’s Performance vs. the S&P 500Annual Percentage C.docxBerkshire’s Performance vs. the S&P 500Annual Percentage C.docx
Berkshire’s Performance vs. the S&P 500Annual Percentage C.docx
 
Berkshire’s Performance vs. the S&P 500Annual Percentage C
Berkshire’s Performance vs. the S&P 500Annual Percentage CBerkshire’s Performance vs. the S&P 500Annual Percentage C
Berkshire’s Performance vs. the S&P 500Annual Percentage C
 
20110616
2011061620110616
20110616
 
Stronghold manual
Stronghold manualStronghold manual
Stronghold manual
 
CASE Network Report 40 - The Episodes of Currency Crises in the European Tran...
CASE Network Report 40 - The Episodes of Currency Crises in the European Tran...CASE Network Report 40 - The Episodes of Currency Crises in the European Tran...
CASE Network Report 40 - The Episodes of Currency Crises in the European Tran...
 
【東京海洋大学】平成19年環境報告書
【東京海洋大学】平成19年環境報告書【東京海洋大学】平成19年環境報告書
【東京海洋大学】平成19年環境報告書
 
Shipboard training manual
Shipboard training manualShipboard training manual
Shipboard training manual
 
engineering_manual.pdf
engineering_manual.pdfengineering_manual.pdf
engineering_manual.pdf
 
Earthquake report
Earthquake reportEarthquake report
Earthquake report
 
Pmma 技術資料(物性編)mt01
Pmma 技術資料(物性編)mt01Pmma 技術資料(物性編)mt01
Pmma 技術資料(物性編)mt01
 
Undergraduate Mapping Dissertation
Undergraduate Mapping Dissertation Undergraduate Mapping Dissertation
Undergraduate Mapping Dissertation
 
latest_ wasit rp data collection report_korrektur_ar
latest_ wasit  rp data collection report_korrektur_arlatest_ wasit  rp data collection report_korrektur_ar
latest_ wasit rp data collection report_korrektur_ar
 
Buku pintar migas indonesia
Buku pintar migas indonesiaBuku pintar migas indonesia
Buku pintar migas indonesia
 
Gbr Version 060209 Addendum
Gbr Version 060209 AddendumGbr Version 060209 Addendum
Gbr Version 060209 Addendum
 
Concept mapping patient initials, age, gender and admitting d
Concept mapping patient initials, age, gender and admitting dConcept mapping patient initials, age, gender and admitting d
Concept mapping patient initials, age, gender and admitting d
 
American standard version_pdf_bible_ot_nt
American standard version_pdf_bible_ot_ntAmerican standard version_pdf_bible_ot_nt
American standard version_pdf_bible_ot_nt
 
General physics
General physicsGeneral physics
General physics
 
Applications Of Dynamic Pricing (5.05.05)
Applications Of Dynamic Pricing (5.05.05)Applications Of Dynamic Pricing (5.05.05)
Applications Of Dynamic Pricing (5.05.05)
 
Cooperative Station Observations - 1989
Cooperative Station Observations - 1989Cooperative Station Observations - 1989
Cooperative Station Observations - 1989
 

Buffett 2010ltr

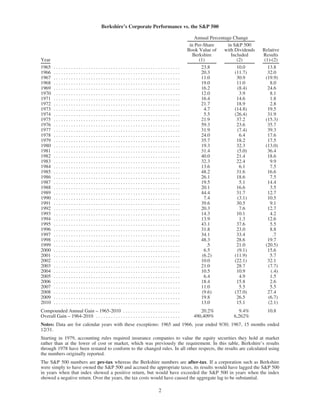
  • 1. Berkshire’s Corporate Performance vs. the S&P 500 Annual Percentage Change in Per-Share in S&P 500 Book Value of with Dividends Relative Berkshire Included Results Year (1) (2) (1)-(2) 1965 ................................................... 23.8 10.0 13.8 1966 ................................................... 20.3 (11.7) 32.0 1967 ................................................... 11.0 30.9 (19.9) 1968 ................................................... 19.0 11.0 8.0 1969 ................................................... 16.2 (8.4) 24.6 1970 ................................................... 12.0 3.9 8.1 1971 ................................................... 16.4 14.6 1.8 1972 ................................................... 21.7 18.9 2.8 1973 ................................................... 4.7 (14.8) 19.5 1974 ................................................... 5.5 (26.4) 31.9 1975 ................................................... 21.9 37.2 (15.3) 1976 ................................................... 59.3 23.6 35.7 1977 ................................................... 31.9 (7.4) 39.3 1978 ................................................... 24.0 6.4 17.6 1979 ................................................... 35.7 18.2 17.5 1980 ................................................... 19.3 32.3 (13.0) 1981 ................................................... 31.4 (5.0) 36.4 1982 ................................................... 40.0 21.4 18.6 1983 ................................................... 32.3 22.4 9.9 1984 ................................................... 13.6 6.1 7.5 1985 ................................................... 48.2 31.6 16.6 1986 ................................................... 26.1 18.6 7.5 1987 ................................................... 19.5 5.1 14.4 1988 ................................................... 20.1 16.6 3.5 1989 ................................................... 44.4 31.7 12.7 1990 ................................................... 7.4 (3.1) 10.5 1991 ................................................... 39.6 30.5 9.1 1992 ................................................... 20.3 7.6 12.7 1993 ................................................... 14.3 10.1 4.2 1994 ................................................... 13.9 1.3 12.6 1995 ................................................... 43.1 37.6 5.5 1996 ................................................... 31.8 23.0 8.8 1997 ................................................... 34.1 33.4 .7 1998 ................................................... 48.3 28.6 19.7 1999 ................................................... .5 21.0 (20.5) 2000 ................................................... 6.5 (9.1) 15.6 2001 ................................................... (6.2) (11.9) 5.7 2002 ................................................... 10.0 (22.1) 32.1 2003 ................................................... 21.0 28.7 (7.7) 2004 ................................................... 10.5 10.9 (.4) 2005 ................................................... 6.4 4.9 1.5 2006 ................................................... 18.4 15.8 2.6 2007 ................................................... 11.0 5.5 5.5 2008 ................................................... (9.6) (37.0) 27.4 2009 ................................................... 19.8 26.5 (6.7) 2010 ................................................... 13.0 15.1 (2.1) Compounded Annual Gain – 1965-2010 . . . . . . . . . . . . . . . . . . . . . . . 20.2% 9.4% 10.8 Overall Gain – 1964-2010 . . . . . . . . . . . . . . . . . . . . . . . . . . . . . . . . . . 490,409% 6,262% Notes: Data are for calendar years with these exceptions: 1965 and 1966, year ended 9/30; 1967, 15 months ended 12/31. Starting in 1979, accounting rules required insurance companies to value the equity securities they hold at market rather than at the lower of cost or market, which was previously the requirement. In this table, Berkshire’s results through 1978 have been restated to conform to the changed rules. In all other respects, the results are calculated using the numbers originally reported. The S&P 500 numbers are pre-tax whereas the Berkshire numbers are after-tax. If a corporation such as Berkshire were simply to have owned the S&P 500 and accrued the appropriate taxes, its results would have lagged the S&P 500 in years when that index showed a positive return, but would have exceeded the S&P 500 in years when the index showed a negative return. Over the years, the tax costs would have caused the aggregate lag to be substantial. 2
  • 2. BERKSHIRE HATHAWAY INC. To the Shareholders of Berkshire Hathaway Inc.: The per-share book value of both our Class A and Class B stock increased by 13% in 2010. Over the last 46 years (that is, since present management took over), book value has grown from $19 to $95,453, a rate of 20.2% compounded annually.* The highlight of 2010 was our acquisition of Burlington Northern Santa Fe, a purchase that’s working out even better than I expected. It now appears that owning this railroad will increase Berkshire’s “normal” earning power by nearly 40% pre-tax and by well over 30% after-tax. Making this purchase increased our share count by 6% and used $22 billion of cash. Since we’ve quickly replenished the cash, the economics of this transaction have turned out very well. A “normal year,” of course, is not something that either Charlie Munger, Vice Chairman of Berkshire and my partner, or I can define with anything like precision. But for the purpose of estimating our current earning power, we are envisioning a year free of a mega-catastrophe in insurance and possessing a general business climate somewhat better than that of 2010 but weaker than that of 2005 or 2006. Using these assumptions, and several others that I will explain in the “Investment” section, I can estimate that the normal earning power of the assets we currently own is about $17 billion pre-tax and $12 billion after-tax, excluding any capital gains or losses. Every day Charlie and I think about how we can build on this base. Both of us are enthusiastic about BNSF’s future because railroads have major cost and environmental advantages over trucking, their main competitor. Last year BNSF moved each ton of freight it carried a record 500 miles on a single gallon of diesel fuel. That’s three times more fuel-efficient than trucking is, which means our railroad owns an important advantage in operating costs. Concurrently, our country gains because of reduced greenhouse emissions and a much smaller need for imported oil. When traffic travels by rail, society benefits. Over time, the movement of goods in the United States will increase, and BNSF should get its full share of the gain. The railroad will need to invest massively to bring about this growth, but no one is better situated than Berkshire to supply the funds required. However slow the economy, or chaotic the markets, our checks will clear. Last year – in the face of widespread pessimism about our economy – we demonstrated our enthusiasm for capital investment at Berkshire by spending $6 billion on property and equipment. Of this amount, $5.4 billion – or 90% of the total – was spent in the United States. Certainly our businesses will expand abroad in the future, but an overwhelming part of their future investments will be at home. In 2011, we will set a new record for capital spending – $8 billion – and spend all of the $2 billion increase in the United States. Money will always flow toward opportunity, and there is an abundance of that in America. Commentators today often talk of “great uncertainty.” But think back, for example, to December 6, 1941, October 18, 1987 and September 10, 2001. No matter how serene today may be, tomorrow is always uncertain. * All per-share figures used in this report apply to Berkshire’s A shares. Figures for the B shares are 1/1500th of those shown for A. 3
  • 3. Don’t let that reality spook you. Throughout my lifetime, politicians and pundits have constantly moaned about terrifying problems facing America. Yet our citizens now live an astonishing six times better than when I was born. The prophets of doom have overlooked the all-important factor that is certain: Human potential is far from exhausted, and the American system for unleashing that potential – a system that has worked wonders for over two centuries despite frequent interruptions for recessions and even a Civil War – remains alive and effective. We are not natively smarter than we were when our country was founded nor do we work harder. But look around you and see a world beyond the dreams of any colonial citizen. Now, as in 1776, 1861, 1932 and 1941, America’s best days lie ahead. Performance Charlie and I believe that those entrusted with handling the funds of others should establish performance goals at the onset of their stewardship. Lacking such standards, managements are tempted to shoot the arrow of performance and then paint the bull’s-eye around wherever it lands. In Berkshire’s case, we long ago told you that our job is to increase per-share intrinsic value at a rate greater than the increase (including dividends) of the S&P 500. In some years we succeed; in others we fail. But, if we are unable over time to reach that goal, we have done nothing for our investors, who by themselves could have realized an equal or better result by owning an index fund. The challenge, of course, is the calculation of intrinsic value. Present that task to Charlie and me separately, and you will get two different answers. Precision just isn’t possible. To eliminate subjectivity, we therefore use an understated proxy for intrinsic-value – book value – when measuring our performance. To be sure, some of our businesses are worth far more than their carrying value on our books. (Later in this report, we’ll present a case study.) But since that premium seldom swings wildly from year to year, book value can serve as a reasonable device for tracking how we are doing. The table on page 2 shows our 46-year record against the S&P, a performance quite good in the earlier years and now only satisfactory. The bountiful years, we want to emphasize, will never return. The huge sums of capital we currently manage eliminate any chance of exceptional performance. We will strive, however, for better-than-average results and feel it fair for you to hold us to that standard. Yearly figures, it should be noted, are neither to be ignored nor viewed as all-important. The pace of the earth’s movement around the sun is not synchronized with the time required for either investment ideas or operating decisions to bear fruit. At GEICO, for example, we enthusiastically spent $900 million last year on advertising to obtain policyholders who deliver us no immediate profits. If we could spend twice that amount productively, we would happily do so though short-term results would be further penalized. Many large investments at our railroad and utility operations are also made with an eye to payoffs well down the road. To provide you a longer-term perspective on performance, we present on the facing page the yearly figures from page 2 recast into a series of five-year periods. Overall, there are 42 of these periods, and they tell an interesting story. On a comparative basis, our best years ended in the early 1980s. The market’s golden period, however, came in the 17 following years, with Berkshire achieving stellar absolute returns even as our relative advantage narrowed. After 1999, the market stalled (or have you already noticed that?). Consequently, the satisfactory performance relative to the S&P that Berkshire has achieved since then has delivered only moderate absolute results. Looking forward, we hope to average several points better than the S&P – though that result is, of course, far from a sure thing. If we succeed in that aim, we will almost certainly produce better relative results in bad years for the stock market and suffer poorer results in strong markets. 4
  • 4. Berkshire’s Corporate Performance vs. the S&P 500 by Five-Year Periods Annual Percentage Change in Per-Share in S&P 500 Book Value of with Dividends Relative Berkshire Included Results Five-Year Period (1) (2) (1)-(2) 1965-1969 ............................................... 17.2 5.0 12.2 1966-1970 ............................................... 14.7 3.9 10.8 1967-1971 ............................................... 13.9 9.2 4.7 1968-1972 ............................................... 16.8 7.5 9.3 1969-1973 ............................................... 17.7 2.0 15.7 1970-1974 ............................................... 15.0 (2.4) 17.4 1971-1975 ............................................... 13.9 3.2 10.7 1972-1976 ............................................... 20.8 4.9 15.9 1973-1977 ............................................... 23.4 (0.2) 23.6 1974-1978 ............................................... 24.4 4.3 20.1 1975-1979 ............................................... 30.1 14.7 15.4 1976-1980 ............................................... 33.4 13.9 19.5 1977-1981 ............................................... 29.0 8.1 20.9 1978-1982 ............................................... 29.9 14.1 15.8 1979-1983 ............................................... 31.6 17.3 14.3 1980-1984 ............................................... 27.0 14.8 12.2 1981-1985 ............................................... 32.6 14.6 18.0 1982-1986 ............................................... 31.5 19.8 11.7 1983-1987 ............................................... 27.4 16.4 11.0 1984-1988 ............................................... 25.0 15.2 9.8 1985-1989 ............................................... 31.1 20.3 10.8 1986-1990 ............................................... 22.9 13.1 9.8 1987-1991 ............................................... 25.4 15.3 10.1 1988-1992 ............................................... 25.6 15.8 9.8 1989-1993 ............................................... 24.4 14.5 9.9 1990-1994 ............................................... 18.6 8.7 9.9 1991-1995 ............................................... 25.6 16.5 9.1 1992-1996 ............................................... 24.2 15.2 9.0 1993-1997 ............................................... 26.9 20.2 6.7 1994-1998 ............................................... 33.7 24.0 9.7 1995-1999 ............................................... 30.4 28.5 1.9 1996-2000 ............................................... 22.9 18.3 4.6 1997-2001 ............................................... 14.8 10.7 4.1 1998-2002 ............................................... 10.4 (0.6) 11.0 1999-2003 ............................................... 6.0 (0.6) 6.6 2000-2004 ............................................... 8.0 (2.3) 10.3 2001-2005 ............................................... 8.0 0.6 7.4 2002-2006 ............................................... 13.1 6.2 6.9 2003-2007 ............................................... 13.3 12.8 0.5 2004-2008 ............................................... 6.9 (2.2) 9.1 2005-2009 ............................................... 8.6 0.4 8.2 2006-2010 ............................................... 10.0 2.3 7.7 Notes: The first two periods cover the five years beginning September 30 of the previous year. The third period covers 63 months beginning September 30, 1966 to December 31, 1971. All other periods involve calendar years. The other notes on page 2 also apply to this table. 5
  • 5. Intrinsic Value – Today and Tomorrow Though Berkshire’s intrinsic value cannot be precisely calculated, two of its three key pillars can be measured. Charlie and I rely heavily on these measurements when we make our own estimates of Berkshire’s value. The first component of value is our investments: stocks, bonds and cash equivalents. At yearend these totaled $158 billion at market value. Insurance float – money we temporarily hold in our insurance operations that does not belong to us – funds $66 billion of our investments. This float is “free” as long as insurance underwriting breaks even, meaning that the premiums we receive equal the losses and expenses we incur. Of course, underwriting results are volatile, swinging erratically between profits and losses. Over our entire history, though, we’ve been significantly profitable, and I also expect us to average breakeven results or better in the future. If we do that, all of our investments – those funded both by float and by retained earnings – can be viewed as an element of value for Berkshire shareholders. Berkshire’s second component of value is earnings that come from sources other than investments and insurance underwriting. These earnings are delivered by our 68 non-insurance companies, itemized on page 106. In Berkshire’s early years, we focused on the investment side. During the past two decades, however, we’ve increasingly emphasized the development of earnings from non-insurance businesses, a practice that will continue. The following tables illustrate this shift. In the first table, we present per-share investments at decade intervals beginning in 1970, three years after we entered the insurance business. We exclude those investments applicable to minority interests. Per-Share Compounded Annual Increase Yearend Investments Period in Per-Share Investments 1970 ................... $ 66 1980 ................... 754 1970-1980 27.5% 1990 ................... 7,798 1980-1990 26.3% 2000 ................... 50,229 1990-2000 20.5% 2010 ................... 94,730 2000-2010 6.6% Though our compounded annual increase in per-share investments was a healthy 19.9% over the 40-year period, our rate of increase has slowed sharply as we have focused on using funds to buy operating businesses. The payoff from this shift is shown in the following table, which illustrates how earnings of our non-insurance businesses have increased, again on a per-share basis and after applicable minority interests. Per-Share Compounded Annual Increase in Year Pre-Tax Earnings Period Per-Share Pre-Tax Earnings 1970 ............ $ 2.87 1980 ............ 19.01 1970-1980 20.8% 1990 ............ 102.58 1980-1990 18.4% 2000 ............ 918.66 1990-2000 24.5% 2010 ............ 5,926.04 2000-2010 20.5% 6
  • 6. For the forty years, our compounded annual gain in pre-tax, non-insurance earnings per share is 21.0%. During the same period, Berkshire’s stock price increased at a rate of 22.1% annually. Over time, you can expect our stock price to move in rough tandem with Berkshire’s investments and earnings. Market price and intrinsic value often follow very different paths – sometimes for extended periods – but eventually they meet. There is a third, more subjective, element to an intrinsic value calculation that can be either positive or negative: the efficacy with which retained earnings will be deployed in the future. We, as well as many other businesses, are likely to retain earnings over the next decade that will equal, or even exceed, the capital we presently employ. Some companies will turn these retained dollars into fifty-cent pieces, others into two-dollar bills. This “what-will-they-do-with-the-money” factor must always be evaluated along with the “what-do-we-have-now” calculation in order for us, or anybody, to arrive at a sensible estimate of a company’s intrinsic value. That’s because an outside investor stands by helplessly as management reinvests his share of the company’s earnings. If a CEO can be expected to do this job well, the reinvestment prospects add to the company’s current value; if the CEO’s talents or motives are suspect, today’s value must be discounted. The difference in outcome can be huge. A dollar of then-value in the hands of Sears Roebuck’s or Montgomery Ward’s CEOs in the late 1960s had a far different destiny than did a dollar entrusted to Sam Walton. ************ Charlie and I hope that the per-share earnings of our non-insurance businesses continue to increase at a decent rate. But the job gets tougher as the numbers get larger. We will need both good performance from our current businesses and more major acquisitions. We’re prepared. Our elephant gun has been reloaded, and my trigger finger is itchy. Partially offsetting our anchor of size are several important advantages we have. First, we possess a cadre of truly skilled managers who have an unusual commitment to their own operations and to Berkshire. Many of our CEOs are independently wealthy and work only because they love what they do. They are volunteers, not mercenaries. Because no one can offer them a job they would enjoy more, they can’t be lured away. At Berkshire, managers can focus on running their businesses: They are not subjected to meetings at headquarters nor financing worries nor Wall Street harassment. They simply get a letter from me every two years (it’s reproduced on pages 104-105) and call me when they wish. And their wishes do differ: There are managers to whom I have not talked in the last year, while there is one with whom I talk almost daily. Our trust is in people rather than process. A “hire well, manage little” code suits both them and me. Berkshire’s CEOs come in many forms. Some have MBAs; others never finished college. Some use budgets and are by-the-book types; others operate by the seat of their pants. Our team resembles a baseball squad composed of all-stars having vastly different batting styles. Changes in our line-up are seldom required. Our second advantage relates to the allocation of the money our businesses earn. After meeting the needs of those businesses, we have very substantial sums left over. Most companies limit themselves to reinvesting funds within the industry in which they have been operating. That often restricts them, however, to a “universe” for capital allocation that is both tiny and quite inferior to what is available in the wider world. Competition for the few opportunities that are available tends to become fierce. The seller has the upper hand, as a girl might if she were the only female at a party attended by many boys. That lopsided situation would be great for the girl, but terrible for the boys. At Berkshire we face no institutional restraints when we deploy capital. Charlie and I are limited only by our ability to understand the likely future of a possible acquisition. If we clear that hurdle – and frequently we can’t – we are then able to compare any one opportunity against a host of others. 7
  • 7. When I took control of Berkshire in 1965, I didn’t exploit this advantage. Berkshire was then only in textiles, where it had in the previous decade lost significant money. The dumbest thing I could have done was to pursue “opportunities” to improve and expand the existing textile operation – so for years that’s exactly what I did. And then, in a final burst of brilliance, I went out and bought another textile company. Aaaaaaargh! Eventually I came to my senses, heading first into insurance and then into other industries. There is even a supplement to this world-is-our-oyster advantage: In addition to evaluating the attractions of one business against a host of others, we also measure businesses against opportunities available in marketable securities, a comparison most managements don’t make. Often, businesses are priced ridiculously high against what can likely be earned from investments in stocks or bonds. At such moments, we buy securities and bide our time. Our flexibility in respect to capital allocation has accounted for much of our progress to date. We have been able to take money we earn from, say, See’s Candies or Business Wire (two of our best-run businesses, but also two offering limited reinvestment opportunities) and use it as part of the stake we needed to buy BNSF. Our final advantage is the hard-to-duplicate culture that permeates Berkshire. And in businesses, culture counts. To start with, the directors who represent you think and act like owners. They receive token compensation: no options, no restricted stock and, for that matter, virtually no cash. We do not provide them directors and officers liability insurance, a given at almost every other large public company. If they mess up with your money, they will lose their money as well. Leaving my holdings aside, directors and their families own Berkshire shares worth more than $3 billion. Our directors, therefore, monitor Berkshire’s actions and results with keen interest and an owner’s eye. You and I are lucky to have them as stewards. This same owner-orientation prevails among our managers. In many cases, these are people who have sought out Berkshire as an acquirer for a business that they and their families have long owned. They came to us with an owner’s mindset, and we provide an environment that encourages them to retain it. Having managers who love their businesses is no small advantage. Cultures self-propagate. Winston Churchill once said, “You shape your houses and then they shape you.” That wisdom applies to businesses as well. Bureaucratic procedures beget more bureaucracy, and imperial corporate palaces induce imperious behavior. (As one wag put it, “You know you’re no longer CEO when you get in the back seat of your car and it doesn’t move.”) At Berkshire’s “World Headquarters” our annual rent is $270,212. Moreover, the home-office investment in furniture, art, Coke dispenser, lunch room, high-tech equipment – you name it – totals $301,363. As long as Charlie and I treat your money as if it were our own, Berkshire’s managers are likely to be careful with it as well. Our compensation programs, our annual meeting and even our annual reports are all designed with an eye to reinforcing the Berkshire culture, and making it one that will repel and expel managers of a different bent. This culture grows stronger every year, and it will remain intact long after Charlie and I have left the scene. We will need all of the strengths I’ve just described to do reasonably well. Our managers will deliver; you can count on that. But whether Charlie and I can hold up our end in capital allocation depends in part on the competitive environment for acquisitions. You will get our best efforts. GEICO Now let me tell you a story that will help you understand how the intrinsic value of a business can far exceed its book value. Relating this tale also gives me a chance to relive some great memories. Sixty years ago last month, GEICO entered my life, destined to shape it in a huge way. I was then a 20-year-old graduate student at Columbia, having elected to go there because my hero, Ben Graham, taught a once-a-week class at the school. 8
  • 8. One day at the library, I checked out Ben’s entry in Who’s Who in America and found he was chairman of Government Employees Insurance Co. (now called GEICO). I knew nothing of insurance and had never heard of the company. The librarian, however, steered me to a large compendium of insurers and, after reading the page on GEICO, I decided to visit the company. The following Saturday, I boarded an early train for Washington. Alas, when I arrived at the company’s headquarters, the building was closed. I then rather frantically started pounding on a door, until finally a janitor appeared. I asked him if there was anyone in the office I could talk to, and he steered me to the only person around, Lorimer Davidson. That was my lucky moment. During the next four hours, “Davy” gave me an education about both insurance and GEICO. It was the beginning of a wonderful friendship. Soon thereafter, I graduated from Columbia and became a stock salesman in Omaha. GEICO, of course, was my prime recommendation, which got me off to a great start with dozens of customers. GEICO also jump-started my net worth because, soon after meeting Davy, I made the stock 75% of my $9,800 investment portfolio. (Even so, I felt over-diversified.) Subsequently, Davy became CEO of GEICO, taking the company to undreamed-of heights before it got into trouble in the mid-1970s, a few years after his retirement. When that happened – with the stock falling by more than 95% – Berkshire bought about one-third of the company in the market, a position that over the years increased to 50% because of GEICO’s repurchases of its own shares. Berkshire’s cost for this half of the business was $46 million. (Despite the size of our position, we exercised no control over operations.) We then purchased the remaining 50% of GEICO at the beginning of 1996, which spurred Davy, at 95, to make a video tape saying how happy he was that his beloved GEICO would permanently reside with Berkshire. (He also playfully concluded with, “Next time, Warren, please make an appointment.”) A lot has happened at GEICO during the last 60 years, but its core goal – saving Americans substantial money on their purchase of auto insurance – remains unchanged. (Try us at 1-800-847-7536 or www.GEICO.com.) In other words, get the policyholder’s business by deserving his business. Focusing on this objective, the company has grown to be America’s third-largest auto insurer, with a market share of 8.8%. When Tony Nicely, GEICO’s CEO, took over in 1993, that share was 2.0%, a level at which it had been stuck for more than a decade. GEICO became a different company under Tony, finding a path to consistent growth while simultaneously maintaining underwriting discipline and keeping its costs low. Let me quantify Tony’s achievement. When, in 1996, we bought the 50% of GEICO we didn’t already own, it cost us about $2.3 billion. That price implied a value of $4.6 billion for 100%. GEICO then had tangible net worth of $1.9 billion. The excess over tangible net worth of the implied value – $2.7 billion – was what we estimated GEICO’s “goodwill” to be worth at that time. That goodwill represented the economic value of the policyholders who were then doing business with GEICO. In 1995, those customers had paid the company $2.8 billion in premiums. Consequently, we were valuing GEICO’s customers at about 97% (2.7/2.8) of what they were annually paying the company. By industry standards, that was a very high price. But GEICO was no ordinary insurer: Because of the company’s low costs, its policyholders were consistently profitable and unusually loyal. Today, premium volume is $14.3 billion and growing. Yet we carry the goodwill of GEICO on our books at only $1.4 billion, an amount that will remain unchanged no matter how much the value of GEICO increases. (Under accounting rules, you write down the carrying value of goodwill if its economic value decreases, but leave it unchanged if economic value increases.) Using the 97%-of-premium-volume yardstick we applied to our 1996 purchase, the real value today of GEICO’s economic goodwill is about $14 billion. And this value is likely to be much higher ten and twenty years from now. GEICO – off to a strong start in 2011 – is the gift that keeps giving. 9
  • 9. One not-so-small footnote: Under Tony, GEICO has developed one of the country’s largest personal- lines insurance agencies, which primarily sells homeowners policies to our GEICO auto insurance customers. In this business, we represent a number of insurers that are not affiliated with us. They take the risk; we simply sign up the customers. Last year we sold 769,898 new policies at this agency operation, up 34% from the year before. The obvious way this activity aids us is that it produces commission revenue; equally important is the fact that it further strengthens our relationship with our policyholders, helping us retain them. I owe an enormous debt to Tony and Davy (and, come to think of it, to that janitor as well). ************ Now, let’s examine the four major sectors of Berkshire. Each has vastly different balance sheet and income characteristics from the others. Lumping them together therefore impedes analysis. So we’ll present them as four separate businesses, which is how Charlie and I view them. We will look first at insurance, Berkshire’s core operation and the engine that has propelled our expansion over the years. Insurance Property-casualty (“P/C”) insurers receive premiums upfront and pay claims later. In extreme cases, such as those arising from certain workers’ compensation accidents, payments can stretch over decades. This collect-now, pay-later model leaves us holding large sums – money we call “float” – that will eventually go to others. Meanwhile, we get to invest this float for Berkshire’s benefit. Though individual policies and claims come and go, the amount of float we hold remains remarkably stable in relation to premium volume. Consequently, as our business grows, so does our float. And how we have grown: Just take a look at the following table: Float Yearend (in $ millions) 1970 ........................................ $ 39 1980 ........................................ 237 1990 ........................................ 1,632 2000 ........................................ 27,871 2010 ........................................ 65,832 If our premiums exceed the total of our expenses and eventual losses, we register an underwriting profit that adds to the investment income that our float produces. When such a profit occurs, we enjoy the use of free money – and, better yet, get paid for holding it. Alas, the wish of all insurers to achieve this happy result creates intense competition, so vigorous in most years that it causes the P/C industry as a whole to operate at a significant underwriting loss. This loss, in effect, is what the industry pays to hold its float. For example, State Farm, by far the country’s largest insurer and a well-managed company, has incurred an underwriting loss in seven of the last ten years. During that period, its aggregate underwriting loss was more than $20 billion. At Berkshire, we have now operated at an underwriting profit for eight consecutive years, our total underwriting gain for the period having been $17 billion. I believe it likely that we will continue to underwrite profitably in most – though certainly not all – future years. If we accomplish that, our float will be better than cost-free. We will benefit just as we would if some party deposited $66 billion with us, paid us a fee for holding its money and then let us invest its funds for our own benefit. 10
  • 10. Let me emphasize again that cost-free float is not an outcome to be expected for the P/C industry as a whole: In most years, industry premiums have been inadequate to cover claims plus expenses. Consequently, the industry’s overall return on tangible equity has for many decades fallen far short of the average return realized by American industry, a sorry performance almost certain to continue. Berkshire’s outstanding economics exist only because we have some terrific managers running some unusual businesses. We’ve already told you about GEICO, but we have two other very large operations, and a bevy of smaller ones as well, each a star in its own way. ************ First off is the Berkshire Hathaway Reinsurance Group, run by Ajit Jain. Ajit insures risks that no one else has the desire or the capital to take on. His operation combines capacity, speed, decisiveness and, most importantly, brains in a manner that is unique in the insurance business. Yet he never exposes Berkshire to risks that are inappropriate in relation to our resources. Indeed, we are far more conservative than most large insurers in that respect. In the past year, Ajit has significantly increased his life reinsurance operation, developing annual premium volume of about $2 billion that will repeat for decades. From a standing start in 1985, Ajit has created an insurance business with float of $30 billion and significant underwriting profits, a feat that no CEO of any other insurer has come close to matching. By his accomplishments, he has added a great many billions of dollars to the value of Berkshire. Even kryptonite bounces off Ajit. ************ We have another insurance powerhouse in General Re, managed by Tad Montross. At bottom, a sound insurance operation requires four disciplines: (1) An understanding of all exposures that might cause a policy to incur losses; (2) A conservative evaluation of the likelihood of any exposure actually causing a loss and the probable cost if it does; (3) The setting of a premium that will deliver a profit, on average, after both prospective loss costs and operating expenses are covered; and (4) The willingness to walk away if the appropriate premium can’t be obtained. Many insurers pass the first three tests and flunk the fourth. The urgings of Wall Street, pressures from the agency force and brokers, or simply a refusal by a testosterone-driven CEO to accept shrinking volumes has led too many insurers to write business at inadequate prices. “The other guy is doing it so we must as well” spells trouble in any business, but none more so than insurance. Tad has observed all four of the insurance commandments, and it shows in his results. General Re’s huge float has been better than cost-free under his leadership, and we expect that, on average, it will continue to be. ************ Finally, we own a group of smaller companies, most of them specializing in odd corners of the insurance world. In aggregate, their results have consistently been profitable and, as the table below shows, the float they provide us is substantial. Charlie and I treasure these companies and their managers. Here is the record of all four segments of our property-casualty and life insurance businesses: Underwriting Profit Yearend Float (in millions) Insurance Operations 2010 2009 2010 2009 General Re . . . . . . . . . . . . . . . . . . . . . . $ 452 $ 477 $20,049 $21,014 BH Reinsurance . . . . . . . . . . . . . . . . . . 176 250 30,370 27,753 GEICO . . . . . . . . . . . . . . . . . . . . . . . . . 1,117 649 10,272 9,613 Other Primary . . . . . . . . . . . . . . . . . . . 268 84 5,141 5,061 $2,013 $1,460 $65,832 $63,441 Among large insurance operations, Berkshire’s impresses me as the best in the world. 11
  • 11. Manufacturing, Service and Retailing Operations Our activities in this part of Berkshire cover the waterfront. Let’s look, though, at a summary balance sheet and earnings statement for the entire group. Balance Sheet 12/31/10 (in millions) Assets Liabilities and Equity Cash and equivalents . . . . . . . . . . . . . . . . . $ 2,673 Notes payable . . . . . . . . . . . . . . . . . . . . . . . $ 1,805 Accounts and notes receivable . . . . . . . . . . 5,396 Other current liabilities . . . . . . . . . . . . . . . 8,169 Inventory . . . . . . . . . . . . . . . . . . . . . . . . . . 7,101 Total current liabilities . . . . . . . . . . . . . . . . 9,974 Other current assets . . . . . . . . . . . . . . . . . . 550 Total current assets . . . . . . . . . . . . . . . . . . . 15,720 Goodwill and other intangibles . . . . . . . . . 16,976 Deferred taxes . . . . . . . . . . . . . . . . . . . . . . 3,001 Fixed assets . . . . . . . . . . . . . . . . . . . . . . . . 15,421 Term debt and other liabilities . . . . . . . . . . 6,621 Other assets . . . . . . . . . . . . . . . . . . . . . . . . 3,029 Equity . . . . . . . . . . . . . . . . . . . . . . . . . . . . . 31,550 $51,146 $51,146 Earnings Statement (in millions) 2010 2009 2008 Revenues . . . . . . . . . . . . . . . . . . . . . . . . . . . . . . . . . . . . . . . . . . . . . . . . . . . . . . . . . $66,610 $61,665 $66,099 Operating expenses (including depreciation of $1,362 in 2010, $1,422 in 2009 and $1,280 in 2008) . . . . . . . . . . . . . . . . . . . . . . . . . . . . . . . . . . . . . . . . . . . . . . . 62,225 59,509 61,937 Interest expense . . . . . . . . . . . . . . . . . . . . . . . . . . . . . . . . . . . . . . . . . . . . . . . . . . . . 111 98 139 Pre-tax earnings . . . . . . . . . . . . . . . . . . . . . . . . . . . . . . . . . . . . . . . . . . . . . . . . . . . . 4,274* 2,058* 4,023* Income taxes and non-controlling interests . . . . . . . . . . . . . . . . . . . . . . . . . . . . . . . 1,812 945 1,740 Net earnings . . . . . . . . . . . . . . . . . . . . . . . . . . . . . . . . . . . . . . . . . . . . . . . . . . . . . . . $ 2,462 $ 1,113 $ 2,283 *Does not include purchase-accounting adjustments. This group of companies sells products ranging from lollipops to jet airplanes. Some of the businesses enjoy terrific economics, measured by earnings on unleveraged net tangible assets that run from 25% after-tax to more than 100%. Others produce good returns in the area of 12-20%. Unfortunately, a few have very poor returns, a result of some serious mistakes I have made in my job of capital allocation. These errors came about because I misjudged either the competitive strength of the business I was purchasing or the future economics of the industry in which it operated. I try to look out ten or twenty years when making an acquisition, but sometimes my eyesight has been poor. Most of the companies in this section improved their earnings last year and four set records. Let’s look first at the record-breakers. • TTI, our electronic components distributor, had sales 21% above its previous high (recorded in 2008) and pre-tax earnings that topped its earlier record by 58%. Its sales gains spanned three continents, with North America at 16%, Europe at 26%, and Asia at 50%. The thousands of items TTI distributes are pedestrian, many selling for less than a dollar. The magic of TTI’s exceptional performance is created by Paul Andrews, its CEO, and his associates. 12
  • 12. Forest River, our RV and boat manufacturer, had record sales of nearly $2 billion and record earnings as well. Forest River has 82 plants, and I have yet to visit one (or the home office, for that matter). There’s no need; Pete Liegl, the company’s CEO, runs a terrific operation. Come view his products at the annual meeting. Better yet, buy one. • CTB, our farm-equipment company, again set an earnings record. I told you in the 2008 Annual Report about Vic Mancinelli, the company’s CEO. He just keeps getting better. Berkshire paid $140 million for CTB in 2002. It has since paid us dividends of $160 million and eliminated $40 million of debt. Last year it earned $106 million pre-tax. Productivity gains have produced much of this increase. When we bought CTB, sales per employee were $189,365; now they are $405,878. • Would you believe shoes? H. H. Brown, run by Jim Issler and best known for its Born brand, set a new record for sales and earnings (helped by its selling 1,110 pairs of shoes at our annual meeting). Jim has brilliantly adapted to major industry changes. His work, I should mention, is overseen by Frank Rooney, 89, a superb businessman and still a dangerous fellow with whom to have a bet on the golf course. A huge story in this sector’s year-to-year improvement occurred at NetJets. I can’t overstate the breadth and importance of Dave Sokol’s achievements at this company, the leading provider of fractional ownership of jet airplanes. NetJets has long been an operational success, owning a 2010 market share five times that of its nearest competitor. Our overwhelming leadership stems from a wonderful team of pilots, mechanics and service personnel. This crew again did its job in 2010, with customer satisfaction, as delineated in our regular surveys, hitting new highs. Even though NetJets was consistently a runaway winner with customers, our financial results, since its acquisition in 1998, were a failure. In the 11 years through 2009, the company reported an aggregate pre-tax loss of $157 million, a figure that was far understated since borrowing costs at NetJets were heavily subsidized by its free use of Berkshire’s credit. Had NetJets been operating on a stand-alone basis, its loss over the years would have been several hundreds of millions greater. We are now charging NetJets an appropriate fee for Berkshire’s guarantee. Despite this fee (which came to $38 million in 2010), NetJets earned $207 million pre-tax in 2010, a swing of $918 million from 2009. Dave’s quick restructuring of management and the company’s rationalization of its purchasing and spending policies has ended the hemorrhaging of cash and turned what was Berkshire’s only major business problem into a solidly profitable operation. Dave has meanwhile maintained NetJets’ industry-leading reputation for safety and service. In many important ways, our training and operational standards are considerably stronger than those required by the FAA. Maintaining top-of-the-line standards is the right thing to do, but I also have a selfish reason for championing this policy. My family and I have flown more than 5,000 hours on NetJets (that’s equal to being airborne 24 hours a day for seven months) and will fly thousands of hours more in the future. We receive no special treatment and have used a random mix of at least 100 planes and 300 crews. Whichever the plane or crew, we always know we are flying with the best-trained pilots in private aviation. The largest earner in our manufacturing, service and retailing sector is Marmon, a collection of 130 businesses. We will soon increase our ownership in this company to 80% by carrying out our scheduled purchase of 17% of its stock from the Pritzker family. The cost will be about $1.5 billion. We will then purchase the remaining Pritzker holdings in 2013 or 2014, whichever date is selected by the family. Frank Ptak runs Marmon wonderfully, and we look forward to 100% ownership. 13
  • 13. Next to Marmon, the two largest earners in this sector are Iscar and McLane. Both had excellent years. In 2010, Grady Rosier’s McLane entered the wine and spirits distribution business to supplement its $32 billion operation as a distributor of food products, cigarettes, candy and sundries. In purchasing Empire Distributors, an operator in Georgia and North Carolina, we teamed up with David Kahn, the company’s dynamic CEO. David is leading our efforts to expand geographically. By yearend he had already made his first acquisition, Horizon Wine and Spirits in Tennessee. At Iscar, profits were up 159% in 2010, and we may well surpass pre-recession levels in 2011. Sales are improving throughout the world, particularly in Asia. Credit Eitan Wertheimer, Jacob Harpaz and Danny Goldman for an exceptional performance, one far superior to that of Iscar’s main competitors. All that is good news. Our businesses related to home construction, however, continue to struggle. Johns Manville, MiTek, Shaw and Acme Brick have maintained their competitive positions, but their profits are far below the levels of a few years ago. Combined, these operations earned $362 million pre-tax in 2010 compared to $1.3 billion in 2006, and their employment has fallen by about 9,400. A housing recovery will probably begin within a year or so. In any event, it is certain to occur at some point. Consequently: (1) At MiTek, we have made, or committed to, five bolt-on acquisitions during the past eleven months; (2) At Acme, we just recently acquired the leading manufacturer of brick in Alabama for $50 million; (3) Johns Manville is building a $55 million roofing membrane plant in Ohio, to be completed next year; and (4) Shaw will spend $200 million in 2011 on plant and equipment, all of it situated in America. These businesses entered the recession strong and will exit it stronger. At Berkshire, our time horizon is forever. Regulated, Capital-Intensive Businesses We have two very large businesses, BNSF and MidAmerican Energy, with important common characteristics that distinguish them from our many others. Consequently, we give them their own sector in this letter and split out their financial statistics in our GAAP balance sheet and income statement. A key characteristic of both companies is the huge investment they have in very long-lived, regulated assets, with these funded by large amounts of long-term debt that is not guaranteed by Berkshire. Our credit is not needed: Both businesses have earning power that, even under very adverse business conditions, amply covers their interest requirements. For example, in recessionary 2010 with BNSF’s car loadings far off peak levels, the company’s interest coverage was 6:1. Both companies are heavily regulated, and both will have a never-ending need to make major investments in plant and equipment. Both also need to provide efficient, customer-satisfying service to earn the respect of their communities and regulators. In return, both need to be assured that they will be allowed to earn reasonable earnings on future capital investments. Earlier I explained just how important railroads are to our country’s future. Rail moves 42% of America’s inter-city freight, measured by ton-miles, and BNSF moves more than any other railroad – about 28% of the industry total. A little math will tell you that more than 11% of all inter-city ton-miles of freight in the U.S. is transported by BNSF. Given the shift of population to the West, our share may well inch higher. All of this adds up to a huge responsibility. We are a major and essential part of the American economy’s circulatory system, obliged to constantly maintain and improve our 23,000 miles of track along with its ancillary bridges, tunnels, engines and cars. In carrying out this job, we must anticipate society’s needs, not merely react to them. Fulfilling our societal obligation, we will regularly spend far more than our depreciation, with this excess amounting to $2 billion in 2011. I’m confident we will earn appropriate returns on our huge incremental investments. Wise regulation and wise investment are two sides of the same coin. At MidAmerican, we participate in a similar “social compact.” We are expected to put up ever- increasing sums to satisfy the future needs of our customers. If we meanwhile operate reliably and efficiently, we know that we will obtain a fair return on these investments. 14
  • 14. MidAmerican supplies 2.4 million customers in the U.S. with electricity, operating as the largest supplier in Iowa, Wyoming and Utah and as an important provider in other states as well. Our pipelines transport 8% of the country’s natural gas. Obviously, many millions of Americans depend on us every day. MidAmerican has delivered outstanding results for both its owners (Berkshire’s interest is 89.8%) and its customers. Shortly after MidAmerican purchased Northern Natural Gas pipeline in 2002, that company’s performance as a pipeline was rated dead last, 43 out of 43, by the leading authority in the field. In the most recent report published, Northern Natural was ranked second. The top spot was held by our other pipeline, Kern River. In its electric business, MidAmerican has a comparable record. Iowa rates have not increased since we purchased our operation there in 1999. During the same period, the other major electric utility in the state has raised prices more than 70% and now has rates far above ours. In certain metropolitan areas in which the two utilities operate side by side, electric bills of our customers run far below those of their neighbors. I am told that comparable houses sell at higher prices in these cities if they are located in our service area. MidAmerican will have 2,909 megawatts of wind generation in operation by the end of 2011, more than any other regulated electric utility in the country. The total amount that MidAmerican has invested or committed to wind is a staggering $5.4 billion. We can make this sort of investment because MidAmerican retains all of its earnings, unlike other utilities that generally pay out most of what they earn. As you can tell by now, I am proud of what has been accomplished for our society by Matt Rose at BNSF and by David Sokol and Greg Abel at MidAmerican. I am also both proud and grateful for what they have accomplished for Berkshire shareholders. Below are the relevant figures: MidAmerican Earnings (in millions) 2010 2009 U.K. utilities . . . . . . . . . . . . . . . . . . . . . . . . . . . . . . . . . . . . . . . . . . . . . . . . . . . . . . . . . . . . $ 333 $ 248 Iowa utility . . . . . . . . . . . . . . . . . . . . . . . . . . . . . . . . . . . . . . . . . . . . . . . . . . . . . . . . . . . . . 279 285 Western utilities . . . . . . . . . . . . . . . . . . . . . . . . . . . . . . . . . . . . . . . . . . . . . . . . . . . . . . . . . 783 788 Pipelines . . . . . . . . . . . . . . . . . . . . . . . . . . . . . . . . . . . . . . . . . . . . . . . . . . . . . . . . . . . . . . . 378 457 HomeServices . . . . . . . . . . . . . . . . . . . . . . . . . . . . . . . . . . . . . . . . . . . . . . . . . . . . . . . . . . . 42 43 Other (net) . . . . . . . . . . . . . . . . . . . . . . . . . . . . . . . . . . . . . . . . . . . . . . . . . . . . . . . . . . . . . . 47 25 Operating earnings before corporate interest and taxes . . . . . . . . . . . . . . . . . . . . . . . . . . . 1,862 1,846 Interest, other than to Berkshire . . . . . . . . . . . . . . . . . . . . . . . . . . . . . . . . . . . . . . . . . . . . . (323) (318) Interest on Berkshire junior debt . . . . . . . . . . . . . . . . . . . . . . . . . . . . . . . . . . . . . . . . . . . . . (30) (58) Income tax . . . . . . . . . . . . . . . . . . . . . . . . . . . . . . . . . . . . . . . . . . . . . . . . . . . . . . . . . . . . . . (271) (313) Net earnings . . . . . . . . . . . . . . . . . . . . . . . . . . . . . . . . . . . . . . . . . . . . . . . . . . . . . . . . . . . . . $1,238 $1,157 Earnings applicable to Berkshire* . . . . . . . . . . . . . . . . . . . . . . . . . . . . . . . . . . . . . . . . . . . $1,131 $1,071 *Includes interest earned by Berkshire (net of related income taxes) of $19 in 2010 and $38 in 2009. BNSF (Historical accounting through 2/12/10; purchase accounting subsequently) (in millions) 2010 2009 Revenues . . . . . . . . . . . . . . . . . . . . . . . . . . . . . . . . . . . . . . . . . . . . . . . . . . . . . . . . . . . . . . . $16,850 $14,016 Operating earnings . . . . . . . . . . . . . . . . . . . . . . . . . . . . . . . . . . . . . . . . . . . . . . . . . . . . . . . 4,495 3,254 Interest (Net) . . . . . . . . . . . . . . . . . . . . . . . . . . . . . . . . . . . . . . . . . . . . . . . . . . . . . . . . . . . . 507 613 Pre-Tax earnings . . . . . . . . . . . . . . . . . . . . . . . . . . . . . . . . . . . . . . . . . . . . . . . . . . . . . . . . . 3,988 2,641 Net earnings . . . . . . . . . . . . . . . . . . . . . . . . . . . . . . . . . . . . . . . . . . . . . . . . . . . . . . . . . . . . . 2,459 1,721 15
  • 15. Finance and Financial Products This, our smallest sector, includes two rental companies, XTRA (trailers) and CORT (furniture), and Clayton Homes, the country’s leading producer and financer of manufactured homes. Both of our leasing businesses improved their performances last year, albeit from a very low base. XTRA increased the utilization of its equipment from 63% in 2009 to 75% in 2010, thereby raising pre-tax earnings to $35 million from $17 million in 2009. CORT experienced a pickup in business as the year progressed and also significantly tightened its operations. The combination increased its pre-tax results from a loss of $3 million in 2009 to $18 million of profit in 2010. At Clayton, we produced 23,343 homes, 47% of the industry’s total of 50,046. Contrast this to the peak year of 1998, when 372,843 homes were manufactured. (We then had an industry share of 8%.) Sales would have been terrible last year under any circumstances, but the financing problems I commented upon in the 2009 report continue to exacerbate the distress. To explain: Home-financing policies of our government, expressed through the loans found acceptable by FHA, Freddie Mac and Fannie Mae, favor site-built homes and work to negate the price advantage that manufactured homes offer. We finance more manufactured-home buyers than any other company. Our experience, therefore, should be instructive to those parties preparing to overhaul our country’s home-loan practices. Let’s take a look. Clayton owns 200,804 mortgages that it originated. (It also has some mortgage portfolios that it purchased.) At the origination of these contracts, the average FICO score of our borrowers was 648, and 47% were 640 or below. Your banker will tell you that people with such scores are generally regarded as questionable credits. Nevertheless, our portfolio has performed well during conditions of stress. Here’s our loss experience during the last five years for originated loans: Net Losses as a Percentage Year of Average Loans 2006 .............................. 1.53% 2007 .............................. 1.27% 2008 .............................. 1.17% 2009 .............................. 1.86% 2010 .............................. 1.72% Our borrowers get in trouble when they lose their jobs, have health problems, get divorced, etc. The recession has hit them hard. But they want to stay in their homes, and generally they borrowed sensible amounts in relation to their income. In addition, we were keeping the originated mortgages for our own account, which means we were not securitizing or otherwise reselling them. If we were stupid in our lending, we were going to pay the price. That concentrates the mind. If home buyers throughout the country had behaved like our buyers, America would not have had the crisis that it did. Our approach was simply to get a meaningful down-payment and gear fixed monthly payments to a sensible percentage of income. This policy kept Clayton solvent and also kept buyers in their homes. Home ownership makes sense for most Americans, particularly at today’s lower prices and bargain interest rates. All things considered, the third best investment I ever made was the purchase of my home, though I would have made far more money had I instead rented and used the purchase money to buy stocks. (The two best investments were wedding rings.) For the $31,500 I paid for our house, my family and I gained 52 years of terrific memories with more to come. 16
  • 16. But a house can be a nightmare if the buyer’s eyes are bigger than his wallet and if a lender – often protected by a government guarantee – facilitates his fantasy. Our country’s social goal should not be to put families into the house of their dreams, but rather to put them into a house they can afford. Investments Below we show our common stock investments that at yearend had a market value of more than $1 billion. 12/31/10 Percentage of Company Shares Company Owned Cost * Market (in millions) 151,610,700 American Express Company . . . . . . . . . . . . . . . . . . . . . . . . 12.6 $ 1,287 $ 6,507 225,000,000 BYD Company, Ltd. . . . . . . . . . . . . . . . . . . . . . . . . . . . . . . 9.9 232 1,182 200,000,000 The Coca-Cola Company . . . . . . . . . . . . . . . . . . . . . . . . . . 8.6 1,299 13,154 29,109,637 ConocoPhillips . . . . . . . . . . . . . . . . . . . . . . . . . . . . . . . . . . 2.0 2,028 1,982 45,022,563 Johnson & Johnson . . . . . . . . . . . . . . . . . . . . . . . . . . . . . . . 1.6 2,749 2,785 97,214,584 Kraft Foods Inc. . . . . . . . . . . . . . . . . . . . . . . . . . . . . . . . . . 5.6 3,207 3,063 19,259,600 Munich Re . . . . . . . . . . . . . . . . . . . . . . . . . . . . . . . . . . . . . . 10.5 2,896 2,924 3,947,555 POSCO . . . . . . . . . . . . . . . . . . . . . . . . . . . . . . . . . . . . . . . . 4.6 768 1,706 72,391,036 The Procter & Gamble Company . . . . . . . . . . . . . . . . . . . . 2.6 464 4,657 25,848,838 Sanofi-Aventis . . . . . . . . . . . . . . . . . . . . . . . . . . . . . . . . . . 2.0 2,060 1,656 242,163,773 Tesco plc . . . . . . . . . . . . . . . . . . . . . . . . . . . . . . . . . . . . . . . 3.0 1,414 1,608 78,060,769 U.S. Bancorp . . . . . . . . . . . . . . . . . . . . . . . . . . . . . . . . . . . . 4.1 2,401 2,105 39,037,142 Wal-Mart Stores, Inc. . . . . . . . . . . . . . . . . . . . . . . . . . . . . . 1.1 1,893 2,105 358,936,125 Wells Fargo & Company . . . . . . . . . . . . . . . . . . . . . . . . . . 6.8 8,015 11,123 Others . . . . . . . . . . . . . . . . . . . . . . . . . . . . . . . . . . . . . . . . . 3,020 4,956 Total Common Stocks Carried at Market . . . . . . . . . . . . . . $33,733 $61,513 *This is our actual purchase price and also our tax basis; GAAP “cost” differs in a few cases because of write-ups or write-downs that have been required. In our reported earnings we reflect only the dividends our portfolio companies pay us. Our share of the undistributed earnings of these investees, however, was more than $2 billion last year. These retained earnings are important. In our experience – and, for that matter, in the experience of investors over the past century – undistributed earnings have been either matched or exceeded by market gains, albeit in a highly irregular manner. (Indeed, sometimes the correlation goes in reverse. As one investor said in 2009: “This is worse than divorce. I’ve lost half my net worth – and I still have my wife.”) In the future, we expect our market gains to eventually at least equal the earnings our investees retain. ************ In our earlier estimate of Berkshire’s normal earning power, we made three adjustments that relate to future investment income (but did not include anything for the undistributed earnings factor I have just described). The first adjustment was decidedly negative. Last year, we discussed five large fixed-income investments that have been contributing substantial sums to our reported earnings. One of these – our Swiss Re note – was redeemed in the early days of 2011, and two others – our Goldman Sachs and General Electric preferred stocks – are likely to be gone by yearend. General Electric is entitled to call our preferred in October and has stated its intention to do so. Goldman Sachs has the right to call our preferred on 30 days notice, but has been held back by the Federal Reserve (bless it!), which unfortunately will likely give Goldman the green light before long. 17
  • 17. All three of the companies redeeming must pay us a premium to do so – in aggregate about $1.4 billion – but all of the redemptions are nevertheless unwelcome. After they occur, our earning power will be significantly reduced. That’s the bad news. There are two probable offsets. At yearend we held $38 billion of cash equivalents that have been earning a pittance throughout 2010. At some point, however, better rates will return. They will add at least $500 million – and perhaps much more – to our investment income. That sort of increase in money-market yields is unlikely to come soon. It is appropriate, nevertheless, for us to include improved rates in an estimate of “normal” earning power. Even before higher rates come about, furthermore, we could get lucky and find an opportunity to use some of our cash hoard at decent returns. That day can’t come too soon for me: To update Aesop, a girl in a convertible is worth five in the phone book. In addition, dividends on our current common stock holdings will almost certainly increase. The largest gain is likely to come at Wells Fargo. The Federal Reserve, our friend in respect to Goldman Sachs, has frozen dividend levels at major banks, whether strong or weak, during the last two years. Wells Fargo, though consistently prospering throughout the worst of the recession and currently enjoying enormous financial strength and earning power, has therefore been forced to maintain an artificially low payout. (We don’t fault the Fed: For various reasons, an across-the-board freeze made sense during the crisis and its immediate aftermath.) At some point, probably soon, the Fed’s restrictions will cease. Wells Fargo can then reinstate the rational dividend policy that its owners deserve. At that time, we would expect our annual dividends from just this one security to increase by several hundreds of millions of dollars annually. Other companies we hold are likely to increase their dividends as well. Coca-Cola paid us $88 million in 1995, the year after we finished purchasing the stock. Every year since, Coke has increased its dividend. In 2011, we will almost certainly receive $376 million from Coke, up $24 million from last year. Within ten years, I would expect that $376 million to double. By the end of that period, I wouldn’t be surprised to see our share of Coke’s annual earnings exceed 100% of what we paid for the investment. Time is the friend of the wonderful business. Overall, I believe our “normal” investment income will at least equal what we realized in 2010, though the redemptions I described will cut our take in 2011 and perhaps 2012 as well. ************ Last summer, Lou Simpson told me he wished to retire. Since Lou was a mere 74 – an age Charlie and I regard as appropriate only for trainees at Berkshire – his call was a surprise. Lou joined GEICO as its investment manager in 1979, and his service to that company has been invaluable. In the 2004 Annual Report, I detailed his record with equities, and I have omitted updates only because his performance made mine look bad. Who needs that? Lou has never been one to advertise his talents. But I will: Simply put, Lou is one of the investment greats. We will miss him. ************ Four years ago, I told you that we needed to add one or more younger investment managers to carry on when Charlie, Lou and I weren’t around. At that time we had multiple outstanding candidates immediately available for my CEO job (as we do now), but we did not have backup in the investment area. It’s easy to identify many investment managers with great recent records. But past results, though important, do not suffice when prospective performance is being judged. How the record has been achieved is crucial, as is the manager’s understanding of – and sensitivity to – risk (which in no way should be measured by beta, the choice of too many academics). In respect to the risk criterion, we were looking for someone with a hard-to-evaluate skill: the ability to anticipate the effects of economic scenarios not previously observed. Finally, we wanted someone who would regard working for Berkshire as far more than a job. 18
  • 18. When Charlie and I met Todd Combs, we knew he fit our requirements. Todd, as was the case with Lou, will be paid a salary plus a contingent payment based on his performance relative to the S&P. We have arrangements in place for deferrals and carryforwards that will prevent see-saw performance being met by undeserved payments. The hedge-fund world has witnessed some terrible behavior by general partners who have received huge payouts on the upside and who then, when bad results occurred, have walked away rich, with their limited partners losing back their earlier gains. Sometimes these same general partners thereafter quickly started another fund so that they could immediately participate in future profits without having to overcome their past losses. Investors who put money with such managers should be labeled patsies, not partners. As long as I am CEO, I will continue to manage the great majority of Berkshire’s holdings, both bonds and equities. Todd initially will manage funds in the range of one to three billion dollars, an amount he can reset annually. His focus will be equities but he is not restricted to that form of investment. (Fund consultants like to require style boxes such as “long-short,” “macro,” “international equities.” At Berkshire our only style box is “smart.”) Over time, we may add one or two investment managers if we find the right individuals. Should we do that, we will probably have 80% of each manager’s performance compensation be dependent on his or her own portfolio and 20% on that of the other manager(s). We want a compensation system that pays off big for individual success but that also fosters cooperation, not competition. When Charlie and I are no longer around, our investment manager(s) will have responsibility for the entire portfolio in a manner then set by the CEO and Board of Directors. Because good investors bring a useful perspective to the purchase of businesses, we would expect them to be consulted – but not to have a vote – on the wisdom of possible acquisitions. In the end, of course, the Board will make the call on any major acquisition. One footnote: When we issued a press release about Todd’s joining us, a number of commentators pointed out that he was “little-known” and expressed puzzlement that we didn’t seek a “big-name.” I wonder how many of them would have known of Lou in 1979, Ajit in 1985, or, for that matter, Charlie in 1959. Our goal was to find a 2-year-old Secretariat, not a 10-year-old Seabiscuit. (Whoops – that may not be the smartest metaphor for an 80-year-old CEO to use.) Derivatives Two years ago, in the 2008 Annual Report, I told you that Berkshire was a party to 251 derivatives contracts (other than those used for operations at our subsidiaries, such as MidAmerican, and the few left over at Gen Re). Today, the comparable number is 203, a figure reflecting both a few additions to our portfolio and the unwinding or expiration of some contracts. Our continuing positions, all of which I am personally responsible for, fall largely into two categories. We view both categories as engaging us in insurance-like activities in which we receive premiums for assuming risks that others wish to shed. Indeed, the thought processes we employ in these derivatives transactions are identical to those we use in our insurance business. You should also understand that we get paid up-front when we enter into the contracts and therefore run no counterparty risk. That’s important. Our first category of derivatives consists of a number of contracts, written in 2004-2008, that required payments by us if there were bond defaults by companies included in certain high-yield indices. With minor exceptions, we were exposed to these risks for five years, with each contract covering 100 companies. In aggregate, we received premiums of $3.4 billion for these contracts. When I originally told you in our 2007 Annual Report about them, I said that I expected the contracts would deliver us an “underwriting profit,” meaning that our losses would be less than the premiums we received. In addition, I said we would benefit from the use of float. 19
  • 19. Subsequently, as you know too well, we encountered both a financial panic and a severe recession. A number of the companies in the high-yield indices failed, which required us to pay losses of $2.5 billion. Today, however, our exposure is largely behind us because most of our higher-risk contracts have expired. Consequently, it appears almost certain that we will earn an underwriting profit as we originally anticipated. In addition, we have had the use of interest-free float that averaged about $2 billion over the life of the contracts. In short, we charged the right premium, and that protected us when business conditions turned terrible three years ago. Our other large derivatives position – whose contracts go by the name of “equity puts” – involves insurance we wrote for parties wishing to protect themselves against a possible decline in equity prices in the U.S., U.K., Europe and Japan. These contracts are tied to various equity indices, such as the S&P 500 in the U.S. and the FTSE 100 in the U.K. In the 2004-2008 period, we received $4.8 billion of premiums for 47 of these contracts, most of which ran for 15 years. On these contracts, only the price of the indices on the termination date counts: No payments can be required before then. As a first step in updating you about these contracts, I can report that late in 2010, at the instigation of our counterparty, we unwound eight contracts, all of them due between 2021 and 2028. We had originally received $647 million in premiums for these contracts, and the unwinding required us to pay $425 million. Consequently, we realized a gain of $222 million and also had the interest-free and unrestricted use of that $647 million for about three years. Those 2010 transactions left us with 39 equity put contracts remaining on our books at yearend. On these, at their initiation, we received premiums of $4.2 billion. The future of these contracts is, of course, uncertain. But here is one perspective on them. If the prices of the relevant indices are the same at the contract expiration dates as these prices were on December 31, 2010 – and foreign exchange rates are unchanged – we would owe $3.8 billion on expirations occurring from 2018 to 2026. You can call this amount “settlement value.” On our yearend balance sheet, however, we carry the liability for those remaining equity puts at $6.7 billion. In other words, if the prices of the relevant indices remain unchanged from that date, we will record a $2.9 billion gain in the years to come, that being the difference between the liability figure of $6.7 billion and the settlement value of $3.8 billion. I believe that equity prices will very likely increase and that our liability will fall significantly between now and settlement date. If so, our gain from this point will be even greater. But that, of course, is far from a sure thing. What is sure is that we will have the use of our remaining “float” of $4.2 billion for an average of about 10 more years. (Neither this float nor that arising from the high-yield contracts is included in the insurance float figure of $66 billion.) Since money is fungible, think of a portion of these funds as contributing to the purchase of BNSF. As I have told you before, almost all of our derivatives contracts are free of any obligation to post collateral – a fact that cut the premiums we could otherwise have charged. But that fact also left us feeling comfortable during the financial crisis, allowing us in those days to commit to some advantageous purchases. Foregoing some additional derivatives premiums proved to be well worth it. On Reporting and Misreporting: The Numbers That Count and Those That Don’t Earlier in this letter, I pointed out some numbers that Charlie and I find useful in valuing Berkshire and measuring its progress. Let’s focus here on a number we omitted, but which many in the media feature above all others: net income. Important though that number may be at most companies, it is almost always meaningless at Berkshire. Regardless of how our businesses might be doing, Charlie and I could – quite legally – cause net income in any given period to be almost any number we would like. 20
  • 20. We have that flexibility because realized gains or losses on investments go into the net income figure, whereas unrealized gains (and, in most cases, losses) are excluded. For example, imagine that Berkshire had a $10 billion increase in unrealized gains in a given year and concurrently had $1 billion of realized losses. Our net income – which would count only the loss – would be reported as less than our operating income. If we had meanwhile realized gains in the previous year, headlines might proclaim that our earnings were down X% when in reality our business might be much improved. If we really thought net income important, we could regularly feed realized gains into it simply because we have a huge amount of unrealized gains upon which to draw. Rest assured, though, that Charlie and I have never sold a security because of the effect a sale would have on the net income we were soon to report. We both have a deep disgust for “game playing” with numbers, a practice that was rampant throughout corporate America in the 1990s and still persists, though it occurs less frequently and less blatantly than it used to. Operating earnings, despite having some shortcomings, are in general a reasonable guide as to how our businesses are doing. Ignore our net income figure, however. Regulations require that we report it to you. But if you find reporters focusing on it, that will speak more to their performance than ours. Both realized and unrealized gains and losses are fully reflected in the calculation of our book value. Pay attention to the changes in that metric and to the course of our operating earnings, and you will be on the right track. ************ As a p.s., I can’t resist pointing out just how capricious reported net income can be. Had our equity puts had a termination date of June 30, 2010, we would have been required to pay $6.4 billion to our counterparties at that date. Security prices then generally rose in the next quarter, a move that brought the corresponding figure down to $5.8 billion on September 30th. Yet the Black-Scholes formula that we use in valuing these contracts required us to increase our balance-sheet liability during this period from $8.9 billion to $9.6 billion, a change that, after the effect of tax accruals, reduced our net income for the quarter by $455 million. Both Charlie and I believe that Black-Scholes produces wildly inappropriate values when applied to long-dated options. We set out one absurd example in these pages two years ago. More tangibly, we put our money where our mouth was by entering into our equity put contracts. By doing so, we implicitly asserted that the Black-Scholes calculations used by our counterparties or their customers were faulty. We continue, nevertheless, to use that formula in presenting our financial statements. Black-Scholes is the accepted standard for option valuation – almost all leading business schools teach it – and we would be accused of shoddy accounting if we deviated from it. Moreover, we would present our auditors with an insurmountable problem were we to do that: They have clients who are our counterparties and who use Black- Scholes values for the same contracts we hold. It would be impossible for our auditors to attest to the accuracy of both their values and ours were the two far apart. Part of the appeal of Black-Scholes to auditors and regulators is that it produces a precise number. Charlie and I can’t supply one of those. We believe the true liability of our contracts to be far lower than that calculated by Black-Scholes, but we can’t come up with an exact figure – anymore than we can come up with a precise value for GEICO, BNSF, or for Berkshire Hathaway itself. Our inability to pinpoint a number doesn’t bother us: We would rather be approximately right than precisely wrong. John Kenneth Galbraith once slyly observed that economists were most economical with ideas: They made the ones learned in graduate school last a lifetime. University finance departments often behave similarly. Witness the tenacity with which almost all clung to the theory of efficient markets throughout the 1970s and 1980s, dismissively calling powerful facts that refuted it “anomalies.” (I always love explanations of that kind: The Flat Earth Society probably views a ship’s circling of the globe as an annoying, but inconsequential, anomaly.) 21
  • 21. Academics’ current practice of teaching Black-Scholes as revealed truth needs re-examination. For that matter, so does the academic’s inclination to dwell on the valuation of options. You can be highly successful as an investor without having the slightest ability to value an option. What students should be learning is how to value a business. That’s what investing is all about. Life and Debt The fundamental principle of auto racing is that to finish first, you must first finish. That dictum is equally applicable to business and guides our every action at Berkshire. Unquestionably, some people have become very rich through the use of borrowed money. However, that’s also been a way to get very poor. When leverage works, it magnifies your gains. Your spouse thinks you’re clever, and your neighbors get envious. But leverage is addictive. Once having profited from its wonders, very few people retreat to more conservative practices. And as we all learned in third grade – and some relearned in 2008 – any series of positive numbers, however impressive the numbers may be, evaporates when multiplied by a single zero. History tells us that leverage all too often produces zeroes, even when it is employed by very smart people. Leverage, of course, can be lethal to businesses as well. Companies with large debts often assume that these obligations can be refinanced as they mature. That assumption is usually valid. Occasionally, though, either because of company-specific problems or a worldwide shortage of credit, maturities must actually be met by payment. For that, only cash will do the job. Borrowers then learn that credit is like oxygen. When either is abundant, its presence goes unnoticed. When either is missing, that’s all that is noticed. Even a short absence of credit can bring a company to its knees. In September 2008, in fact, its overnight disappearance in many sectors of the economy came dangerously close to bringing our entire country to its knees. Charlie and I have no interest in any activity that could pose the slightest threat to Berkshire’s well- being. (With our having a combined age of 167, starting over is not on our bucket list.) We are forever conscious of the fact that you, our partners, have entrusted us with what in many cases is a major portion of your savings. In addition, important philanthropy is dependent on our prudence. Finally, many disabled victims of accidents caused by our insureds are counting on us to deliver sums payable decades from now. It would be irresponsible for us to risk what all these constituencies need just to pursue a few points of extra return. A little personal history may partially explain our extreme aversion to financial adventurism. I didn’t meet Charlie until he was 35, though he grew up within 100 yards of where I have lived for 52 years and also attended the same inner-city public high school in Omaha from which my father, wife, children and two grandchildren graduated. Charlie and I did, however, both work as young boys at my grandfather’s grocery store, though our periods of employment were separated by about five years. My grandfather’s name was Ernest, and perhaps no man was more aptly named. No one worked for Ernest, even as a stock boy, without being shaped by the experience. On the facing page you can read a letter sent in 1939 by Ernest to his youngest son, my Uncle Fred. Similar letters went to his other four children. I still have the letter sent to my Aunt Alice, which I found – along with $1,000 of cash – when, as executor of her estate, I opened her safe deposit box in 1970. Ernest never went to business school – he never in fact finished high school – but he understood the importance of liquidity as a condition for assured survival. At Berkshire, we have taken his $1,000 solution a bit further and have pledged that we will hold at least $10 billion of cash, excluding that held at our regulated utility and railroad businesses. Because of that commitment, we customarily keep at least $20 billion on hand so that we can both withstand unprecedented insurance losses (our largest to date having been about $3 billion from Katrina, the insurance industry’s most expensive catastrophe) and quickly seize acquisition or investment opportunities, even during times of financial turmoil. 22
  • 22. 23