Download as PDF, PPTX
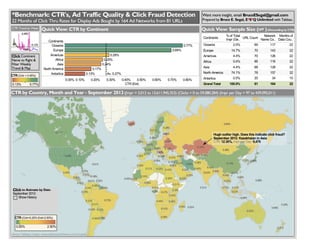

This document contains click-through rate (CTR) data for display ads from 164 ad networks on 81 URLs over 22 months. It includes CTR percentages by continent and country for September 2012, with Kazakhstan having the highest CTR that month at 12.30%. Charts display the CTR by continent and sample size by network, showing Asia as having the largest share. The author offers to provide more insight into using the data for CTR benchmarking, ad traffic quality analysis, and click fraud detection.


