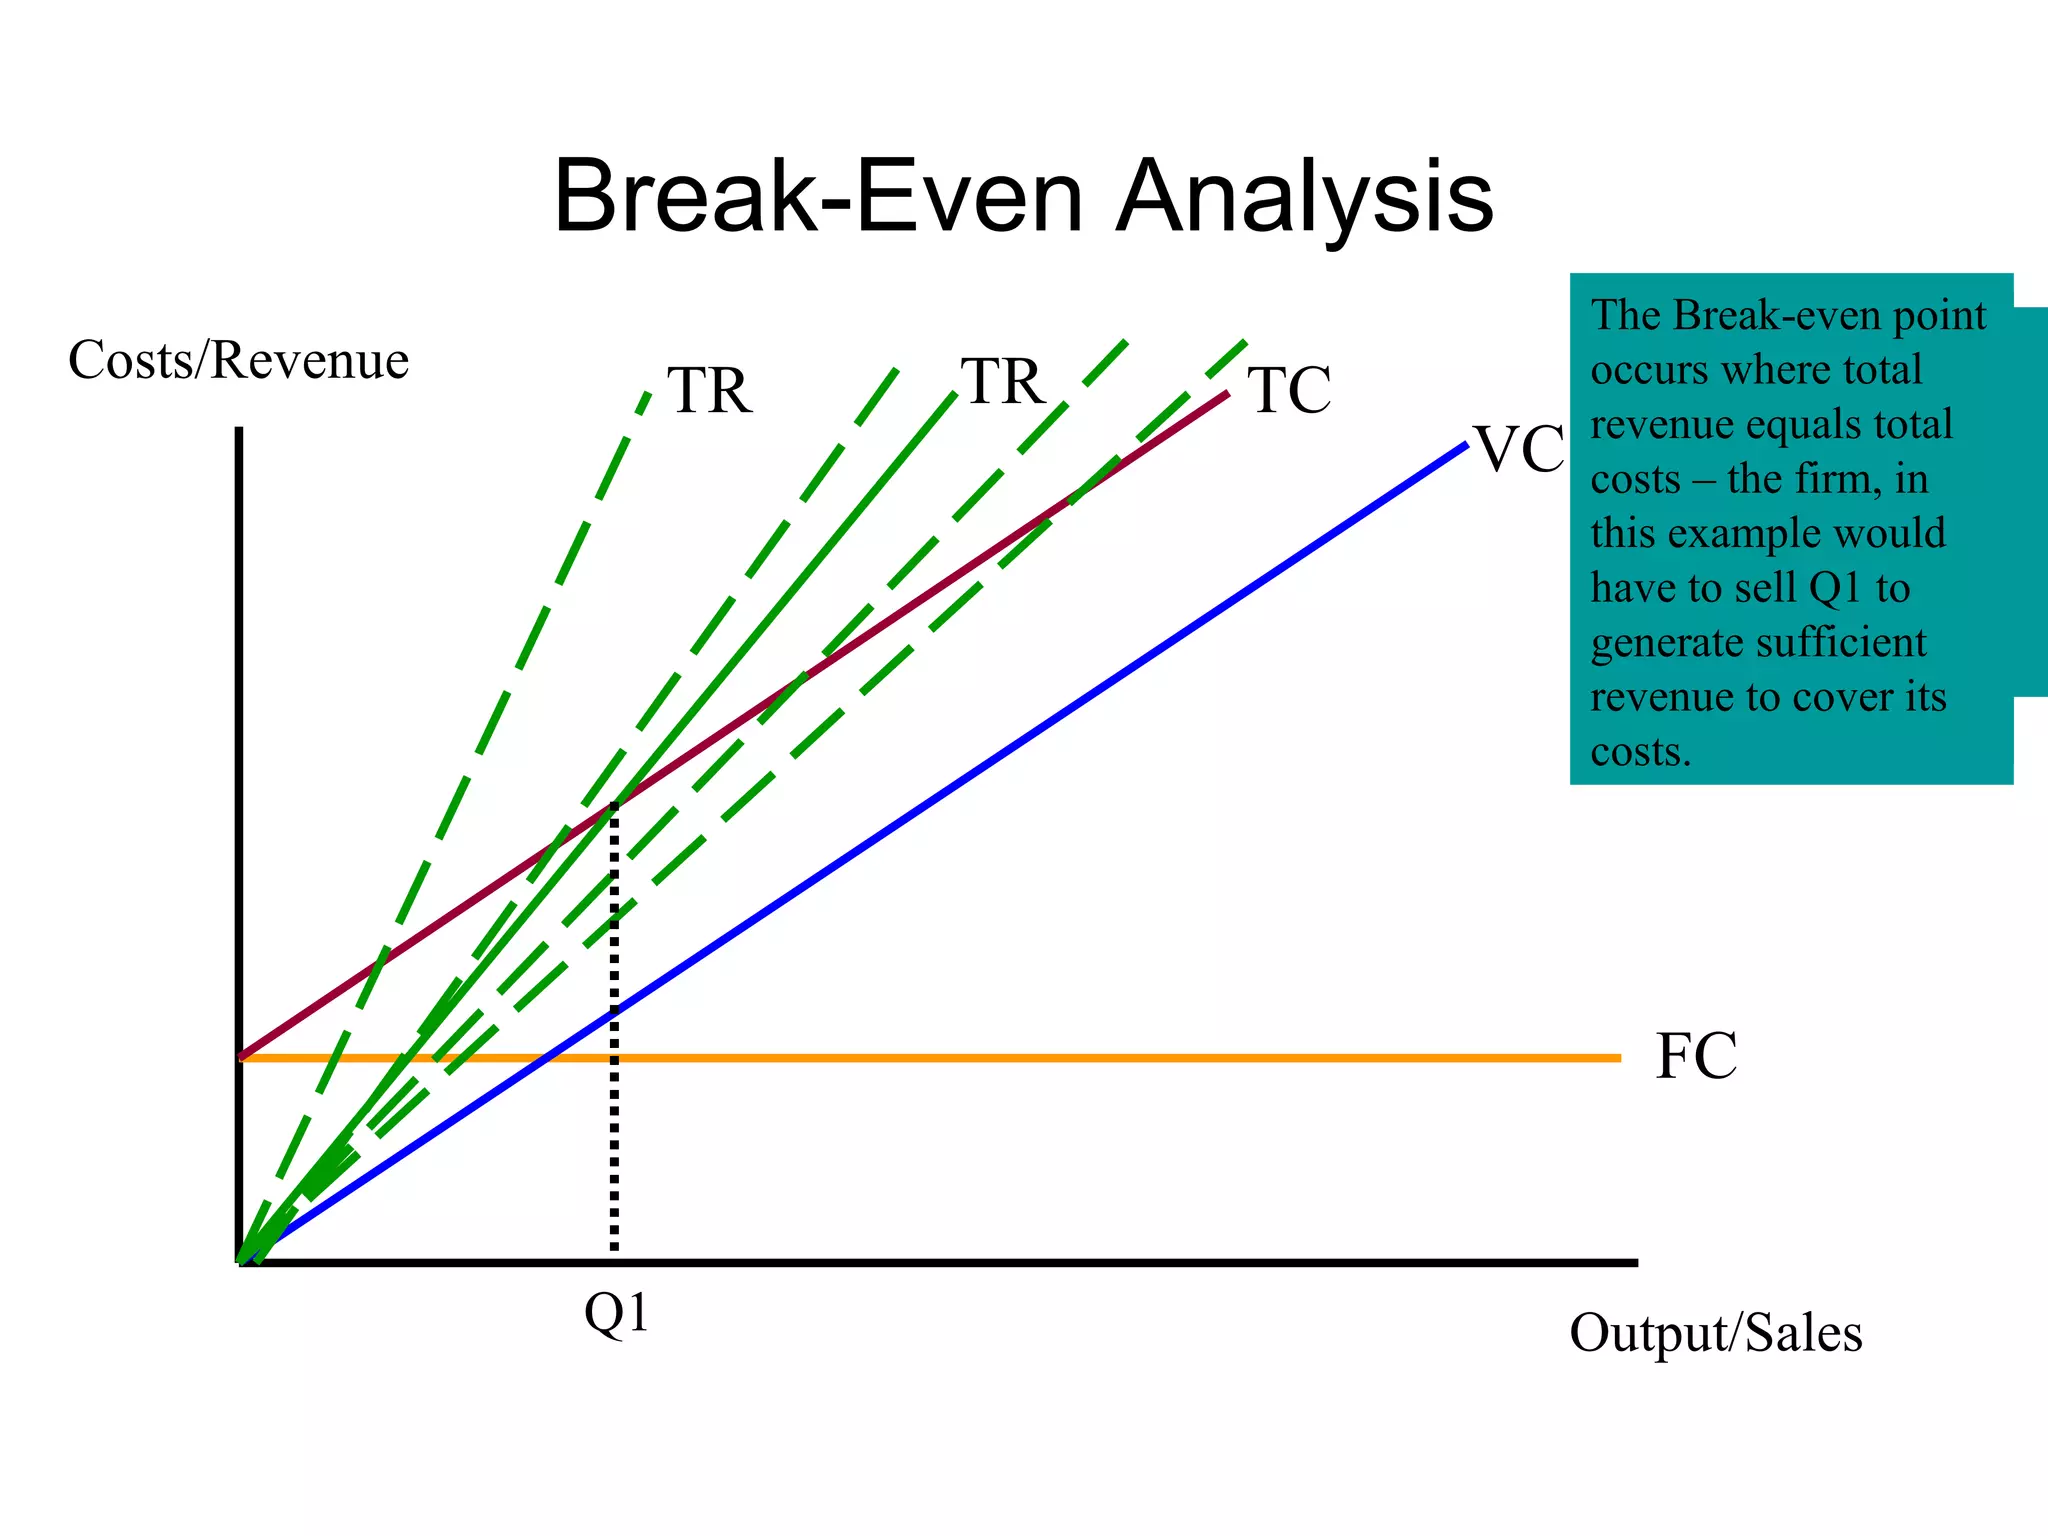
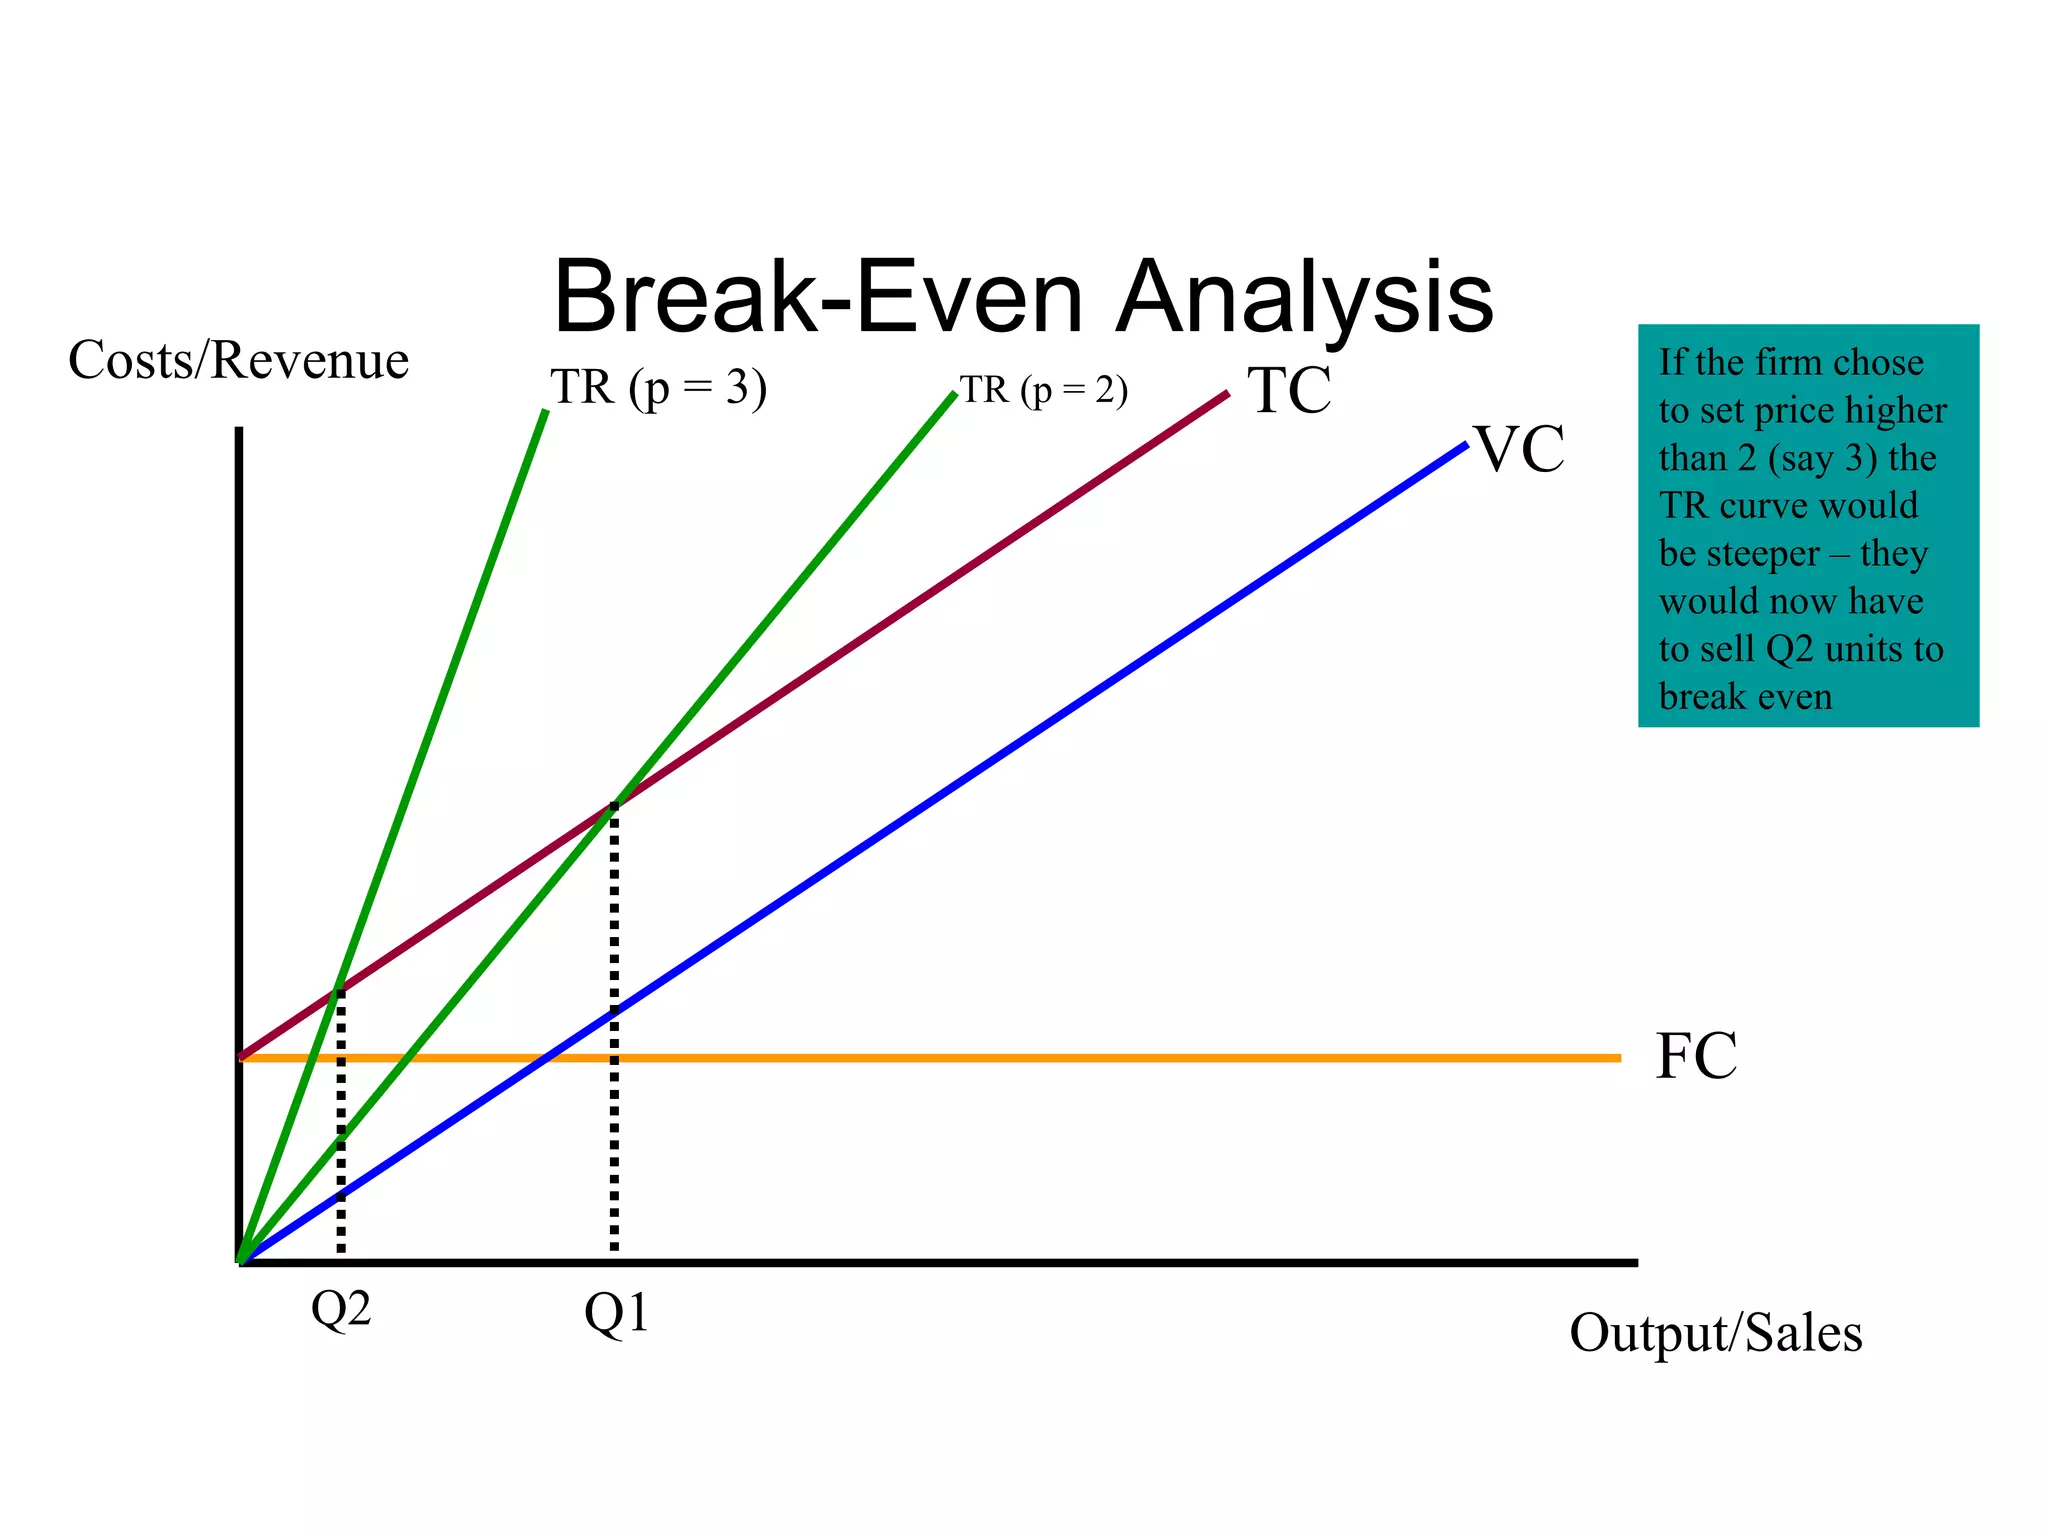
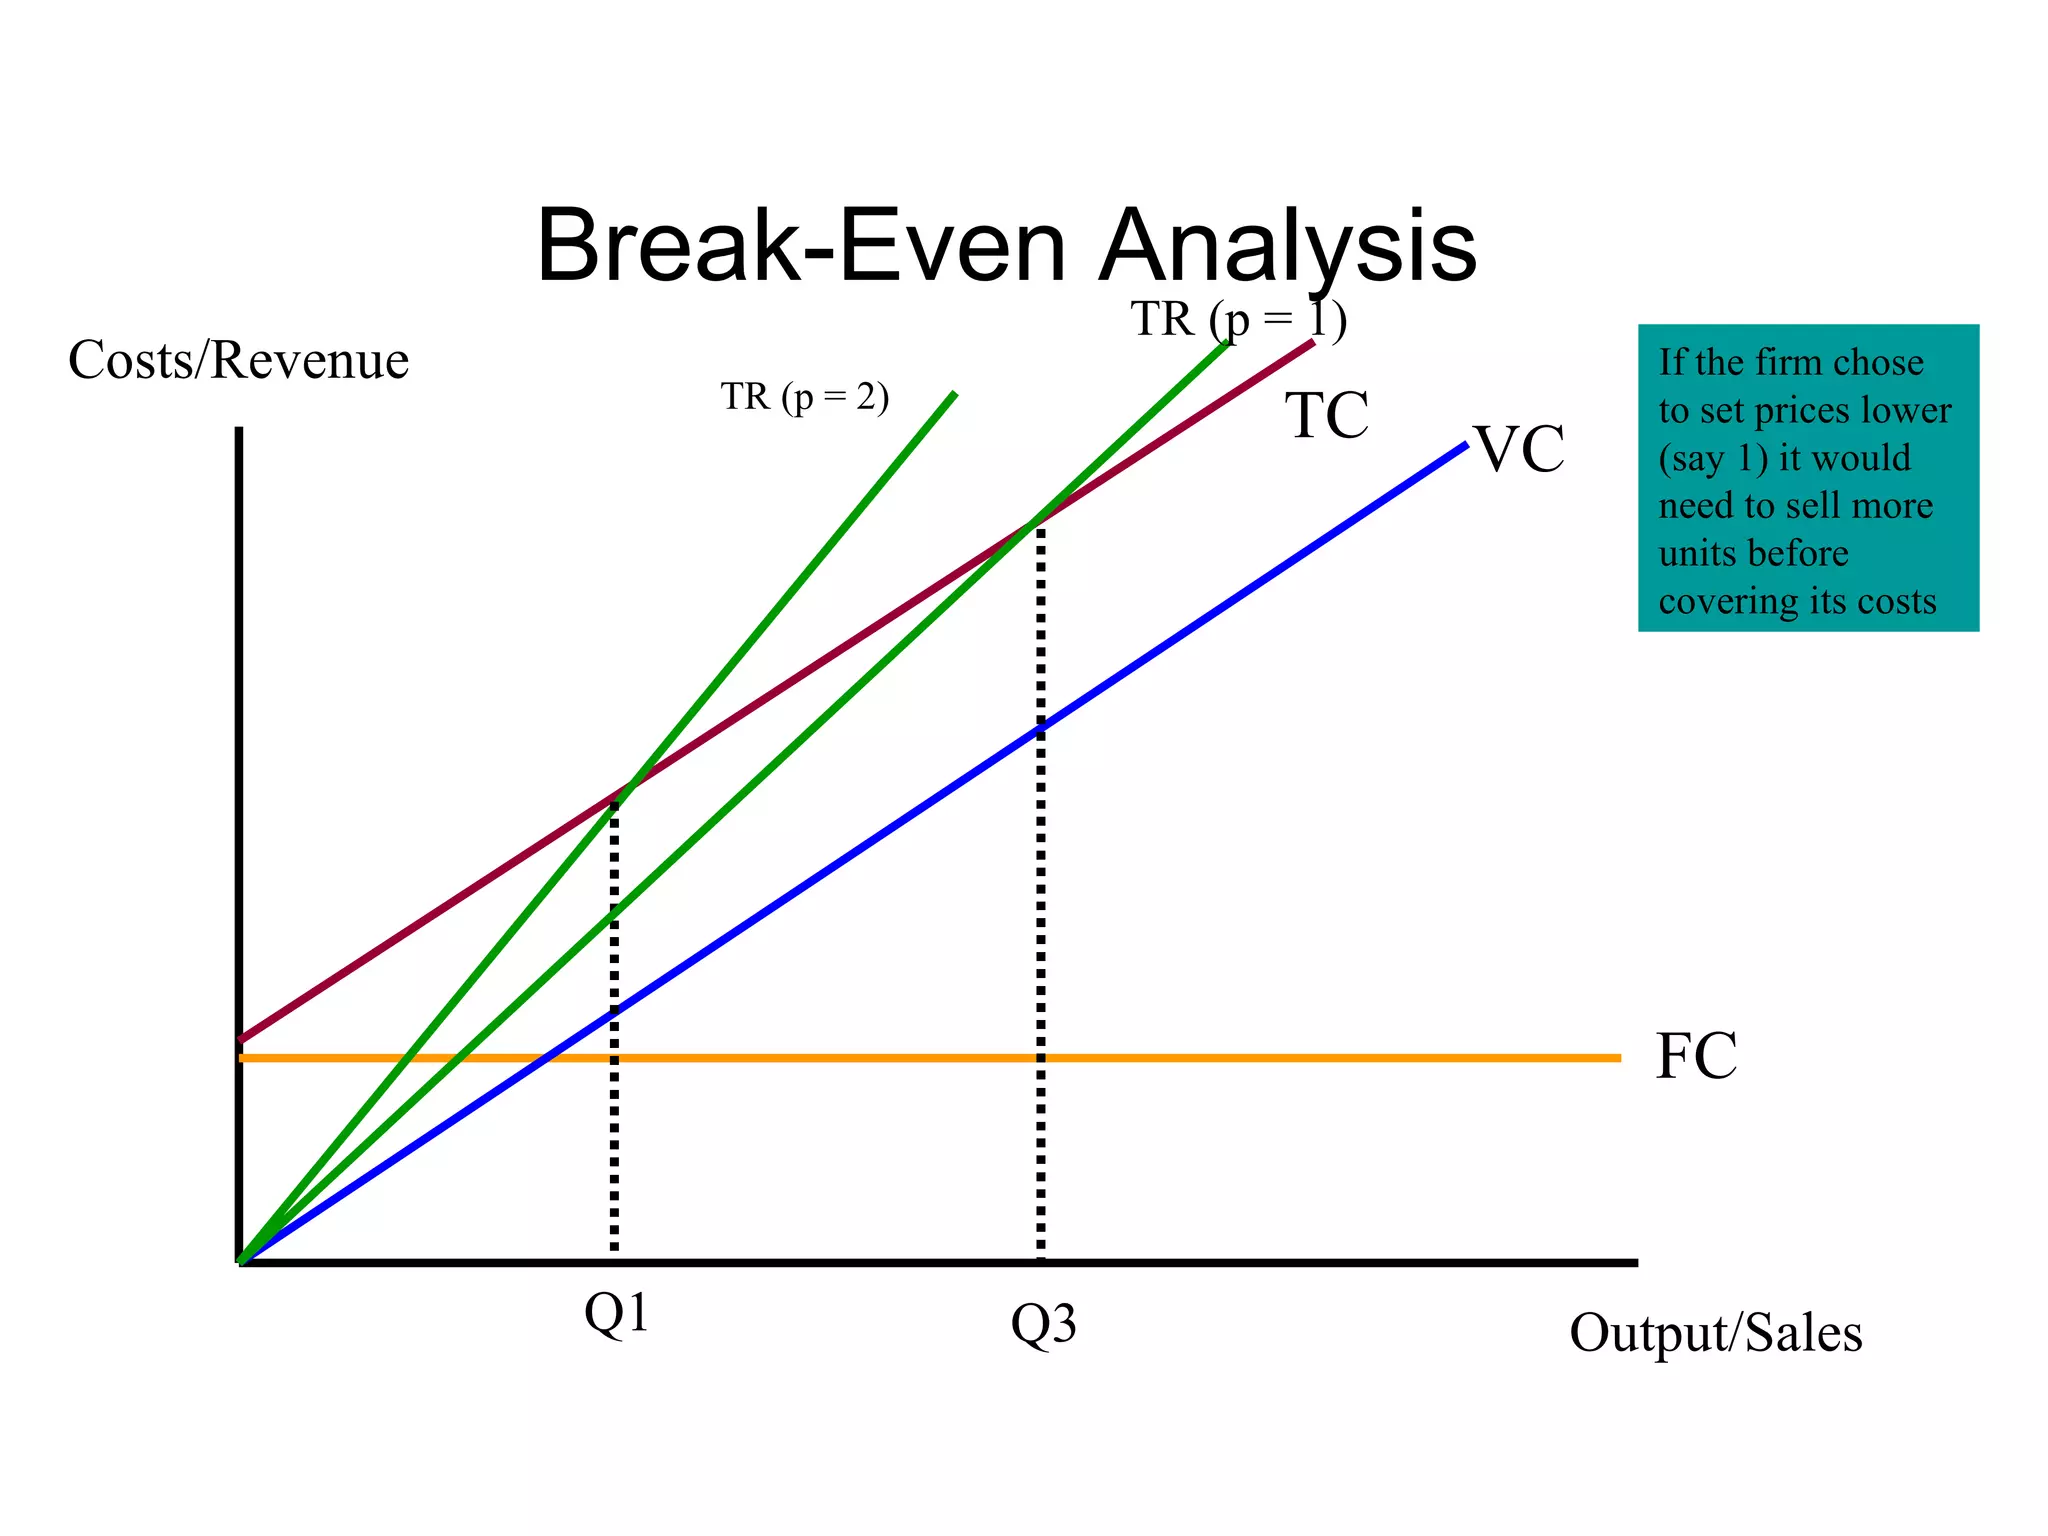
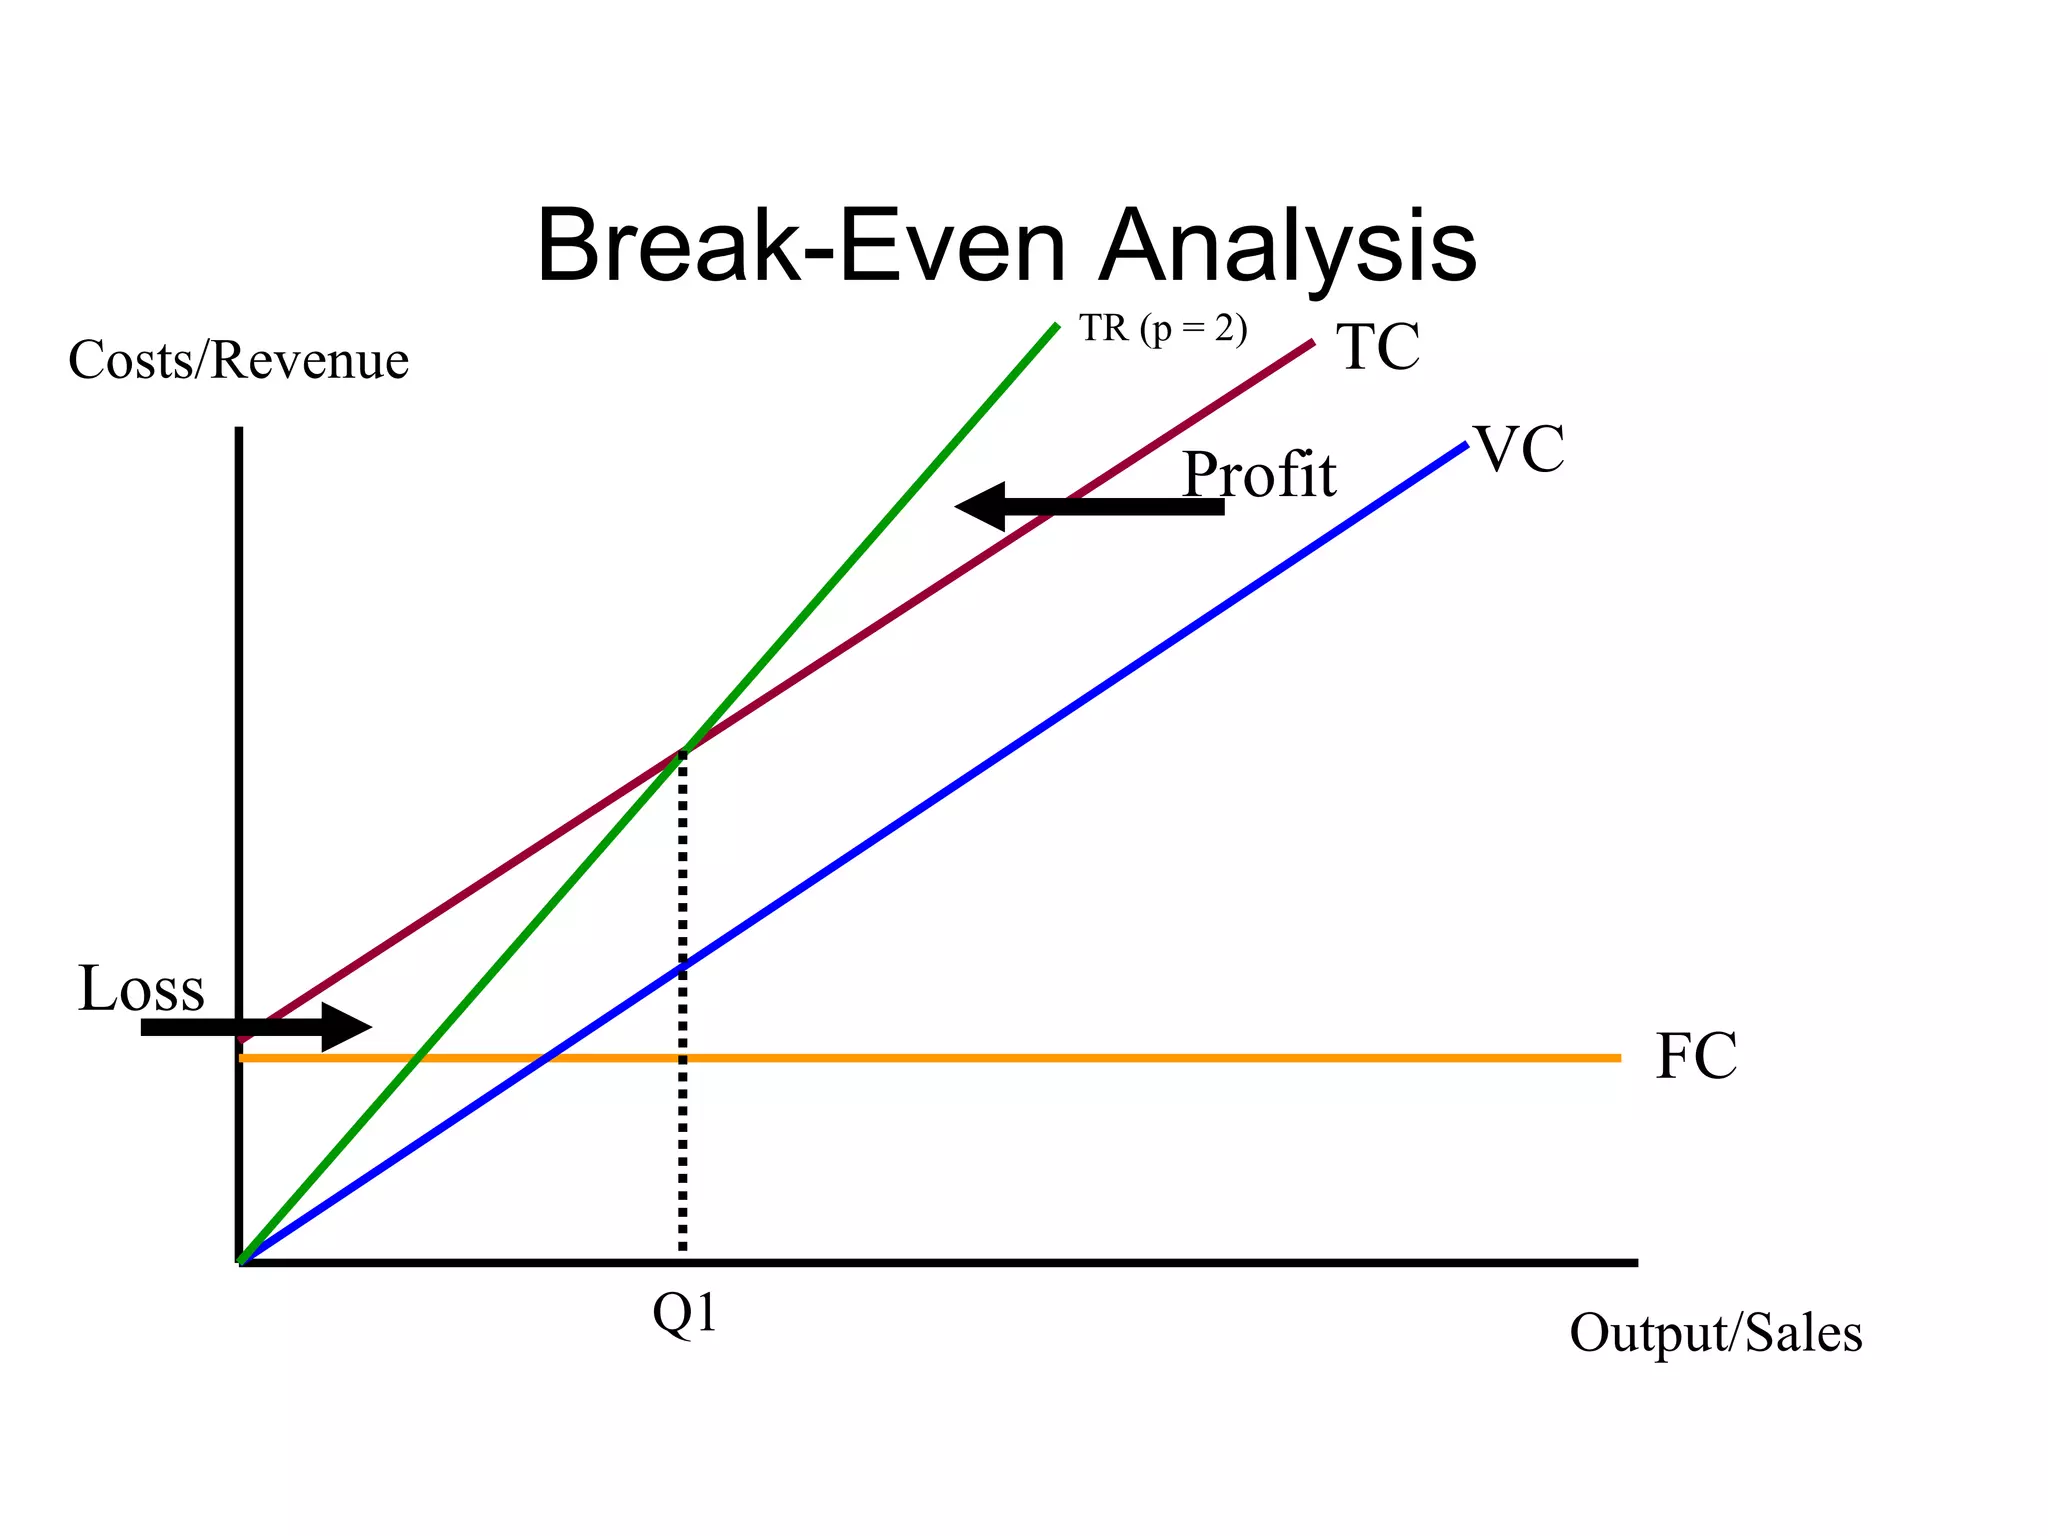
Breakeven Analysis
Introduction Break-even analysis is based on categorizing production costs between those which are "variable" (costs that change when the production output changes) and those that are "fixed" (costs not directly related to the volume of production). Total variable and fixed costs are compared with sales revenue in order to determine the  level of sales volume, sales value or production at which the business makes neither a profit nor a loss (the "break-even point").
Break-Even Analysis Importance of  Price Elasticity of Demand : Higher prices  might mean fewer sales to break-even but those sales may take a longer time to achieve. Lower prices  might encourage more customers but higher volume needed before sufficient revenue generated to break-even
Break-Even Analysis Links of BE to pricing strategies and elasticity Penetration pricing  – ‘high’ volume, ‘low’ price – more sales to break even Market Skimming  – ‘high’ price ‘low’ volumes – fewer sales to break even Elasticity  – what is likely to happen to sales when prices are increased or decreased?
Break-Even Analysis Costs/Revenue Output/Sales Initially a firm will incur fixed costs, these do not depend on output or sales. FC As output is generated, the firm will incur variable costs – these vary directly with the amount produced VC The total costs therefore (assuming accurate forecasts!) is the sum of FC+VC TC Total revenue is determined by the price charged and the quantity sold – again this will be determined by expected forecast sales initially. TR The lower the price, the less steep the total revenue curve. TR Q1 The Break-even point occurs where total revenue equals total costs – the firm, in this example would have to sell Q1 to generate sufficient revenue to cover its costs.
Break-Even Analysis Costs/Revenue Output/Sales FC VC TC TR (p = 2) Q1 If the firm chose to set price higher than 2 (say 3) the TR curve would be steeper – they would now have to sell Q2 units to break even TR (p = 3) Q2
Break-Even Analysis Costs/Revenue Output/Sales FC VC TC TR (p = 2) Q1 If the firm chose to set prices lower (say 1) it would need to sell more units before covering its costs TR (p = 1) Q3
Break-Even Analysis Costs/Revenue Output/Sales FC VC TC TR (p = 2) Q1 Loss Profit

Breakeven analysis iimm

  • 1.
  • 2.
    Introduction Break-even analysisis based on categorizing production costs between those which are "variable" (costs that change when the production output changes) and those that are "fixed" (costs not directly related to the volume of production). Total variable and fixed costs are compared with sales revenue in order to determine the level of sales volume, sales value or production at which the business makes neither a profit nor a loss (the "break-even point").
  • 3.
    Break-Even Analysis Importanceof Price Elasticity of Demand : Higher prices might mean fewer sales to break-even but those sales may take a longer time to achieve. Lower prices might encourage more customers but higher volume needed before sufficient revenue generated to break-even
  • 4.
    Break-Even Analysis Linksof BE to pricing strategies and elasticity Penetration pricing – ‘high’ volume, ‘low’ price – more sales to break even Market Skimming – ‘high’ price ‘low’ volumes – fewer sales to break even Elasticity – what is likely to happen to sales when prices are increased or decreased?
  • 5.
    Break-Even Analysis Costs/RevenueOutput/Sales Initially a firm will incur fixed costs, these do not depend on output or sales. FC As output is generated, the firm will incur variable costs – these vary directly with the amount produced VC The total costs therefore (assuming accurate forecasts!) is the sum of FC+VC TC Total revenue is determined by the price charged and the quantity sold – again this will be determined by expected forecast sales initially. TR The lower the price, the less steep the total revenue curve. TR Q1 The Break-even point occurs where total revenue equals total costs – the firm, in this example would have to sell Q1 to generate sufficient revenue to cover its costs.
  • 6.
    Break-Even Analysis Costs/RevenueOutput/Sales FC VC TC TR (p = 2) Q1 If the firm chose to set price higher than 2 (say 3) the TR curve would be steeper – they would now have to sell Q2 units to break even TR (p = 3) Q2
  • 7.
    Break-Even Analysis Costs/RevenueOutput/Sales FC VC TC TR (p = 2) Q1 If the firm chose to set prices lower (say 1) it would need to sell more units before covering its costs TR (p = 1) Q3
  • 8.
    Break-Even Analysis Costs/RevenueOutput/Sales FC VC TC TR (p = 2) Q1 Loss Profit