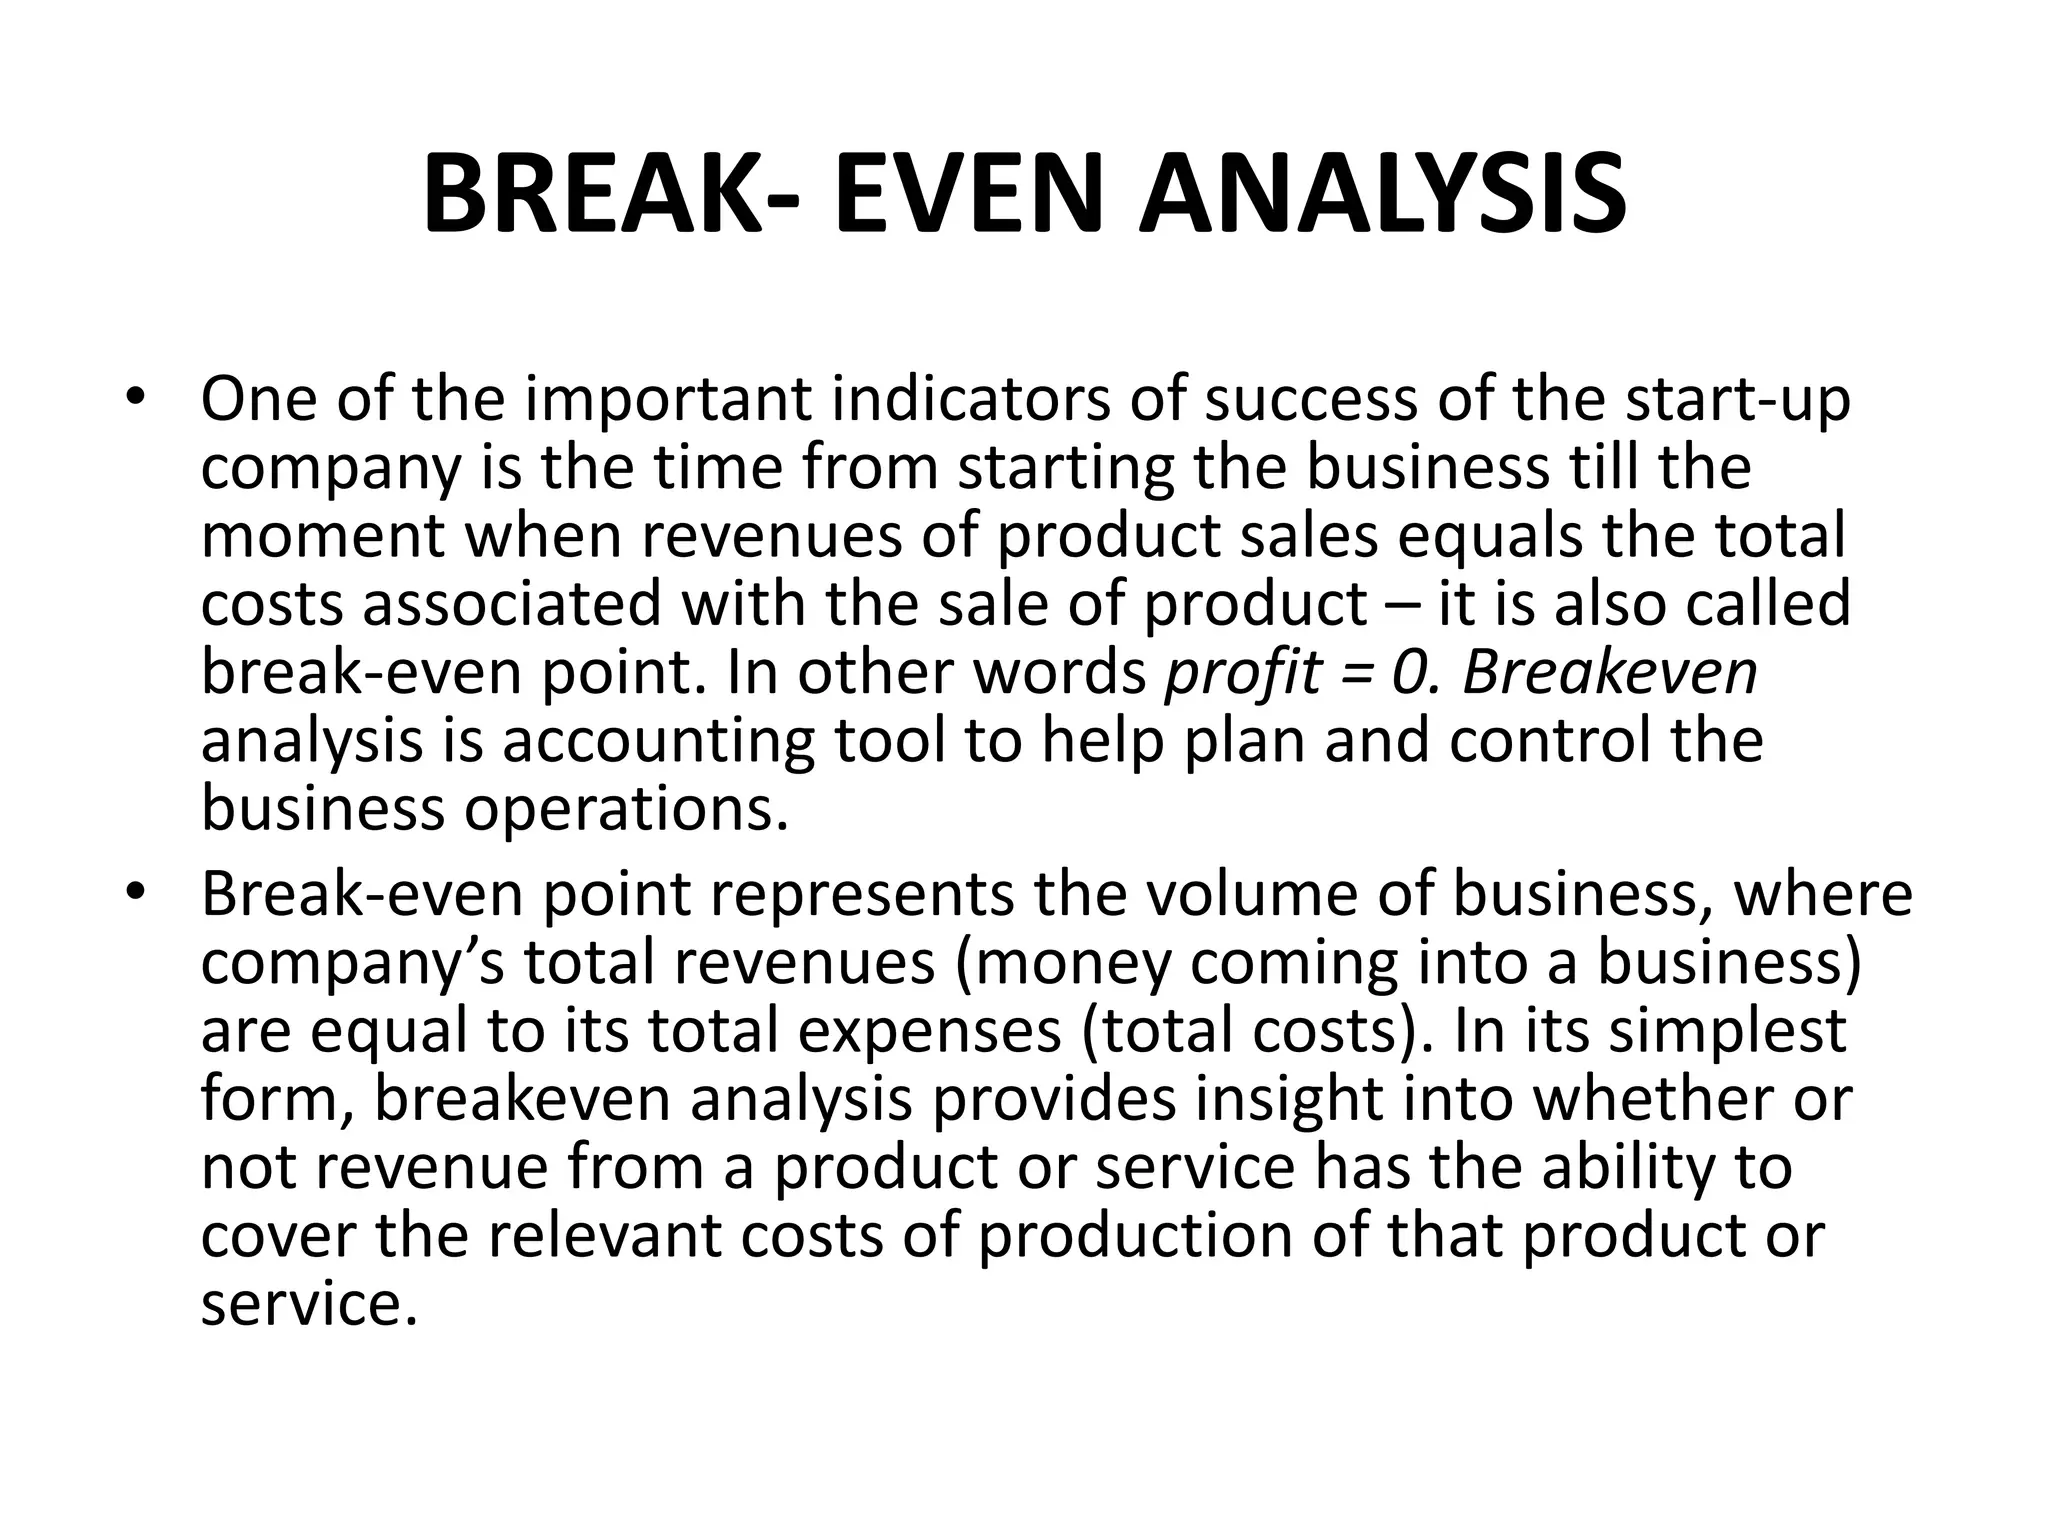
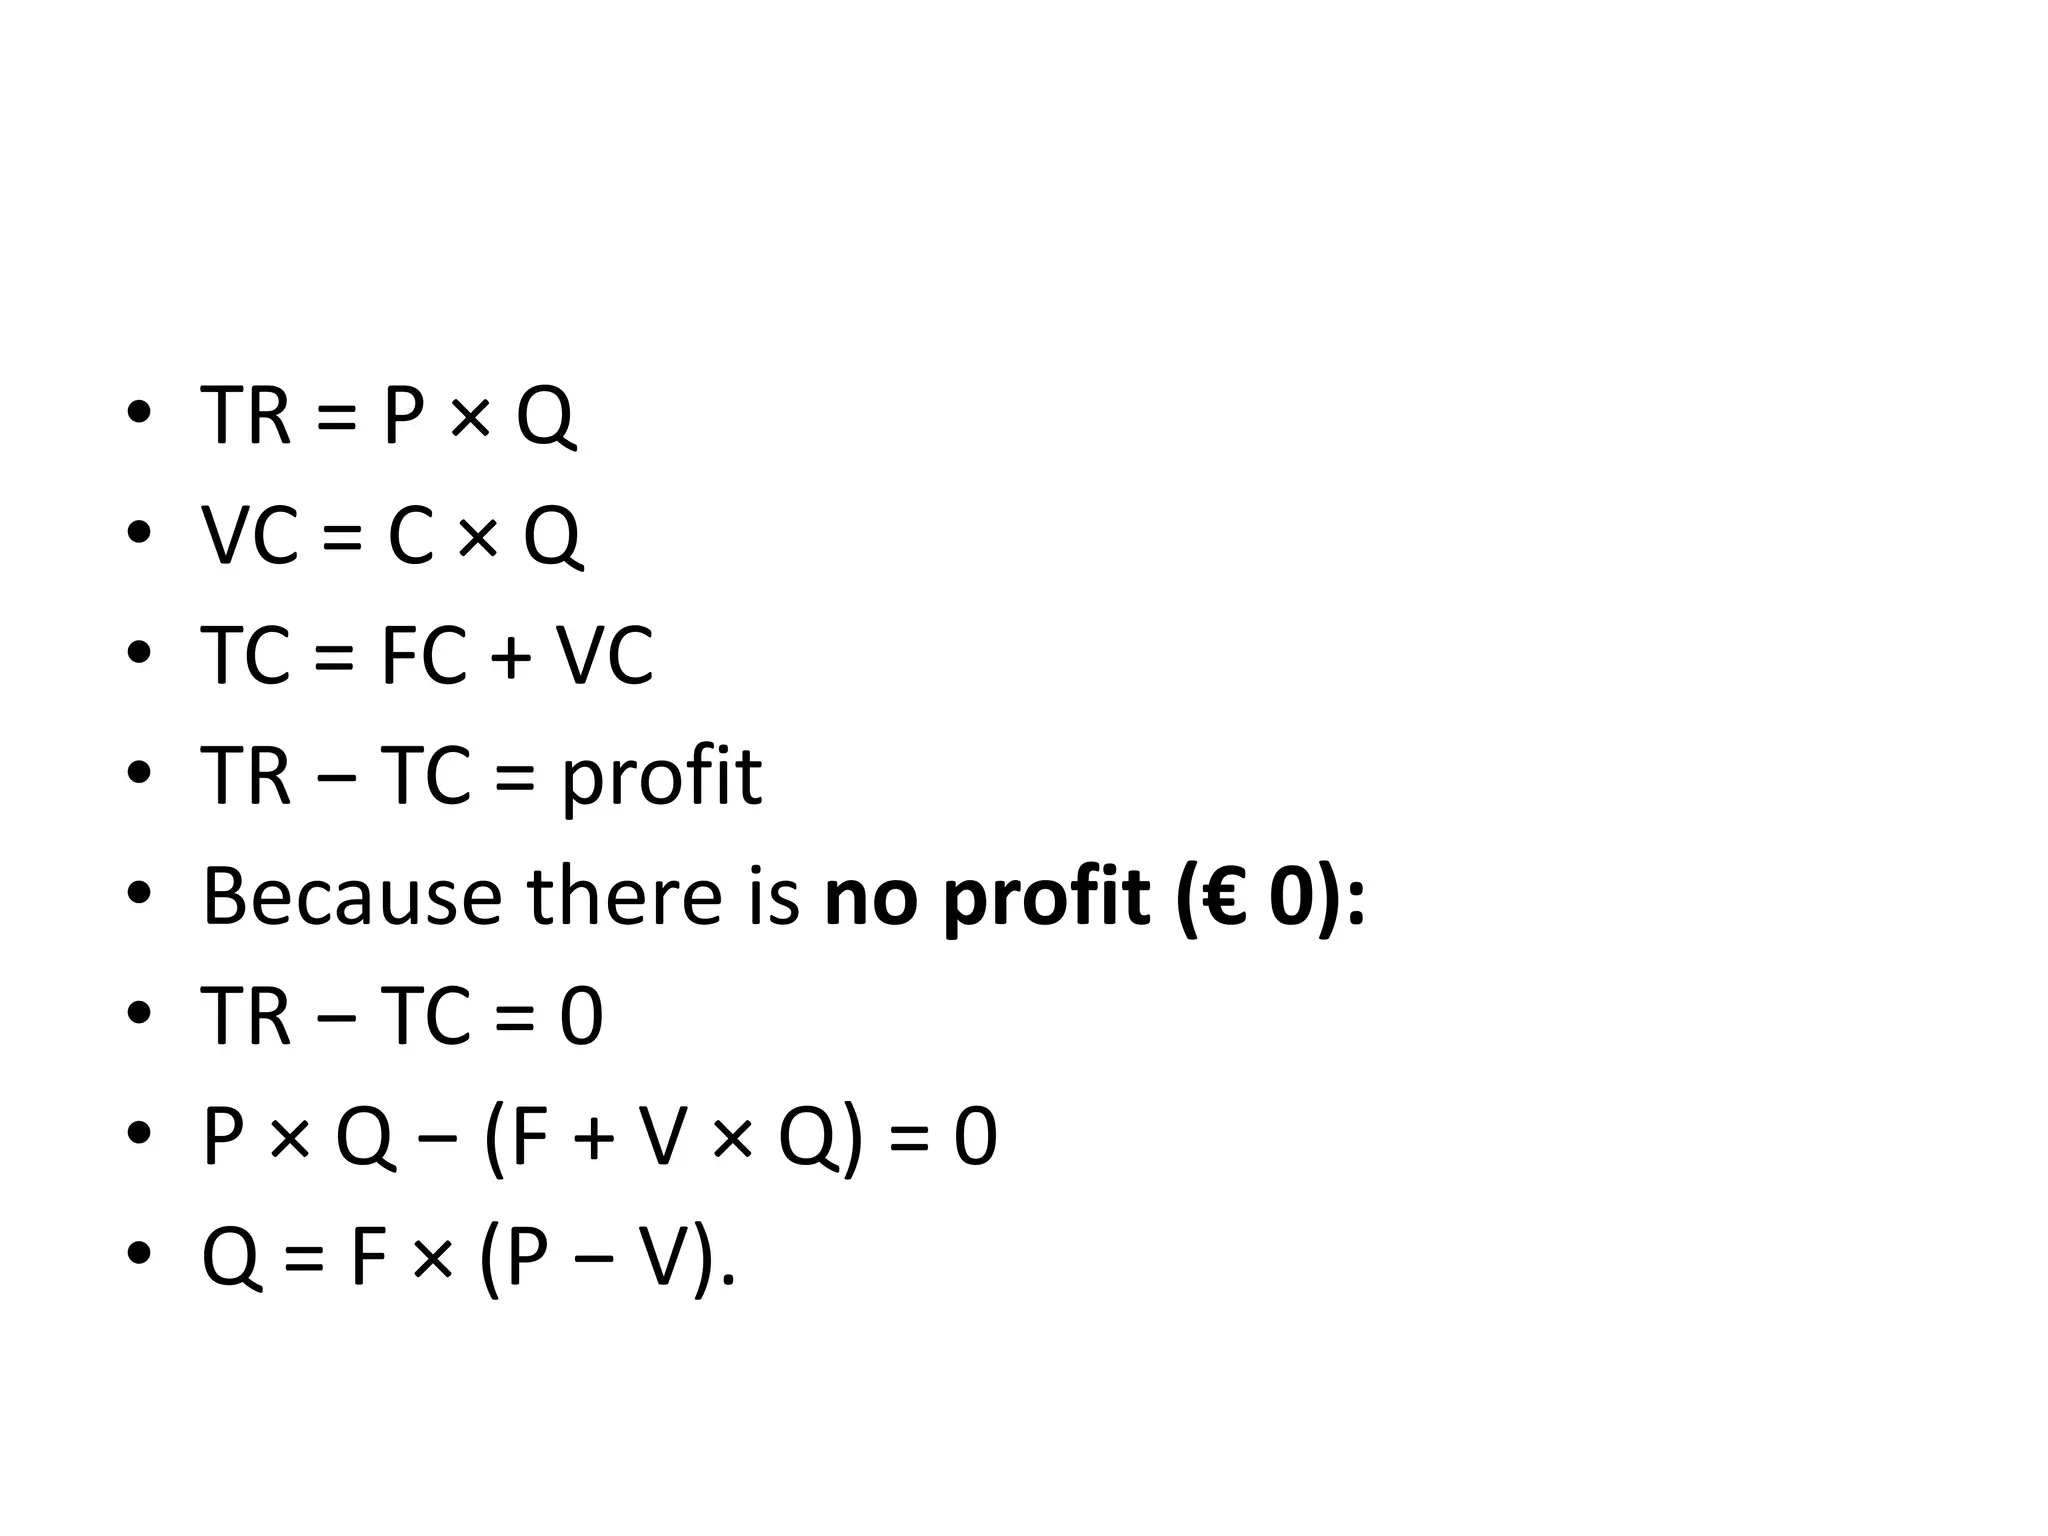
BREAK- EVEN ANALYSIS
• One of the important indicators of success of the start-up
company is the time from starting the business till the
moment when revenues of product sales equals the total
costs associated with the sale of product – it is also called
break-even point. In other words profit = 0. Breakeven
analysis is accounting tool to help plan and control the
business operations.
• Break-even point represents the volume of business, where
company’s total revenues (money coming into a business)
are equal to its total expenses (total costs). In its simplest
form, breakeven analysis provides insight into whether or
not revenue from a product or service has the ability to
cover the relevant costs of production of that product or
service.
Total cost = Total revenue
• Break-even analysis is based on categorizing
production costs between those which are:
• VARIABLE cost that do vary with the number of
units produced and sold (raw materials, fuel,
direct labor, revenue-related costs), and those
that are
• FIXED costs that don’t vary with the number of
units produced and sold (salaries,rent and rates,
depreciation, marketing costs, administration
costs, R&R, insurance)
• Calculating Break-even Point
• To calculate break-even point we need to know
following information:
• The price that the company is charging,
• variable costs (direct costs) of each unit andfixed
• TR = Total revenue,P = Selling price,Q = Number
of units sold,TC = Total costs,F = Fixed costs,V =
Variable costs,FC = Total fixed costs,VC = Total
variable costscosts (or indirect costs/overheads).
• TR = P × Q
• VC = C × Q
• TC = FC + VC
• TR − TC = profit
• Because there is no profit (€ 0):
• TR − TC = 0
• P × Q − (F + V × Q) = 0
• Q = F × (P − V).
• It is quicker to use the following formula:
• Break even analysis=fc/(p-vc)
• Note: the higher the fixed costs are the
higher is the break-even point!
Example of Break-even analysis
diagram
• Why do companies want (and need) to know the
break-even point?
• First, in order to even know what volume of
operations allows them to operate without loss,
or, what is the volume of business in which the
loss breaks in the profits;
• further in order to determine, if they sufficient
capacity for this volume of business and
ultimately therefore, to find out if there is
sufficient market for such volume of operations

Break even analysis

  • 1.
  • 2.
    BREAK- EVEN ANALYSIS •One of the important indicators of success of the start-up company is the time from starting the business till the moment when revenues of product sales equals the total costs associated with the sale of product – it is also called break-even point. In other words profit = 0. Breakeven analysis is accounting tool to help plan and control the business operations. • Break-even point represents the volume of business, where company’s total revenues (money coming into a business) are equal to its total expenses (total costs). In its simplest form, breakeven analysis provides insight into whether or not revenue from a product or service has the ability to cover the relevant costs of production of that product or service.
  • 3.
    Total cost =Total revenue • Break-even analysis is based on categorizing production costs between those which are: • VARIABLE cost that do vary with the number of units produced and sold (raw materials, fuel, direct labor, revenue-related costs), and those that are • FIXED costs that don’t vary with the number of units produced and sold (salaries,rent and rates, depreciation, marketing costs, administration costs, R&R, insurance)
  • 4.
    • Calculating Break-evenPoint • To calculate break-even point we need to know following information: • The price that the company is charging, • variable costs (direct costs) of each unit andfixed • TR = Total revenue,P = Selling price,Q = Number of units sold,TC = Total costs,F = Fixed costs,V = Variable costs,FC = Total fixed costs,VC = Total variable costscosts (or indirect costs/overheads).
  • 5.
    • TR =P × Q • VC = C × Q • TC = FC + VC • TR − TC = profit • Because there is no profit (€ 0): • TR − TC = 0 • P × Q − (F + V × Q) = 0 • Q = F × (P − V).
  • 6.
    • It isquicker to use the following formula: • Break even analysis=fc/(p-vc) • Note: the higher the fixed costs are the higher is the break-even point!
  • 7.
    Example of Break-evenanalysis diagram
  • 8.
    • Why docompanies want (and need) to know the break-even point? • First, in order to even know what volume of operations allows them to operate without loss, or, what is the volume of business in which the loss breaks in the profits; • further in order to determine, if they sufficient capacity for this volume of business and ultimately therefore, to find out if there is sufficient market for such volume of operations