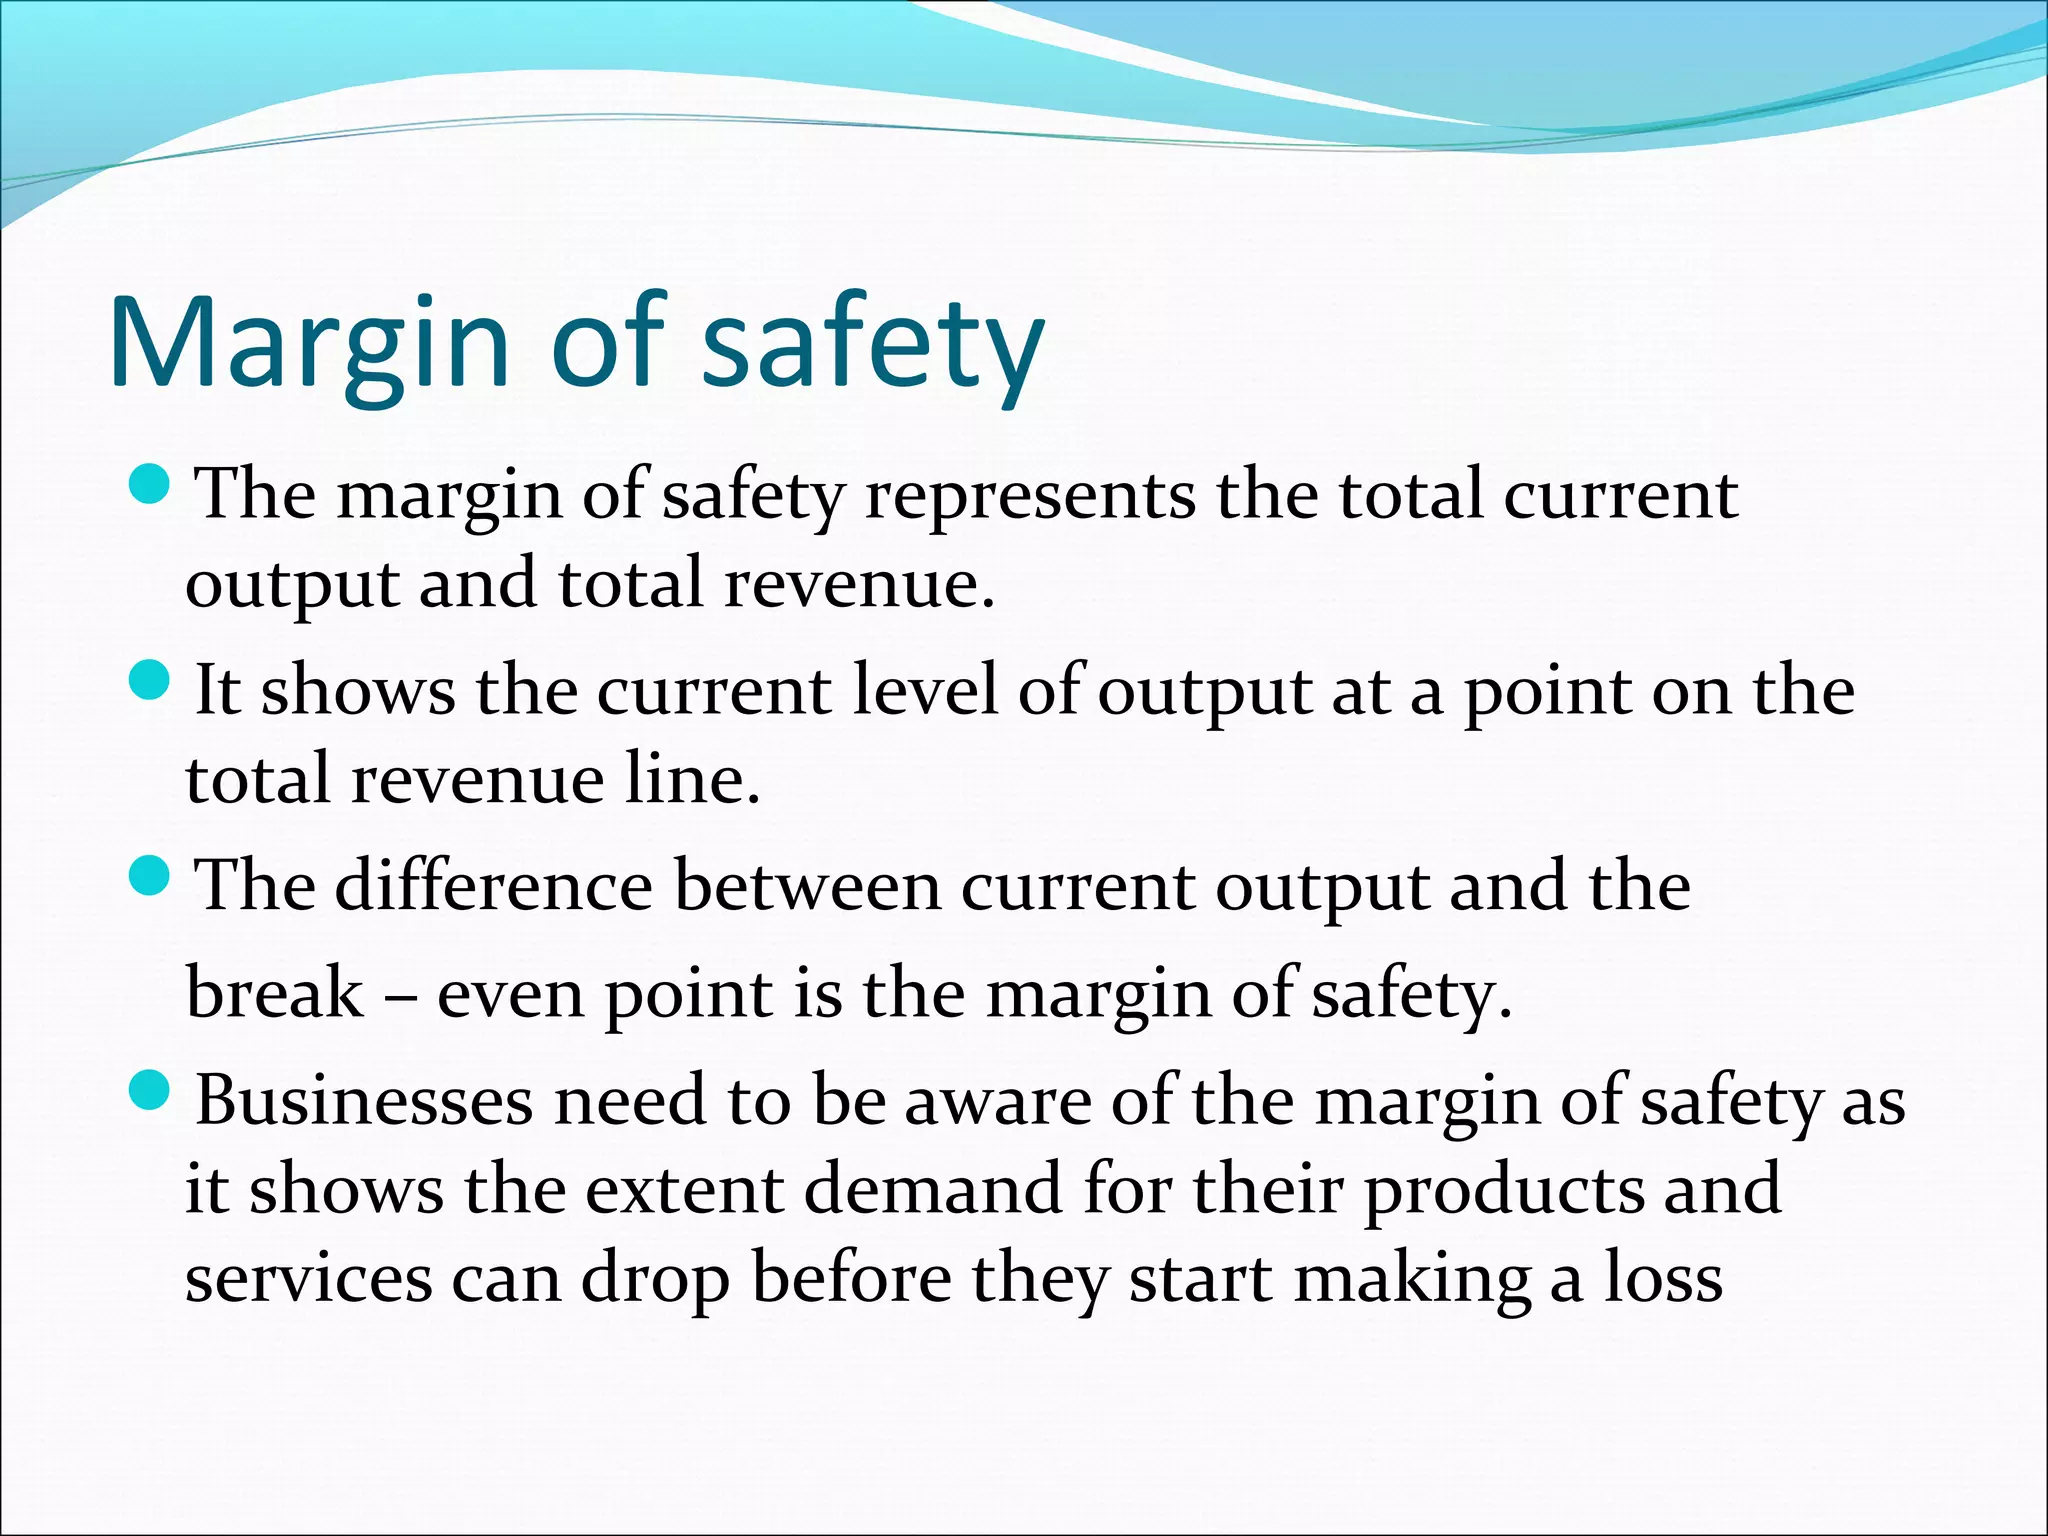
Recap
Fixed or variable
Security
Insurance
Electric
Workers
Telephone
Raw Materials
Accountant
Financial management
Learning Objectives
Introduction to break-even
Define and calculate contribution
Define and calculate contribution per unit
Identify the relationship between contribution, profit

and pricing
Assess the relationship between break – even and
contribution
What is Break - even?
It is the point at which a company is not making a loss

or a profit.
The business income equals its expenditures.
It is a significant marker as it allows management to
know the level of output required to sustain and
succeed.
It can be used to help determine pricing strategy,
budgets, quality and output quantity.
It is where Costs = Revenue within a business.
Always measured in production units never cost
Terms to be familiar with
Variable costs = changes depending on output.
Fixed costs (fixed overheads) = remains the same no

mater how much is produced
Total cost = Fixed cost + variable costs
Profit
Loss
Terms to be familiar continued
Output
Contribution
Revenue (Sales revenue) = when firms get money

from selling their products / services
Margin of Safety
Break – even point
Variable costs
Variable costs correlate to output
This could be the price of ink, or fabric within a T-

shirt factory.
Variable costs can be reduced by reducing waste,
finding cheaper suppliers or streamlining the
production process
Fixed costs
Remain the same irrespective of output
Could be
 Rent
 Rates
 Salaries
 Accountancy costs
 Most marketing costs
 Leasing equipment costs
Revenue
Revenue is the amount of capital (money) brought in

by the firm form sales of goods or services.
Revenue is calculated before any expenses are
deducted.
If a firm sold 10 T-shirts at £15 within a specific
timeframe (say a month) total revenue for that month
would be £150
Revenue alone is NOTHING to do with profit!!
What is Break – even analysis?
It is a technique widely used by production

management and management accountants.
 It is based on categorising production costs between
those which are variable (costs that change when the
production output changes)
 and those that are fixed (costs not directly related to
the volume of production).
Calculating the Break – even point
There are two ways to calculate the break-even point.

The two ways are as follows:

The contribution method
Producing a break–even chart
Contribution
Essentially the difference between revenue (sales) and

variable costs.
For example if a shirt sells at £25 (revenue) and it
costs £5 for the material and £3 for the ink for the
prints on the shirt the variable costs would be £?. £8
The contribution per unit would be £17
 £25

revenue

-

£8

=

£17

-

V.C.

=

contribution
Contribution Method

This involves a two part calculation:

Revenue (selling price) per unit – variable cost per unit =

contribution (towards fixed costs).
AND
Fixed costs / contribution = break-even point.
Example
If fixed costs = £2000, variable costs = £8 per unit, selling Price
per unit =£10. Then break-even would be:
Price per unit – variable cost per unit = contribution (towards
fixed costs).
£10 - £8 = £2 (contribution, towards fixed costs)
Fixed costs / contribution = break-even point.
£2000 / 2 = 1000
1000 products will need to be sold in order to break-even
and cover all their costs.
Task
Lisa has set up a business to print T-shirts. The fixed

costs of premises and the T-shirt printers are £3000.
The variable costs per T-shirt (the T-shirt, ink, wages)
are £5. Each printed T-shirt sells for £25.
NOW YOU TRY!
Task Answer
Lisa has set up a business to print T-shirts. The fixed costs of
premises and the T-shirt printers are £3000. The variable costs
per T-shirt (the T-shirt, ink, wages) are £5. Each printed Tshirt sells for £25.
Revenue per unit – Variable Cost Per Unit = Contribution
£25 - £5 = £20 (Contribution per unit)
Fixed Costs / Contribution per unit = Break-even Point.
£3000 / 20 = 150
Lisa must sell 150 T-shirts to brake even
Task 2
Rebecca starts a

business making and selling
handbags and has the following costs:
Fixed Costs
Variable Costs
Selling Price

£50,000 per year
£15 per handbag
£55 each

Calculate the break-even point?
Answer



Revenue – Variable Cost = Contribution
£55- £15 = £40 (Contribution)




Fixed Costs / Contribution = Break-even Point.
£50,000 / £40 = 1250

Rebecca has to sell 1250 handbags to brake even.
Break – even chart
A break-even chart can demonstrate the effects of

change in price of products / services
Units
produced

Fixed cost

Variable
cost

Total cost

1

15,000

20

15,020

50

15,000

1,000

16,000

100

15,000

2,000

17,000

150

15,000

3,000

18,000

200

15,000

4,000

19,000

250

15,000

5,000

20,000
Fixed Cost

T.R.
&
Costs

Production
Fixed Cost

T.R.
&
Costs

Production
Total Cost
Fixed Cost

T.R.
&
Costs

Production
Total Revenue
Total Cost
T.R.
&
Costs

Fixed Cost

Production
Total Revenue
Total Cost
T.R.
&
Costs

Fixed Cost
Break - even Point

Production
Total Revenue
Total Cost
T.R.
&
Costs

Fixed Cost
Break - even Point

Margin of
safety

Production
Area of profit
Margin of safety
The margin of safety represents the total current

output and total revenue.
It shows the current level of output at a point on the
total revenue line.
The difference between current output and the
break – even point is the margin of safety.
Businesses need to be aware of the margin of safety as
it shows the extent demand for their products and
services can drop before they start making a loss
Start of chart
Start by compiling a simple grid to calculate total

costs at certain quantities of production, plotting your
chart is made a lot easier.
Units
produced

Fixed cost

Variable
cost

Total cost

1

15,000

20

15,020

50

15,000

1,000

16,000

100

15,000

2,000

17,000

150

15,000

3,000

18,000

200

15,000

4,000

19,000

250

15,000

5,000

20,000
Task for graph paper
Mark is selling 16GB USB pen sticks on a market
stall. The pen sticks cost him £4.80, he sells them at
£9.00. His market stall rent is £100 on Saturday.
Using the graph paper provided make a break-even
chart to determine how many pen sticks Mark will
have to sell to break-even.
2. Mark has also been offered the same stall on Sunday
at a discounted rate for £60, Using the same chart
1.

calculate how many items he will need to sell to
break-even on Sunday
Questions???

Break even china

  • 1.
  • 2.
  • 3.
  • 4.
  • 5.
  • 6.
  • 7.
  • 8.
  • 9.
  • 10.
  • 11.
    Learning Objectives Introduction tobreak-even Define and calculate contribution Define and calculate contribution per unit Identify the relationship between contribution, profit and pricing Assess the relationship between break – even and contribution
  • 12.
    What is Break- even? It is the point at which a company is not making a loss or a profit. The business income equals its expenditures. It is a significant marker as it allows management to know the level of output required to sustain and succeed. It can be used to help determine pricing strategy, budgets, quality and output quantity. It is where Costs = Revenue within a business. Always measured in production units never cost
  • 13.
    Terms to befamiliar with Variable costs = changes depending on output. Fixed costs (fixed overheads) = remains the same no mater how much is produced Total cost = Fixed cost + variable costs Profit Loss
  • 14.
    Terms to befamiliar continued Output Contribution Revenue (Sales revenue) = when firms get money from selling their products / services Margin of Safety Break – even point
  • 15.
    Variable costs Variable costscorrelate to output This could be the price of ink, or fabric within a T- shirt factory. Variable costs can be reduced by reducing waste, finding cheaper suppliers or streamlining the production process
  • 16.
    Fixed costs Remain thesame irrespective of output Could be  Rent  Rates  Salaries  Accountancy costs  Most marketing costs  Leasing equipment costs
  • 17.
    Revenue Revenue is theamount of capital (money) brought in by the firm form sales of goods or services. Revenue is calculated before any expenses are deducted. If a firm sold 10 T-shirts at £15 within a specific timeframe (say a month) total revenue for that month would be £150 Revenue alone is NOTHING to do with profit!!
  • 18.
    What is Break– even analysis? It is a technique widely used by production management and management accountants.  It is based on categorising production costs between those which are variable (costs that change when the production output changes)  and those that are fixed (costs not directly related to the volume of production).
  • 19.
    Calculating the Break– even point There are two ways to calculate the break-even point. The two ways are as follows: The contribution method Producing a break–even chart
  • 20.
    Contribution Essentially the differencebetween revenue (sales) and variable costs. For example if a shirt sells at £25 (revenue) and it costs £5 for the material and £3 for the ink for the prints on the shirt the variable costs would be £?. £8 The contribution per unit would be £17  £25 revenue - £8 = £17 - V.C. = contribution
  • 21.
    Contribution Method This involvesa two part calculation: Revenue (selling price) per unit – variable cost per unit = contribution (towards fixed costs). AND Fixed costs / contribution = break-even point.
  • 22.
    Example If fixed costs= £2000, variable costs = £8 per unit, selling Price per unit =£10. Then break-even would be: Price per unit – variable cost per unit = contribution (towards fixed costs). £10 - £8 = £2 (contribution, towards fixed costs) Fixed costs / contribution = break-even point. £2000 / 2 = 1000 1000 products will need to be sold in order to break-even and cover all their costs.
  • 23.
    Task Lisa has setup a business to print T-shirts. The fixed costs of premises and the T-shirt printers are £3000. The variable costs per T-shirt (the T-shirt, ink, wages) are £5. Each printed T-shirt sells for £25. NOW YOU TRY!
  • 24.
    Task Answer Lisa hasset up a business to print T-shirts. The fixed costs of premises and the T-shirt printers are £3000. The variable costs per T-shirt (the T-shirt, ink, wages) are £5. Each printed Tshirt sells for £25. Revenue per unit – Variable Cost Per Unit = Contribution £25 - £5 = £20 (Contribution per unit) Fixed Costs / Contribution per unit = Break-even Point. £3000 / 20 = 150 Lisa must sell 150 T-shirts to brake even
  • 25.
    Task 2 Rebecca startsa business making and selling handbags and has the following costs: Fixed Costs Variable Costs Selling Price £50,000 per year £15 per handbag £55 each Calculate the break-even point?
  • 26.
    Answer   Revenue – VariableCost = Contribution £55- £15 = £40 (Contribution)   Fixed Costs / Contribution = Break-even Point. £50,000 / £40 = 1250 Rebecca has to sell 1250 handbags to brake even.
  • 27.
    Break – evenchart A break-even chart can demonstrate the effects of change in price of products / services Units produced Fixed cost Variable cost Total cost 1 15,000 20 15,020 50 15,000 1,000 16,000 100 15,000 2,000 17,000 150 15,000 3,000 18,000 200 15,000 4,000 19,000 250 15,000 5,000 20,000
  • 28.
  • 29.
  • 30.
  • 31.
  • 32.
    Total Revenue Total Cost T.R. & Costs FixedCost Break - even Point Production
  • 33.
    Total Revenue Total Cost T.R. & Costs FixedCost Break - even Point Margin of safety Production
  • 34.
  • 35.
    Margin of safety Themargin of safety represents the total current output and total revenue. It shows the current level of output at a point on the total revenue line. The difference between current output and the break – even point is the margin of safety. Businesses need to be aware of the margin of safety as it shows the extent demand for their products and services can drop before they start making a loss
  • 36.
    Start of chart Startby compiling a simple grid to calculate total costs at certain quantities of production, plotting your chart is made a lot easier. Units produced Fixed cost Variable cost Total cost 1 15,000 20 15,020 50 15,000 1,000 16,000 100 15,000 2,000 17,000 150 15,000 3,000 18,000 200 15,000 4,000 19,000 250 15,000 5,000 20,000
  • 37.
    Task for graphpaper Mark is selling 16GB USB pen sticks on a market stall. The pen sticks cost him £4.80, he sells them at £9.00. His market stall rent is £100 on Saturday. Using the graph paper provided make a break-even chart to determine how many pen sticks Mark will have to sell to break-even. 2. Mark has also been offered the same stall on Sunday at a discounted rate for £60, Using the same chart 1. calculate how many items he will need to sell to break-even on Sunday
  • 38.