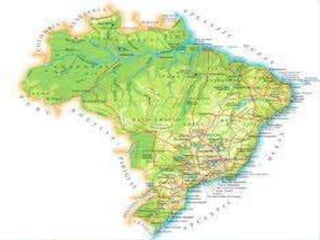
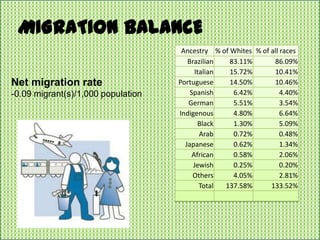
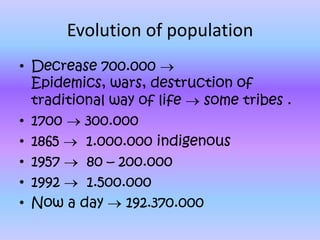
BRAZIL

Alba, Nerea,
Laura, Lidia and
Alicia
POPULATION
  LAST YEARS       POPULATION
                   DECREASE
BECAUSE OF THE INDUSTRIALIZATION OR
URBANIZATION
BIRTH RATE
-16.04 births/1,000 population


MORTALITY RATE

-6.22 deaths/1,000 population
INFANT MORTALITY
MIGRATION BALANCE
                                     Ancestry % of Whites % of all races
                                       Brazilian   83.11%       86.09%
                                          Italian  15.72%       10.41%
Net migration rate                  Portuguese     14.50%       10.46%
-0.09 migrant(s)/1,000 population       Spanish     6.42%          4.40%
                                       German       5.51%          3.54%
                                    Indigenous      4.80%          6.64%
                                           Black    1.30%          5.09%
                                            Arab    0.72%          0.48%
                                      Japanese      0.62%          1.34%
                                         African    0.58%          2.06%
                                         Jewish     0.25%          0.20%
                                         Others     4.05%          2.81%
                                            Total 137.58%      133.52%
Evolution of population
• Decrease 700.000
  Epidemics, wars, destruction of
  traditional way of life   some tribes .
• 1700    300.000
• 1865    1.000.000 indigenous
• 1957    80 – 200.000
• 1992    1.500.000
• Now a day     192.370.000
Brazilian States by Population density
Brazilian States by Population
education   INMIGRATION
   a very important
Immigration has been
  demographic
    culture economy
  factor

Brazil

  • 1.
  • 3.
    POPULATION LASTYEARS POPULATION DECREASE BECAUSE OF THE INDUSTRIALIZATION OR URBANIZATION
  • 4.
    BIRTH RATE -16.04 births/1,000population MORTALITY RATE -6.22 deaths/1,000 population
  • 5.
  • 6.
    MIGRATION BALANCE Ancestry % of Whites % of all races Brazilian 83.11% 86.09% Italian 15.72% 10.41% Net migration rate Portuguese 14.50% 10.46% -0.09 migrant(s)/1,000 population Spanish 6.42% 4.40% German 5.51% 3.54% Indigenous 4.80% 6.64% Black 1.30% 5.09% Arab 0.72% 0.48% Japanese 0.62% 1.34% African 0.58% 2.06% Jewish 0.25% 0.20% Others 4.05% 2.81% Total 137.58% 133.52%
  • 7.
    Evolution of population •Decrease 700.000 Epidemics, wars, destruction of traditional way of life some tribes . • 1700 300.000 • 1865 1.000.000 indigenous • 1957 80 – 200.000 • 1992 1.500.000 • Now a day 192.370.000
  • 8.
    Brazilian States byPopulation density
  • 9.
  • 10.
    education INMIGRATION a very important Immigration has been demographic culture economy factor