Download to read offline

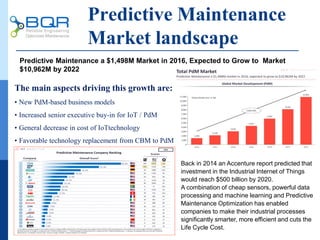

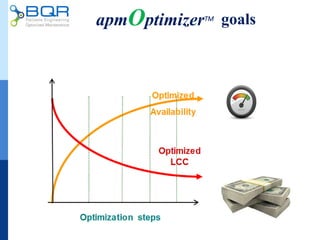
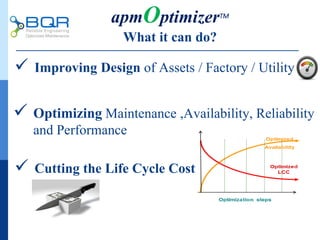
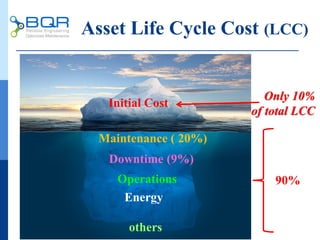
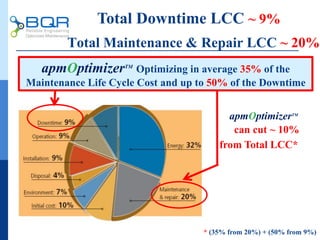
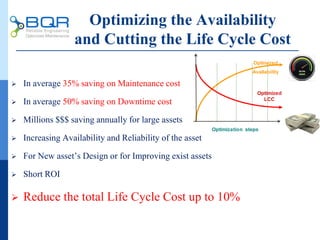
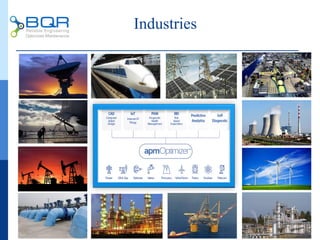
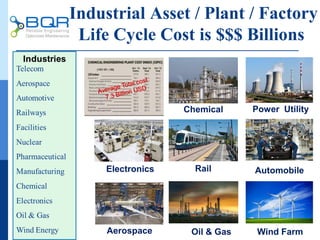
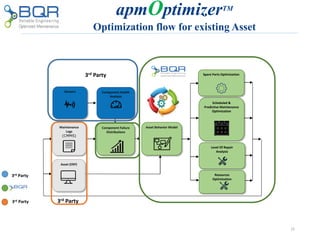
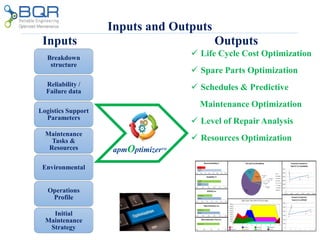
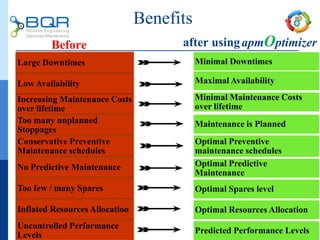
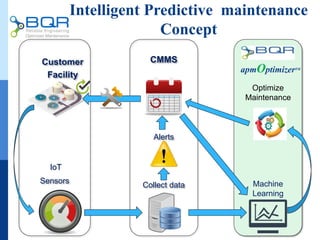
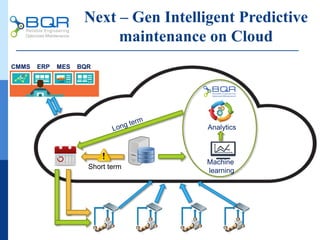
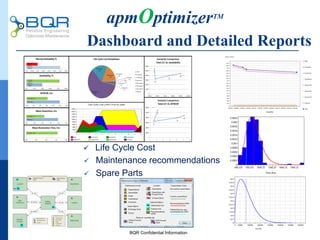


The document discusses the growth and benefits of predictive maintenance solutions, highlighting a market expectation of over $10 billion by 2022. It emphasizes the cost-saving potential of optimizing maintenance and reducing downtime, which can cut overall life cycle costs by up to 10%. APMOptimizerTM is presented as a tool for enhancing reliability and efficiency in industrial operations through data analysis and predictive maintenance strategies.


![[DSC Europe 25] Andrzej Kowalczyk - AI - how to start small and grow in the f...](https://cdn.slidesharecdn.com/ss_thumbnails/oy1zmo94qv6vpcqjvno2-andrzej-kowalczyk-ai-how-to-start-small-and-grow-in-the-future-1-260119121559-cf093b23-thumbnail.jpg?width=640&height=640&fit=bounds)

![[DSC Europe 25] Harshvardhan Jain - From Pre-Trained to Purpose-Built: Fine-T...](https://cdn.slidesharecdn.com/ss_thumbnails/zru4zmiseku5tgvu2dgw-harshvardhan-jain-from-pre-trained-to-purpose-built-fine-tuning-llms-for-high-i-260119101520-8335585f-thumbnail.jpg?width=640&height=640&fit=bounds)


![[DSC Europe 25] Milovan Jovicic - Beyond AI's Reach: The Enduring Value of Ev...](https://cdn.slidesharecdn.com/ss_thumbnails/pyeij0hurgwq5jugmtnv-2-milovan-jovicic-beyond-ais-reach-the-enduring-value-of-evergreen-design-v2-260120105856-d6ee57e5-thumbnail.jpg?width=640&height=640&fit=bounds)
![[DSC Europe 25] Bojan Djuricic - Predictive Design Process.pdf](https://cdn.slidesharecdn.com/ss_thumbnails/5awdrbedqdek3gqu2ezy-4-the-predictive-design-bojan-djuricic-260120105856-6c399e9b-thumbnail.jpg?width=640&height=640&fit=bounds)


![[DSC Europe 25] Josip Saban - Career building for data professionals.pptx](https://cdn.slidesharecdn.com/ss_thumbnails/zroflcttkm1vmli0txea-josip-saban-career-building-for-data-professionals-260123083019-587cdb8c-thumbnail.jpg?width=640&height=640&fit=bounds)
![[DSC Europe 25] Bojan Banjac - AI is always right when it comes to the matter...](https://cdn.slidesharecdn.com/ss_thumbnails/syoxtqierpydwxm5srcb-4-bojan-banjac-ai-is-always-right-when-it-comes-to-the-matters-of-taste-260119101519-694ee7d7-thumbnail.jpg?width=640&height=640&fit=bounds)

