Borg, e e kaijser 2006 comparação de 3 escalas de percepçã
1. Scand J Med Sci Sports 2006: 16: 57–69 COPYRIGHT & BLACKWELL MUNKSGAARD 2005
Printed in Singapore . All rights reserved
DOI: 10.1111/j.1600-0838.2005.00448.x
A comparison between three rating scales for perceived exertion
and two different work tests
E. Borg1, L. Kaijser2
1
Department of Psychology, Stockholm University, Stockholm, Sweden, 2Karolinska Institute, Huddinge, Sweden
Corresponding author: Elisabet Borg, Department of Psychology, Stockholm University, SE-106 91, Stockholm, Sweden.
Tel: 146 8 163850, Fax: 146 8 159342, E-mail: eb@psychology.su.se
Accepted for publication 29 December 2004
In the present article, three scales developed by Borg are tonously increasing functions that could be described by
compared on bicycle ergometer work. In the first study, power functions with a mean exponent of about 2.6
comparing the Borg Ratings of Perceived Exertion (RPE) (SD % 0.6) (with two additional constants included in the
and Category scales with Ratio properties (CR10) scales, 40 power functions). In the second study, where also the more
healthy subjects (12 men and eight women for each scale) recently developed Borg CR100 scale (centiMax) was
with a mean age of about 30 years (SD % 6) participated. A included, 24 healthy subjects (12 men and 12 women) with
work-test protocol with step-wise increase of work loads a mean age of about 29 years (SD % 3) participated in a
every minute was used (20 W increase for men and 15 W for work test with a step-wise increase of work loads (25 W)
women). Ratings and heart rates (HRs) were recorded every every third minute. Ratings and HRs were recorded. RPE
minute and blood lactates every third minute. Data obtained values were described by linear regressions with individual
with the RPE scale were described with linear regressions, correlations of about 0.97. Data from the two CR scales
with individual correlations of about 0.98. Data obtained were described by power functions with mean exponents of
with the CR10 scale could also be described by linear about 1.4 (SD % 0.5) (with a-values in the power functions).
regressions, but when described by power functions gave Mean individual correlations were about 0.98. In both
exponents of about 1.2 (SD % 0.4) (with one additional studies, a tendency for a deviation from linearity between
constant included in the power function). This was signifi- RPE values and HRs was observed. The obtained deviations
cantly lower than the exponent of between 1.5 and 1.9 that from what has previously been obtained for work of longer
has previously been observed. Mean individual correlations duration (4–6 min) points to a need for standardization of
were 0.98. Blood lactate concentration grew with mono- work-test protocols and to the advantage of using CR scales.
Hundreds of studies every year show the value of for both perceptual and physiological variables, was
using variables based on the psychological concept of proposed by Borg (1961, 1962):
perceived exertion (Borg, 1962) as a complement to
R ¼ a þ cðS À bÞn ½1Š
physiological variables in a wide range of areas in
medicine, ergonomics and sports (see, e.g., Mihevic, where c is a measure constant, n is the exponent, and
1981; Noble, 1982; Pandolf, 1983; Carton & Rhodes, the constants a and b can describe the absolute
1985; Noble & Robertson, 1996; Russel, 1997; Borg, threshold or the starting point of the function.
1998; Buckworth & Dishman, 2002). Statistically, these can easily be obtained by fitting
The psychophysical problem of relating physical a linear regression model to logarithms of raw data
stimulus (S) and its perceived magnitude (R) to (because log(R–a) 5 log c1n log(S–b)).
each other puts high demands on valid methods Borg’s (1961, 1962, 1998) range model with the
and control of, for example, influences of instruction, assumption that the subjective range from a minimal
experimental design, rating behavior, context effects, to a maximal intensity (or at least the perception at
etc. (see, e.g., Marks, 1994; Gescheider, 1997). Ac- maximum) may be set approximately equal for all
cording to the theories developed by Stevens (1975) persons, provided the theory needed for the devel-
direct responses on a ratio scale can be obtained by opment of a series of verbally level-anchored scales
using techniques such as magnitude estimation, thus giving responses on an interval or ratio data level.
allowing for use of metric statistics and enabling The most well known are the 6–20 RPE scale, for
descriptions of S–R functions. Resulting psychophy- Ratings of Perceived Exertion (Borg, 1970, 1985,
sical relationships can be described mathematically 1998) and the 0–10 CR10 scale, a Category scale
by power functions. A general formulation, suitable with Ratio properties (Borg, 1982a, 1998). Recently
57
2. Borg & Kaijser
this scale has also had a follower, the CR100 (or psychological factors (Morgan, 1973, 1994; Weiser &
‘‘centiMax’’ scale, giving ‘‘cM’’ values) (Borg & Stamper, 1977).
Borg, 1994, 2001, 2002), see Fig. 1. There are several important physiological corre-
The RPE scale was constructed to give data that lates for perceived exertion, two of these being HR
grow linearly with stimulus intensity, heart rates and blood lactate concentration ([La À ]). The ap-
(HRs) and oxygen consumption for aerobic work proximately linear increase of HR with power closely
of steady-state character on a bicycle ergometer follows the oxygen demands in the muscles, and can
(4–6 min). The linear growth function of RPE data be regarded as a good correlate for ‘‘central’’ factors.
during an incremental work test has been confirmed in Lactate is produced in the muscles as a natural part
´
several studies (see, e.g., Hassmen, 1991; Noble & of carbohydrate metabolism and has been suggested
Robertson, 1996; Borg, 1998). Data obtained with the to play a major role (even if not directly causal) in
scale can thus preferably be described with linear muscle fatigue and pain experienced during exercise
regression models according to the following equation: (for a review, see, e.g., Miles & Clarkson, 1994).
Lactate may thus be regarded as a good correlate for
R ¼ a þ cS ½2Š
some more ‘‘local’’ factors. The accumulation of
On the CR10 scale, as well as on the more fine graded lactate in the blood has long been said to show that
CR100 (centiMax) scale, verbal anchors and num- anaerobic processes supplement aerobic production
bers are placed congruently to render ratio data that of adenosine triphosphate in the muscles. However,
mimic what is obtained by magnitude estimation. some lactate seems to be produced in the muscles
The psychophysical growth function for overall per- also during fully aerobic conditions and, even at rest,
ceived exertion on a bicycle ergometer has been [La À ] can be expected to be around 1 mM. A more
determined by Borg (eqn. [1] with b 5 0) and the likely reason for blood lactate accumulation may
exponent found to be between 1.5 and 1.7 (see, e.g., therefore be that the production rate in the muscles is
Borg, 1962, 1998). higher than the removal rate (see, e.g., Brooks, 1985;
Already in his thesis Borg (1962) states that the ˚
Davis, 1985; Astrand & Rodahl, 1986, for a discus-
concept of overall perceived exertion can be regarded sion of possible physiological reasons for lactate
as a ‘‘Gestalt’’ made up of perceptions from several production).
important cues. These may be physiologically ‘‘local’’ It has long been known that blood lactate starts to
factors, such as the skin, muscles, joints, and ‘‘cen- increase above a certain exercise level and then keeps
tral’’ factors, such as cardiovascular and pulmonary increasing as the exercise intensity is increased (Dou-
organs (cp. Ekblom & Goldbarg, 1971), and also glas, 1927; Bang, 1936). The relationship with power
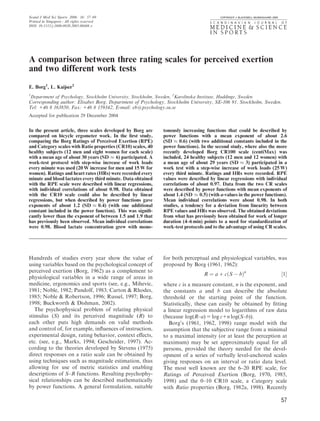
6 No exertion at all 0 Nothing at all Absolute maximum
"No I"
7 0.3
Extremely light 0.5 Extremely weak Just noticeable
8 "Maximal" Max I
0.7
9 Very light 1 Very weak Light Extremely strong
10 1.5
Very strong
2 Weak
11 Light
2.5
12 3 Moderate Strong Heavy
4
13 Somewhat hard
5 Strong Heavy
14 6 Moderate
15 Hard (heavy) 7 Very strong
8 Weak Light
16
9
17 Very hard Very weak
10 Extremely strong "Strongest I"
18 11 Extremely weak
Just noticeable
"Minimum"
19 Extremely hard
• Absolute maximum Highest possible Nothing at all
20 Maximal exertion
Fig. 1. Left: Borg RPE (Rating of Perceived Exertion) scale (Borg, 1970, 1998, r G Borg); middle: Borg CR10 (Category
Ratio) scale (Borg, 1982a, 1998, r G Borg); and right: Borg centiMax (CR100) scale (Borg & Borg, 2002, r G Borg & E
Borg).
58
3. Three perceived exertion scales and two work tests
output has been described in several ways (see, e.g., function for work tests with a shorter duration in
Beaver et al., 1985; Keul et al., 1979; Hughson et al., the step-wise increase of physical power (1 and
1987). Borg (1962) has, however, suggested that the 3 min). A comparison will also be made between
best description – according to the law of parsimony the Borg CR10 and Borg CR100 scales for the 3-
– must be to use one monotonically increasing power min work test. Of interest are the psychophysical
function with at least one additional constant (eqn. functions obtained. The benefit of each scale will
[1]). A power function also has advantages for the also be evaluated in comparison with physiological
sake of comparison. Blood lactate exponents, ob- variables.
tained by Borg (1962), Borg et al. (1985, 1987b,
1989), Noble et al. (1983), have varied between 2.2
and 3.5 for bicycle ergometer work. Method
Clinically, an international agreement is lacking Study 1
about what kind of work-test protocol should be
used. The Sjostrand (1947) and Wahlund (1948)
¨ Forty subjects, 24 men and 16 women, participated
exercise test with 6 min at each load has been replaced in a work test to a voluntary maximum on a bicycle
by protocols with shorter durations, e.g., in USA ergometer. All subjects were given a written and a
3 min (e.g., Noble & Robertson, 1996), in Germany verbal information and signed an informed consent
2 min (e.g., Lollgen, 2000), and in Sweden the popular
¨ to participate. The study had been approved by the
use of an increase of work load every minute (see, Karolinska Institute Ethics Committee.
˚
e.g., Astrom & Jonsson, 1976; Nordenfelt et al., 1985;
¨ Subjects were divided into two groups of 12 men
Wallin & Brudin, 1988; Jorfeldt et al., 2003). and eight women in each group depending upon
The kind of bicycle protocol mostly used in devel- which psychophysical method they were to use.
oping the RPE scale has been work with a step-wise Individual data for the four groups of subjects are
increase of exercise levels every third to sixth minute. presented in Table 1. A commonly used measure-
For determination of the general psychophysical ment of individual working capacity, the power level
growth function for perceived exertion with traditional at an HR of 170 b.p.m. (W170), is also included
ratio scaling methods, work of shorter durations (obtained from individual HR–S functions, cp. Sjos-¨
(perceived ‘‘pedal resistance’’ at 30–60 s of intermittent trand, 1947; Wahlund, 1948).
work on randomized S levels) has sometimes been Subjects worked at an electrically braked bicycle
used. This has been the case with the CR10 scale (see, ergometer (Rodby, Sodertalje, Sweden) and were
¨ ¨
e.g., Borg, 1962, 1970, 1982a, 1998). In the develop- instructed to keep a pedaling rate of 60 r.p.m. The
ment of the CR100 scale such randomized intermittent male subjects started at 20 W and work loads were
work as well as incremental work of 3 min exercise at then increased by 20 W every minute, the female
each power level has been used, giving exponents subjects started at 15 W with a 15 W increase every
between 1.6 and 1.9 (Borg & Borg, 1994, 2002). minute. Subjects were instructed to continue pedal-
ing as long as they possibly could. During the last
Purpose 10 s of each work load, they were asked to give a
rating of their perceived overall exertion. The psy-
The aim of this article is a comparison between the chophysical methods used were the Borg RPE scale
now commonly used rating scales for perception of and the Borg CR10 scale presented in Fig. 1 (see also
exertion, viz., the Borg RPE scale and the Borg CR10 Table 1). An instruction was read to the subjects at
scale. It is of interest to study how these scales the beginning of the experiment and the scales were
Table 1. Mean values (m) and standard deviations (s) for age, height, weight, and estimated working capacity (W170) for the subjects in Study 1 and
Study 2
Group (N) Age (years) Height (cm) Weight (kg) W170 (W)
m s m s m s m s
Study 1
Men, RPE (12) 30.1 4.7 180.2 7.3 79.7 11.9 269.4 31.0
Men, CR10 (12) 32.1 5.8 182.2 6.2 80.4 8.9 275.4 44.7
Women, RPE (8) 29.4 5.9 167.8 9.6 70.5 12.4 181.1 43.1
Women, CR10 (8) 30.8 6.2 169.1 9.5 64.0 7.8 174.3 35.3
Study 2
Men (12) 29.2 3.2 180.5 6.4 72.5 5.6 200.3 48.8
Women (12) 28.8 2.7 168.2 5.3 58.4 5.6 147.0 28.3
RPE, Ratings of Perceived Exertion; CR, Category Ratio.
59
4. Borg & Kaijser
visible to the subjects throughout the whole work their perceived overall exertion. The test was inter-
test. HRs were first measured when the subjects were rupted when subjects gave ratings above 7 on the
sitting on the bicycle ergometer without pedaling, CR10 scale or above 17 on the RPE scale, or if the
and then continuously throughout the work test by subject obtained an HR of above 170 b.p.m. (cor-
electrocardiometry. [La À ]’s were obtained at rest responding roughly to about the same degree of
(sitting on the ergometer) and for men at 20 W and exertion). HRs were measured at the end of each
at 60 W, and for women at 30 W, and then at every work load by an HR micro-computer (Polar Favor,
third stimulus level, as well as at the terminal level. Kempele, Finland).
[La À ]’s were obtained through an Accusport Lactate
Instrument (Boehringer, Mannheim, Germany).
If a subject stopped working without finishing the Results
full minute at the terminal level, the time spent was General results
noted and an interpolation of the corresponding S-
value was calculated. One extrapolation was done in Study 2 for one
subject with the CR10 scale by using the individual
power function for the ratings and the individual
Study 2 linear regression relationship for HR. This was done
Twenty-four subjects, 12 men and 12 women, parti- in order to obtain an equal number of data points
cipated in a sub-maximal work test on a bicycle with all three scales for this subject.
ergometer. All subjects were given written and verbal Individual results with ratings and physiological
information and signed an informed consent to responses plotted as a function of stimulus intensity
participate. The study had been approved by the are shown in Fig. 2 (Study 1) and Fig. 3 (Study 2).
Karolinska Institute Ethics Committee. In psychophysical studies, aggregated data are
Subjects were divided into two groups (A and B) traditionally used when the purpose is to describe
with six men and six women in each group. Indivi- general S–R functions. Because of large individual
dual data for the subjects are presented in Table 1, differences in working capacity there is, however, a
together with W170. In Study 2, HRs were measured large individual difference in stimulus ranges and
on two occasions, giving two W170-values for each number of data points. Because the functions are
individual. Because these were very highly inter- monotonic, usually only stimulus levels in common
correlated (rxy 5 0.945) and only differed by one- to all subjects are utilized. In this article, it was
half heart beat (NS, t23 5 0.14, P 5 0.89), the value instead decided to use mean values of individual
in Table 1 is the average W170 from the two repeti- functions to estimate the parameters of the general
tions. S–R functions. The same was done for the physiolo-
The psychophysical methods used were the Borg gical variables.
RPE scale, and the Borg CR10 and CR100 scales
presented in Fig. 1. Instructions on how to adminis-
ter the scales were read to the subjects at the begin- Perceptual variables
ning of the experiment. Group A used the RPE and For the RPE scale, linear regression of raw values
CR100 scales on the first session. The RPE scale was (eqn. [2]) for each individual was used to describe the
visible to the subject during the entire experiment. S–R functions. For the CR scales, linear regression
The CR100 scale was shown to the subject in a way of log values, power functions (eqn. [1], with b 5 0)
such that both scales could not be viewed simulta- for each individual were used. Mean values and
neously, and always after ratings had been made on standard deviations for obtained constants as well
the RPE scale. Group B used the CR10 scale at the as for the best-fit correlation are presented in Tables
first session. The scale was visible to the subject 2 and 3.
during the entire work test. At a second session, The mean intercept (a) with the RPE scale in Study
scales were shifted (Group A used the CR10 scale 1 was 7.6 for men and 7.0 for women, and the mean
and Group B the RPE and CR100 scales). All slope (c) was 0.039 for men and 0.066 for women.
subjects came back for the second session about The mean best-fit correlation was about rxy 5 0.98
2–3 weeks after the first occasion to repeat the (0.935–0.994). For Study 2, the mean intercept (a)
work test with the other method. Subjects worked was 8.3 for men and 8.2 for women and the mean
at an electrically braked bicycle ergometer (Rodby) slope (c) was 0.049 for men and 0.066 for women.
and were instructed to keep a pedaling rate of The mean best-fit correlation was rxy 5 0.97 (0.906–
60 r.p.m. For the male as well as female subjects 0.995). An unpaired t-test showed that the difference
work loads were increased by 25 W every third in slope between men and women was significant
minute (starting at 25 W). During the last 10 s of for Study 1 (t18 5 À 5.0, Po0.0001) and Study 2
each work load, they were asked to give a rating of (t22 5 À 3.1, Po0.01).
60
5. Three perceived exertion scales and two work tests
Study 1
Women Men Women Men
12
20
10 18
8
R (CR10)
16
R (RPE)
6 14
12
4
10
2 8
0 6
200 200
HR (bpm)
HR (bpm)
150 150
100 100
50 50
12 12
10 10
8 8
[La− ]
[La− ]
6 6
4 4
2 2
0 0
0 100 200 300 400 0 100 200 300 400 0 100 200 300 400 0 100 200 300 400
S (W) S (W) S (W) S (W)
Fig. 2. Study 1: left six panels, the Ratings of Perceived Exertion (RPE) group, with RPE values (top), heart rate (HR) values
(middle), and [La À ] values (bottom), for women (N 5 8) and men (N 5 12). Right six panels, the Category Ratio (CR)10
group, with CR10 values (top), HR values (middle), and [La À ] values (bottom), for women (N 5 8) and men (N 5 12).
When no a-values were used in the power law, the (s 5 0.35) without an a-value, and n 5 1.12 (s 5 0.21)
mean exponent obtained with the CR10 scale in with an a-value in the power equation. For the male
Study 1 was n 5 1.21 (men) and n 5 0.81 (women). group, the mean exponent was n 5 1.06 (s 5 0.37)
An unpaired t-test showed that the difference in without an a-value, and n 5 1.17 (s 5 0.23) with an a-
exponents between men and women was not signifi- value in the power equation.
cant (t18 5 1.7, P 5 0.11). For the CR10 scale, an a- In Study 2, the mean exponent obtained without
value in the power law gave a higher best-fit correla- an a-value in the power law was, with the CR10 scale:
tion for 12 subjects. A mean a-value of about 0.6 (6% n 5 0.92 (men) and n 5 1.06 (women); and with the
of the total subjective range) was obtained for the CR100 scale: n 5 1.02 (men) and n 5 1.10 (women).
total group (no limits were imposed on the a-values). For the CR10 scale, an a-value in the power law gave
With an a-value included, the mean exponent ob- a higher best-fit correlation for 20 subjects. A mean
tained was n 5 1.20 for the total group, n 5 1.30 for a-value of about 0.7 (7% of the total subjective
men and n 5 1.05 for women. The difference in range) was obtained for the total group. With an a-
exponents between men and women was not signifi- value included, the mean exponent was n 5 1.36 for
cant (t18 5 1.3, P 5 0.20). The total mean exponent of men and n 5 1.49 for women. The mean best-fit
n 5 1.20 was significantly lower than a predicted correlation was about rxy 5 0.99 (0.982–0.999). For
exponent of at least 1.5 (P 0.001). The mean the CR100 scale, an a-value in the power law gave a
best-fit correlation was about rxy 5 0.98 (0.938– higher best-fit correlation for 12 subjects. A mean a-
0.998). It was found that one man (subject 39) with value of about 3 (3% of the total range) was obtained
an exponent of n42.8 (no need for an a-value) highly for the total group. The mean exponent was then, for
contributed to the higher exponent for men. When he men n 5 1.23 and for women n 5 1.47. The mean
was excluded, the total mean exponent was n 5 0.95 best-fit correlation was about rxy 5 0.98 (0.917–
61
6. Borg & Kaijser
Women Study 2 Men
20 20
18 18
16 16
R (RPE)
R (RPE)
14 14
12 12
10 10
8 8
6 6
120 12 120 12
100 10 100 10
R (CR100)
R (CR100)
R (CR10)
R (CR10)
80 8 80 8
60 6 60 6
40 4 40 4
20 2 20 2
0 0 0 0
200 200
HR (bpm)
HR (bpm)
150 150
100 100
50 50
0 50 100 150 200 250 0 50 100 150 200 250 0 50 100 150 200 250 0 50 100 150 200 250
S (W) S (W) S (W) S (W)
Fig. 3. Study 2: left five panels, women (N 5 12) with Ratings of Perceived Exertion (RPE) values (top), Category Ratio (CR)
values (middle), and heart rate (HR) values (bottom). Right five panels, men (N 5 12) with RPE values (top), CR values
(middle), and HR values (bottom).
Table 2. Mean values (m) and standard deviations (s) of the constants differences in exponents for men and women
from eqn. [2] relating R to S for the RPE scale, based on individual ( À 0.6 t22 À 1.4). The obtained mean exponent
functions for the subjects of Study 1 and Study 2 for the total groups was not significantly lower than a
Group (N) a c rxy predicted exponent of at least 1.5 (P40.5).
An independent samples t-test was computed for
m s m s m s the differences in exponents with the CR10 scale
between Study 1 and Study 2. The mean difference
Study 1
Total (20) 7.4 1.7 0.050 0.018 0.980 0.013
obtained, À 0.15, was not significant (t42 5 À 1.14,
Men (12) 7.6 1.8 0.039 0.009 0.982 0.009 P 5 0.26), unless the one subject in Study 1 with an
Women (8) 7.0 1.7 0.066 0.016 0.976 0.018 exponent exceeding n 5 2.8 was excluded, then the
Study 2 mean difference, À 0.24, was significant (t41 5 À 2.14,
Total (24) 8.2 1.7 0.058 0.015 0.970 0.023 P 0.05).
Men (12) 8.3 1.5 0.049 0.007 0.971 0.018 For Study 1, split-half functions were calculated
Women (12) 8.2 1.8 0.066 0.017 0.969 0.027
to estimate the reliability of individual S–R func-
RPE, Ratings of Perceived Exertion. tions. Reliability coefficients, rxx, were calculated
as well as estimations of measurement errors, se
p
(rxx ¼ð2rxx1=2 Þ=ð1 þ 2rxx1=2 Þ; se ¼ sx ð1 À rxx Þ). For
0.999). No limits were imposed on the a-values. A the RPE scale intercept (a) rxx 5 0.97 (se 5 0.29) and
paired t-test showed that the difference observed for the slope (c) rxx 5 0.98 (se 5 0.0023). For the
between exponents obtained with the CR10 and the CR10 scale measure constant (c) rxx 5 0.91
CR100 scales was not significant (without an a-value: (se 5 0.012) and for the exponent (n) rxx 5 0.95
mean difference 5 À 0.072, t23 5 À 1.0, P 5 0.33; (se 5 0.097) (with individual a-values used). Measure-
with an a-value: mean difference 5 0.074, t23 5 0.7, ment errors for RPE mean slope and mean intercept
P 5 0.47). Unpaired t-tests showed no significant were approximately 4% and approximately 8% for
62
7. Three perceived exertion scales and two work tests
Table 3. Mean values (m) and standard deviations (s) of the constants in Table 4. Mean values (m) and standard deviations (s) of the constants
eqn. [1] (for the measure constant also the geometric mean (gm)) from eqn. [2] relating HR to S, based on individual functions for the
relating R to S for the CR scales, based on individual functions for the subjects in Study 1 and Study 2
subjects of Study 1 and Study 2
Group (N) a c rxy
Group (N) a c n rxy
m s m s m s
m s m s gm m s m s
Study 1
Study 1, CR10 Total, RPE (20) 76.6 9.6 0.42 0.10 0.993 0.004
Total (20) – – 0.119 0.156 0.025 1.05 0.54 0.969 0.026 Total, CR10 (20) 71.8 11.8 0.45 0.12 0.992 0.005
0.6 0.7 0.032 0.041 0.010 1.20 0.44 0.982 0.014 Men, RPE (12) 74.2 8.8 0.36 0.05 0.994 0.003
Men (12) – – 0.060 0.072 0.009 1.21 0.62 0.973 0.017 Men, CR10 (12) 69.3 13.4 0.37 0.07 0.991 0.006
0.4 0.6 0.022 0.038 0.005 1.30 0.53 0.982 0.017 Women, RPE (8) 80.1 10.1 0.51 0.08 0.990 0.004
Women (8) – – 0.207 0.208 0.126 0.81 0.27 0.965 0.036 Women, CR10 (8) 75.7 8.4 0.56 0.10 0.993 0.003
0.8 0.9 0.047 0.043 0.030 1.05 0.17 0.982 0.011
Study 2
Study 2, CR10 Total, RPE (24) 73.5 9.9 0.59 0.13 0.991 0.007
Total (24) – – 0.103 0.118 0.042 0.99 0.32 0.984 0.014 Total, CR10 (24) 77.0 9.8 0.57 0.13 0.991 0.008
0.7 0.6 0.032 0.069 0.004 1.43 0.51 0.994 0.004 Men, RPE (12) 70.2 8.3 0.52 0.12 0.988 0.009
Men (12) – – 0.117 0.135 0.034 0.92 0.30 0.984 0.016 Men, CR10 (12) 76.6 11.3 0.48 0.10 0.987 0.010
0.6 0.7 0.035 0.088 0.004 1.36 0.44 0.995 0.005 Women, RPE (12) 76.9 10.6 0.65 0.12 0.994 0.002
Women (12) – – 0.089 0.104 0.051 1.06 0.34 0.984 0.014 Women, CR10 (12) 77.4 8.5 0.65 0.11 0.995 0.002
0.7 0.7 0.028 0.045 0.005 1.49 0.59 0.994 0.004
Study 2, CR100 HR, heart rate; RPE, Ratings of Perceived Exertion; CR, Category Ratio.
Total (24) – – 0.48 0.56 0.242 1.06 0.28 0.974 0.023
3.1 4.3 0.24 0.37 0.055 1.35 0.44 0.982 0.018 0.48 (men, CR10) and 0.65 (women, CR10). The
Men (12) – – 0.43 0.45 0.239 1.02 0.23 0.977 0.021
1.5 5.3 0.36 0.48 0.036 1.23 0.45 0.983 0.010 mean best-fit correlation was about rxy 5 0.99
Women (12) – – 0.53 0.67 0.245 1.10 0.32 0.970 0.026 (0.964–0.999). Unpaired t-tests showed that the dif-
4.8 2.3 0.12 0.15 0.083 1.47 0.41 0.981 0.024 ferences in slope between men and women were
significant for Study 1 (t18 À 4.9, P 0.0001,
CR, Category Ratio.
both groups) as well as Study 2 (2.7 t22 3.8,
P 0.05).
CR10 mean exponents. When the subject with an In estimation experiments, an error in the expo-
exponent exceeding n 5 2.8 was excluded, measure- nent may be expected because of regression effects
ment errors for the CR10 mean exponents were that will lower the exponent somewhat as compared
approximately 5%. The measure constant in the with a ‘‘true’’ exponent. The effect of this error can
power function is very positively skewed for why be estimated as was done by Bauman et al. (2004), as
measurement error of log c may be more appropriate. n 0 5 n  rxy. This was done for the exponents ob-
For log c, rxx 5 0.96 (se 5 0.25) and the measurement tained with the CR10 and CR100 scales. The relative
error, approximately 7% of the mean. For Study 2, mean size of this error (computed as ((n À n 0 )/n) was,
there were too few data points to enable this compu- for the CR10 scale, 1.8% (Study 1) and 0.6% (Study
tation. 2), and for the CR100 scale, it was 1.8%.
For [La À ] (measured only in Study 1), linear
regression for log values, power functions (eqn. [1],
Physiological variables with a- and b-values) were calculated for each in-
For HR, linear regressions (eqn. [2]) were calculated dividual. To iteratively decide upon the best combi-
for each individual. The results are presented in nation of a- and b-value, the a-value was chosen so
Table 4. that ao[La À ]b mM and the b-value was chosen from
For the group in Study 1 that used the RPE scale, below where the lactate function started to grow
the mean intercept (a) was 74.2 b.p.m. for men and rapidly because of the additional work (because at
80.1 b.p.m. for women, and the mean slope (c) was low work levels, the production rate in the muscles
0.36 for men and 0.51 for women. The mean best- equals the removal rate). The results are presented in
fit correlation was about rxy 5 0.99 (0.984–0.997). Table 5. The mean a-values obtained were between
For the group that used the CR10 scale, the mean 1.2 and 1.6 mM. When b-values were used (for 35
intercept (a) was 69.3 b.p.m. for men and 75.7 b.p.m. subjects), the mean b-values ranged from about 30 to
for women. The mean slope (c) was 0.37 for men and about 60 W. Obtained mean exponents were between
0.56 for women, and the mean best-fit correlation 2.3 and 2.9. Mean values of the best-fit correlations
was about rxy 5 0.99 (0.979–0.996). For the HRs were about rxy 5 0.98–0.99 (individual values ranging
obtained in Study 2, the mean intercept (a) was from 0.893 to 0.999).
between 70.2 b.p.m. (men, RPE) and 77.4 b.p.m. For Study 1, split-half functions were calculated to
(women, CR10), and the mean slope (b) was between estimate the reliability of individual S–HR functions.
63
8. Borg & Kaijser
Table 5. Mean values (m) and standard deviations (s) of the constants from eqn. [1] (for the measure constant also the geometric mean (gm)) relating
[La À ] to S, based on individual functions for the four groups of subjects of Study 1
Group (N) a b c n rxy
m s m s m s gm m s m s
Total, RPE (20) 1.4 0.5 49.0 29.7 6.4E À 5 1.9E À 4 4.5E À 6 2.59 0.46 0.983 0.019
Total, CR10 (20) 1.3 0.2 43.5 23.6 7.0E À 4 2.5E À 3 7.2E À 6 2.53 0.71 0.986 0.023
Men, RPE (12) 1.6 0.5 61.7 21.8 2.9E À 5 8.7E À 5 1.7E À 6 2.72 0.46 0.981 0.022
Men, CR10 (12) 1.3 0.3 45.0 22.8 1.2E À 3 3.2E À 3 1.8E À 5 2.29 0.71 0.981 0.029
Women, RPE (8) 1.2 0.4 30.0 31.1 1.2E À 4 2.8E À 4 1.9E À 5 2.41 0.41 0.988 0.014
Women, CR10 (8) 1.4 0.2 41.3 26.3 7.1E À 6 6.8E À 6 1.8E À 6 2.89 0.58 0.992 0.005
RPE, Ratings of Perceived Exertion; CR, Category Ratio.
22 12
Man
20
10 Kvinna
18
8
16
R (CR10)
R (RPE)
14 6
12
4
10 Man Fig. 4. Psychophysical scale values
2
8 Kvinna plotted against heart rate (HR) va-
lues for Study 1. Left panel: Ratings
6 0 of Perceived Exertion (RPE) group
60 100 140 180 220 60 100 140 180 220
(N 5 8112), right panel: Category
HR (bpm) HR (bpm) Ratio (CR)10 group (N 5 8112).
Reliability coefficients, rxx, were calculated as well as the CR10 scale, CR10 5 À 5.1010.075 Â HR (rxy 5
estimations of measurement errors, se. For the HR 0.881). Obtained power functions were RPE 5 0.821
intercept, (a) rxx were 0.97 for the RPE group (HR À 50)0.64 (rxy 5 0.897) and for the CR10 scale,
(se 5 1.80) and 0.98 for the CR10 group (se 5 1.73) CR10 5 2.19 Â 10 À 5 Â HR2.49 (rxy 5 0.815).
and for the slope, (c) rxx were 0.98 for the RPE group Figure 5 shows individual ratings with the three
(se 5 0.013) and 0.99 for the CR10 group scales in Study 2 as functions of HRs. Because
(se 5 0.0089). Measurement errors for mean HR unpaired t-tests showed that there were no significant
slopes and intercepts were approximately 2–3%. differences between men and women either for
For [La À ] as well as for HRs in Study 2, there HRs or for any of the subjective responses
were too few data points to enable this computation. ( À 0.4 t159 1.4), as well as because the assump-
Figure 4 shows ratings as functions of HRs for tion could be made that the subjective dynamic
men and women and the two scales in Study 1. ranges were approximately equal for all subjects,
Because the subjects worked on the bicycle ergometer group functions were calculated for the total data
until a voluntary maximum was reached, the varia- set without using aggregated data. Linear regressions
tion in HR (on the x-axis) closely represented a of raw data (eqn. [2]) as well as power functions
similar HR range (and in this case the total HR (eqn. [1]) were used. For the RPE scale, eqn. [2] gave
range) for each subject. Unpaired t-tests showed that RPE 5 2.7210.085 Â HR (rxy 5 0.850), for the CR10
there where no significant differences between men scale, CR10 5 À 4.2510.063 Â HR (rxy 5 0.846)
and women for HRs or for any of the subjective and for the CR100 scale, CR100 5 À 36.161
responses (t286 À 1.2 for the RPE group and 0.529 Â HR (rxy 5 0.857). When power functions
t296 À 0.8 for the CR10 group). Thus, group (eqn. [1]) were applied, the relationships obtained
functions could be calculated including all stimulus were: RPE 5 2.95 (HR À 65)0.38 (rxy 5 0.855);
levels (despite a difference in stimulus range among CR10 5 3.55 Â 10 À 3 (HR À 45)1.56 (rxy 5 0.793);
subjects). It was also decided not to use aggregated and CR100 5 0.474 (HR À 70)1.02 (rxy 5 0.862).
data. Both linear regressions of raw data (eqn. [2]) as To study how the physiological variables contrib-
well as of logarithmic data (eqn. [1]) were used. For uted to the ratings given with the two scales in Study
the RPE scale, eqn. [2] gave for the total group 1, a step-wise regression with the three independent
RPE 5 À 0.05710.104 Â HR (rxy 5 0.899) and for variables entering the regression (S, HR, [La À ]) was
64
9. Three perceived exertion scales and two work tests
22 120 12
Man Man
20 100 Kvinna 10 Kvinna
18
80 8
R (CR100)
R (CR10)
16
R (RPE)
14 60 6
12 40 4
10
Man
20 2
8 Kvinna
6 0 0
60 100 140 180 220 60 100 140 180 220 60 100 140 180 220
HR (bpm) HR (bpm) HR (bpm)
Fig. 5. Psychophysical scale values plotted against heart rate (HR) values for Study 2. Left panel, Ratings of Perceived
Exertion (RPE) values; middle panel, Category Ratio (CR)100 values; and right panel, CR10 values (N 5 12112).
run. A forward solution with F-to-enter 5 4.000 was 36%, and 14%, respectively, and within segment (C),
chosen. With ratings according to the RPE scale, 30%, 20%, and 16%.
only HR entered into the equation explaining 85.6%
of the total variance (F1,118 5 700.2). For the CR10
scale, HR and [La À ] entered into the equation. HR Discussion
alone explained 83.5% of the variance (F1,116 5
588.7), and HR together with [La À ] explained The different groups of subjects used in the studies
85.5% of the variance (F2,115 5 338.4). were comparable, as regards height and weight, to a
normal Swedish population of the corresponding age
group (men: height 5 181 cm and weight 5 81 kg;
Scale comparisons women: height 5 167 cm and weight 5 65 kg, Statis-
To further compare the CR10 and CR100 scales, the tics Sweden, 2002). The subjects used in Study 2
subjective ranges used during the work (Rterminal/R1) had, however, a lower physical working capacity, as
were calculated for each individual in Study 2. The measured by W170, compared with those in Study 1.
mean and standard deviations obtained were, for the This is, however, more likely a result of the differ-
CR10 scale: 7.2 (3.7); and for the CR100 scale: 9.3 ences between the two test protocols because the
(6.1). A paired t-test showed that this difference was effort needed (the total energy used) depends on both
not significant, t23 5 À 1.6 (P 5 0.13). the power output and the time spent exercising,
The number of responses given at the precise especially on higher power levels. The difference in
numbers of the verbal expressions were compared working capacity between men and women, female
with the total number of responses given with each subjects having a working capacity of 65% and 75%
scale. With the CR10 scale, 34% (Study 1) and 37% of that of male subjects, is the difference usually
(Study 2) of given responses were numbers from the ˚
found (Astrand & Rohdal, 1986).
exact location of the verbal expressions, to be com- The purpose of this article was mainly to compare
pared with 25% for the CR100 scale (Study 2). the three methods used with regard to general psy-
The scales were then divided into three segments: chophysical group functions. In psychophysical stu-
(A) bottom of scale to ‘‘weak’’ (weak being in- dies, aggregated data are traditionally used when
cluded); (B) from just above ‘‘weak’’ to ‘‘strong’’; determining general S–R functions. In this article,
(C) from just above strong to top of scale. Within however, individual functions were used. The reason
segment (A) 22% (Study 1) and 33% (Study 2) of the for this was primarily differences in individual work-
total answers with the CR10 scale, and 30% with the ing capacity and a desire to be able to use all
CR100 scale were given. Within segment (B) 41% individual data points. Thus, individual differences
(Study 1) and 43% (Study 2) of the total answers will not be discussed in this article.
with the CR10 scale and 54% with the CR100 scale Because the RPE scale was constructed to fulfill
were given. And, finally, within segment (C), the the requirements of an interval scale, linear regres-
corresponding figures were 37%, 24%, and 18%, sion of raw data was used to describe the S–R
respectively. functions. Very high and significant correlations
Within segment (A) 53%, 52%, and 52% of were found for Study 1 as well as for Study 2. Higher
numbers chosen from each scale, respectively, corre- slopes were obtained for women than for men in both
sponded to the exact numbers at the verbal expres- experiments, indicating a lower functional capacity
sions. Within segment (B), the figures were 27%, in the female groups compared with the male groups.
65
10. Borg & Kaijser
Because of the scale construction, an a-value of at tained, n 5 1.42, was also very similar to what was
least 6 can be expected for the RPE scale. In this obtained with the CR100 scale in the present study.
study, the mean a-values obtained, giving the best-fit For the a-value, a couple of different explanations
correlations, were between 7.0 and 8.2. This can be can be given. First, it might be regarded as mainly a
interpreted as the existence of a basic noise corre- mathematical constant, needed because of some
sponding to an ‘‘extremely light’’ exertion in the deviation from a ‘‘true’’ ratio scale. However, be-
muscles and circulatory system. The intercepts (a- cause an a-value has also been obtained with such
values) and slopes (c-values) obtained coincide well ratio-scaling methods as, e.g., absolute magnitude
with what has previously been found, e.g., a 5 6, estimation (Borg & Borg, 2002) and ratio estimation
c 5 0.047, male subjects (Borg et al., 1987b), (Borg, 1972), physiological and psychological/cogni-
and a 5 7.6, c 5 0.048, male subjects (Borg et al., tive reasons are more likely. It is not at all strange to
1987a). assume a basic background perception from the
Because of their special construction, data ob- muscles even at complete rest. A good explanation
tained with the CR scales can be interpreted as ratio is thus that the a-value should be regarded as a
data. In both experiments, power functions could genuine basic constant corresponding to a sum of
successfully be used to describe the S–R relation- the background noise from the muscles and the
ships. Higher best-fit correlations and mean expo- perception of exertion when pedaling the prescribed
nents between 1.05 and 1.49 were obtained when a- time at zero watts. This latter assumption was tested
values were included in the power functions (eqn. in a study by Cafarelli et al. (1977) who concluded
[1]). For work tests of longer duration, exponents of that ‘‘the additive constant does in fact seem to
about 1.5–2 have been obtained (see, e.g., Noble reflect the effort of pedaling against no load’’. This
et al., 1983; Borg et al., 1985, 1987a, b; Borg, 1998; is also a good motivation for why one should not
Borg & Borg, 2002). For Study 1 (especially with one limit the size of the individual a-value.
outlier excluded), the difference was significant. With As is seen in Figs 2 and 3, HR values at low power
this subject excluded, a significant difference was also levels may be elevated for other reasons than the
obtained for the CR10 exponents between Study 1 physical work (e.g., emotional reasons, nervousness,
and Study 2. etc.). If, for example, a correlation is computed
In a study by Bauman et al. (2004), an error in the between individual HRs obtained at the two sessions
exponent because of regression effect was judged to in Study 2, a correlation of rxy 5 0.50 (P 0.05) is
be of no consequence for correlations above 0.82. In obtained for the lowest level, quickly rising to a
this article, all individual correlations with the CR correlation of rxy 5 0.82 (Prxy 5 0.94 (Po0.001) at
scales were above 0.90 and the resulting errors less the fifth. This insecurity at low levels will, however,
than 2%. affect the RPE–HR relationship at lower levels con-
When no a-values were used, power function tributing to the negatively accelerating function ob-
exponents were close to one (0.8 n 1.10) suggest- tained between RPE and HR (n 5 0.64, Study 1;
ing that the use of eqn. [2] would be sufficient. One n 5 0.38, Study 2). (this can also be seen from Figs
reason, however, to continue using power functions 4 and 5 for some subjects). When it is of importance
for CR10 data is the relationship with HR. The to make extrapolations (e.g., to use RPE 5 20 to
differences in the R–HR relationships between the obtain an estimate of maximal HR that can in turn
RPE and CR scales would be lost, if only linear be used to obtain an estimate of maximal working
regressions of raw data were to be used. A positively capacity), it may be more relevant to use data from
accelerating power function will also do better justice RPE % 11 upward. Not doing so may induce error in
to higher values on the scale. This is important, the estimation of the individual working capacity.
especially when estimations of a maximal or For healthy subjects, this usually implies no risk, but
‘‘peak’’ performance is of interest. it may for different groups of patients. For the same
The mean a-value was about 6–7% of the available reason, the relationship to the CR scales below the
number range for the CR10 scale and about 3% for level ‘‘weak’’ (2 on the CR10 or 13 on the CR100)
the CR100 (cM) scale. This corresponded to a level may be less reliable, and if this is found to be the
just above an ‘‘extremely weak’’ intensity, which is in case (the individual differences may be large in this
good agreement with the 4–7% that has previously regard), one may want to exclude lower values.
been obtained (Noble et al., 1983; Borg et al., 1985, HRs were described by linear regressions of raw
1987b; Borg & Borg, 2002). This can also be com- data with very high best-fit correlations. The two
pared with what was obtained by (1972) for ratio male groups had slightly lower intercepts and lower
estimation (percentage of the conception of maximal slopes than the female groups, showing that male
exertion, work on a bicycle ergometer with 50 W subjects, not surprisingly, had a higher functional
increase every fourth minute) where the mean a-value capacity than female subjects. The differences in
was 3.6%. In this study, the mean exponent ob- slopes between the two studies are likely because of
66
11. Three perceived exertion scales and two work tests
differences in physical working capacity, in combina- individual interpretation of data. Sometimes it is
tion with differences in work-test protocols. For also of interest to make simultaneous ratings of other
Study 2, it does, however, look as if HRs for some perceptions than effort and exertion (e.g., of other
individuals follow a slightly positively accelerating symptoms, such as breathlessness and pain, or even
growth function with power output even when the of other sensory modalities and/or emotional, and
first one or two data points are omitted (Figs 2 and other, components). Then, the general CR scales are
3). This further contributes to the negatively accel- needed.
erating RPE–HR relationship in Study 2 (see Fig. 4). A drawback with the RPE scale is also (as with
For Study 1, split-half reliability could be calcu- ordinal scales) that it is a closed scale with a risk of
lated and measurement errors estimated. Reliability some truncation at the end values of the scale. As can
coefficients were very high (0.91–0.99) for both be seen from Fig. 2, some individuals used the rating
psychophysical ratings and for HRs. This shows ‘‘20’’ more than ones. This has been taken care of in
that subjective ratings, according to the Borg RPE the CR scales by opening up the bottom and upper
and CR10 scales, give reliable measurements similar parts, allowing for the use of decimals as well as
to those obtained with HR. Measurement errors values above the printed figures (above 10 on the
were slightly higher for psychological than for phy- CR10 scale and above 100 on the CR100 scale). As
siological variables. This is not surprising because a can be seen from Fig. 2, a couple of individuals used
larger individual variation should be expected with this possibility.
psychological measurements. The calculations were The tendency of using primarily the numbers at the
done for Study 1, but it is reasonable to assume that exact locations of the verbal anchors was a little less
this holds for ratings in Study 2 as well. with the CR100 scale (25% compared with 34% and
Blood lactates could be described by general psy- 37% for the CR10 scale). The CR100 scale can thus
chophysical power functions with two basic con- be said to meet with the demand of being a more fine-
stants (eqn. [1]). The a-value, varying around 1.4, graded scale than the CR10 scale.
can be thought of as a basic value of [La À ] in the There was no significant difference in exponents
blood when the metabolism is in equilibrium (pro- between the CR10 and CR100 scales, confirming that
duction rate equals removal rate). At some point the scales work in a similar way. This is also in
close to the b-value, however, the production rate agreement with Borg and Borg (2001) who showed
increases above removal rate and [La À ] starts to that one important factor influencing the exponent is
accumulate in the blood. It is likely that in a work the position of verbal anchors. However, despite a
test with a short duration of each work load, a higher 1.8 times larger number range available to the sub-
b-value will be obtained, as was also observed in this jects (between ‘‘extremely weak’’ and ‘‘extremely
study. The exponents were similar to those obtained strong’’) on the CR100 scale (1:36), as compared
previously by Borg (1998). with the CR10 scale (1:20), there was only a small
In the present Study 1, only two physiological and non-significant difference (of 1.3 times) between
variables were used, i.e. HR and [La À ]. Multiple the actual number ranges used from the first to the
step-wise regression showed HR to be the variable last work level. This may depend on differences in the
contributing the most to the RPE ratings and a visual designs of the scales.
combination of HR and [La À ] to the CR10 ratings. The deviation from linearity between RPE and HR
This supports the differences between the scales as for both studies may depend on the special work tests
postulated from their construction. It may seem used (1 and 3 min for each work load, respectively).
surprising that S was not included in either model. The HR and the perception of exertion are influenced
This is, however, in agreement with the theoretical by a combination of the physical power on the
approach that it is proximal and not distal stimuli bicycle ergometer and the time used pedaling at
(the physiological and not the physical variables) that that power. This combination may affect the physio-
mediate the sensations to perception. logical and the psychological variables differently.
In many situations, the RPE scale has advantages Johansson (1986) found that for prolonged exercise
as an instrument that is easy to understand and on the bicycle ergometer, HR came to a steady state
simple to use, giving data that are easy to interpret. with time rather rapidly. The growth of RPE, on the
If, however, the postulated linear relationship to HR other hand, also declined with time, but continued to
is violated, e.g. by the exercise modality or the special grow throughout the entire work, especially at higher
work-test protocol used, these advantages are lost. power levels. The ratings thus grow more over time
The CR scales have the advantage of psychophysical than HRs do, which means that for a work test with
ratio scales giving more correct growth functions several minutes on each load (steady-state character),
(positively accelerating with power output). This one will obtain higher exponents than with one with
gives a better understanding of the underlying phy- shorter durations, as was actually found in this study.
siological and perceptual processes and enhances A deviation from linearity with the RPE scale has
67
12. Borg & Kaijser
previously been found by Borg (1982b) for 30 s minute and short steps between power levels, the
intermittent work (50 W increase). Especially for more fine-graded CR100 scale would be preferred
the male group, the growth of the RPE responses because it encourages subjects to use finer steps at the
followed a slightly negatively accelerating curve (with lower part of the scale.
an exponent of approximately 0.8).
With the work-test protocol used in Study 1 (1 min Perspectives
on each load), significantly lower exponents were, on
average, obtained with the CR10 scale than those The Borg RPE scale (6–20) is easy to understand and
previously obtained in work with several minutes on interpret and may be regarded as rendering interval
each load. With a duration of 3 min on each load, no data. This article, however, shows some drawbacks
difference was observed. With one subject excluded with the RPE scale that point to the advantage of
from Study 1, there was also a significant difference using psychophysical scales with better statistical
in exponents obtained with the CR10 scale between qualities, like the CR scales. The Borg CR10 scale
Study 1 and Study 2, the 1 min protocol giving sig- has been in use mainly as a pain and dyspnea scale
nificantly lower exponents. for more than two decades. This study suggests an
In this study, a fixed-order presentation of stimuli increase in its use in the area of perceived exertion.
was used. This manner is not usual in psychophysical Two CR scales were used in this article, viz., the Borg
studies, but commonly accepted in physiology and CR10 scale and the Borg CR100 scale (cM). The
medicine (ACSM, 1991). That this fixed stimulus latter has a wider numerical range and is a little more
order presentation may have contributed to the lower fine graded with the advantage of giving associations
exponents obtained with the 1 min protocol is hinted to a percentage scale.
at from the differences in the proportions of scale A problem in work physiology, training and reha-
values chosen from different parts of the scales. bilitation is the lack of international agreement on
Within the lower segment of the scale (A), 22% of what scale and what work-test protocol to use. As has
the responses with the CR10 scale for Study 1 were been shown in this study, even minor differences in the
found, as compared with 33% for Study 2. This may time  work load matrix can yield a difference, espe-
mean that subjects in Study 1 overrated the feeling of cially in perceptual magnitudes. The results in this
exertion at low levels (using too-large steps on the article thus point to the need for standardization and
scale for the corresponding increase in exertion). This the development of international norms in this regard.
is further supported by the fact that, in this segment,
Key words: Category Ratio, Borg scale, growth func-
the same proportion of numbers from the verbal
tion, exercise tests.
anchors were used for both work tests, but in the
middle segment, subjects in Study 1 used a larger Acknowledgements
proportion of other numbers, thus compensating for
the too-large steps used in the beginning of the work This study was supported by a grant to Prof. Birgitta Berglund
from the Swedish National Center for Research in Sports no.
test. This would likely have been avoided with a 3/02. The authors also want to thank Prof. Gunnar Borg for
randomized stimulus presentation. Perhaps in a work important comments and suggestions for data treatment. As
test with a step-wise increase of power levels every well, we want to thank one reviewer for valuable comments.
References
ACSM. Guidelines for exercise testing man. Scand Arch Physiol 1936: Borg E, Borg G. A comparison of AME
and prescription. Philadelphia: Lea 74(Suppl 10): 51–82. and CR100 for scaling perceived
Febiger, 1991. Bauman M, Moffat G, Roberts LE, exertion. Acta Psychol 2002: 109:
˚
Astrom H, Jonsson B. Design of exercise
¨ Ward LM. Constrained scaling: 157–175.
test, with special reference to heart achieving quantitative convergence Borg G. Interindividual scaling and
patients. Br Heart J 1976: 3: 289–296. across laboratories. In: Oliveira perception of muscular force. K
˚
Astrand P-O, Rodahl K. Textbook of AM, Teixeira MP, Borges GF, Fysiogr Saellsk Lund Foerh 1961: 31:
work physiology. Physiological bases Ferro MJ, eds. Fechner day 117–125.
of exercise, 3rd edn. Singapore: 2004. Coimbra: International Borg G. Physical performance and
McGraw-Hill, 1986. Society for Psychophysics, 2004: perceived exertion (Studia
Baird JC, Noma E. Psychophysical study 304–309. Psychologica et Paedagogica. Series
of numbers. I. Generation of numerical Beaver WL, Wasserman K, Whipp BJ. altera, Investigationes XI). Lund:
responses. Psychol Res 1975: 37: Improved detection of lactate threshold Gleerup, 1962.
281–297. during exercise using a log–log Borg G. Perceived exertion as an
Bang O. The lactate content of the blood transformation. J Appl Physiol 1985: indicator of somatic stress. Scand J
during and after muscular exercise in 59: 1936–1940. Rehab Med 1970: 2: 92–98.
68
13. Three perceived exertion scales and two work tests
Borg G. A ratio scaling method for Cafarelli E, Cain WS, Stevens JC. Effort Miles MP, Clarkson PM. Exercise-
interindividual comparisons. Report of dynamic exercise: influence of load, induced muscle pain, soreness, and
from the Institute of Applied duration, and task. Ergonomics 1977: cramps. J Sport Med Phys Fit 1994: 34:
Psychology (no. 27), Stockholm, 20: 147–158. 203–216.
Sweden, 1972. Carton RL, Rhodes EC. A critical review Morgan WP. Psychological factors
Borg G. A category scale with ratio of the literature on ratings scales for influencing perceived exertion. Med Sci
properties for intermodal and perceived exertion. Sports Med 1985: 2: Sports 1973: 5: 97–103.
interindividual comparisons. In: 198–222. Morgan WP. Psychological components
Geissler H-G, Petzold P, eds. Davis JA. Anaerobic threshold: review of of effort sense. Med Sci Sports Exerc
Psychophysical judgment and the the concept and directions for future 1994: 26: 1071–1077.
process of perception. Berlin: VEB research. Med Sci Sports Exerc 1985: Noble BJ. Clinical applications of
Deutscher Verlag der Wissenschaften, 17: 6–18. perceived exertion. Med Sci Sports
1982a: 25–34. Douglas CG. Coordination of the Exerc 1982: 14: 406–411.
Borg G. Ratings of perceived exertion and respiration and circulation with Noble BJ, Borg GAV, Jacobs I, Ceci R,
heart rates during short-term cycle variation in bodily activity. Lancet Kaiser P. A category-ratio perceived
exercise and their use in a new cycling 1927: 210: 213–218. exertion scale: relationship to blood
strength test. Int J Sports Med 1982b: 3: Ekblom B, Goldbarg AN. The influence and muscle lactates and heart rate. Med
153–158. of physical training and other factors Sci Sports Exerc 1983: 15: 523–528.
Borg G. An introduction to Borg’s RPE on the subjective rating of perceived Noble BJ, Robertson RJ. Perceived
scale. Ithaca, NY: Movement exertion. Acta Physiol Scand 1971: 83: exertion. Champaign, IL: Human
Publications, 1985. 399–406. Kinetics, 1996.
Borg G. Borg’s perceived exertion and Gescheider GA. Psychophysics. The Nordenfelt I, Adolfsson L, Nilsson JE,
pain scales. Champaign, IL: Human fundamentals, 3rd edn. Mahwah, NJ: Olsson S. Reference values for exercise
Kinetics, 1998. Lawrence Erlbaum, 1997. tests with continuous increase in load.
Borg G, Borg E. Principles and ´
Hassmen P. Perceived exertion: Clin Physiol 1985: 5: 161–172.
experiments in category-ratio scaling. applications in sports and exercise Pandolf KB. Advances in the study and
Reports from the Department of [dissertation]. Department of application of perceived exertion. Exerc
Psychology (no. 789), Stockholm, Psychology, Stockholm University, Sport Sci Rev 1983: 11: 118–158.
Sweden, 1994. Stockholm, Sweden, 1991. Russel WD. On the current status of rated
Borg G, Borg E. A new generation of Hughson RL, Weisiger KH, Swanson perceived exertion. Percept Motor
scaling methods: level-anchored ratio GD. Blood lactate concentration Skills 1997: 84: 799–808.
scaling. Psychologica 2001: 28: increases as a continuous function in Sjostrand T. Changes in the respiratory
¨
15–45. progressive exercise. J Appl Physiol organs of workmen at an ore smelting
Borg G, Domserius M, Kaijser L. Effect 1987: 62: 1975–1981. works. Acta Med Scand (Suppl 196):
of alcohol on perceived exertion in Johansson S-E. Perceived exertion, heart 1947: 196: 687–699.
relation to heart rate and blood lactate. rate and blood lactate during prolonged Statistics Sweden, SCB 2002
Eur J Appl Physiol 1989: 60: 382–384. exercise on a bicycle ergometer. In: Undersokningar av
¨
´
Borg G, Hassmen P, Lagerstrom M.¨ Borg G, Ottoson D, eds. The ¨ ˚
levnadsforhallandena (ULF). Sveriges
Perceived exertion related to heart rate perception of exertion in physical work. officiella statistik, SCB. Retrieved April
and blood lactate during arm and leg London: Macmillan Press Ltd, 1986: 8, 2003, from Statistics Swedens Web
exercise. Eur J Appl Physiol 1987a: 65: 46, 57–68. Site: www.scb.se/statistik/le0101/
679–685. Jorfeldt L, Pahlm O, Brudin L le0101_Viktolangd.asp
Borg G, Ljunggren G, Ceci R. The Standardarbetsprovet. In: Brauer K, Stevens SS., In: Stevens G., ed.
increase of perceived exertion, aches Jorfeldt L, Pahlm O, eds. Det kliniska Psychophysics: introduction to its
and pain in the legs, heart rate and arbetsprovet, 2nd edn. Lund, Sweden: perceptual, neural, and social prospects.
blood lactate during exercise on a Studentlitteratur, 2003: 63–76. New York: Wiley, 1975.
bicycle ergometer. Eur J Appl Physiol Keul J, Simon G, Berg A, Dickhuth H-H, Wahlund H. Determination of the
1985: 54: 343–349. Goertler I, Kubel R. Bestimmung der physical working capacity. Acta Med
Borg G, van den Burg M, Hassmen P, ´ individuellen anaeroben Schwelle Scand (Suppl 215): 1948: 215.
Kaijser L, Tanaka S. Relationships zur Leistungsbewertung und Wallin L, Brudin LH. Physical working
between perceived exertion, HR and Trainingsgestaltung. Deut Z Sportmed capacity determined by different types
HLa in cycling, running and walking. 1979: 30: 212–218. of bicycle exercise tests. Clin Physiol
Scand J Sports Sci 1987b: 9: Lollgen H. Kardiopulmonale
¨ 1988: 8: 529–537.
69–77. Funktionsdiagnostik, 3rd edn. Weiser PC, Stamper DA. Psychophysical
Brooks GA. Anaerobic threshold: review Nurnberg, Germany: Novartis Pharma
¨ interactions leading to increased
of the concept and directions for future GmbH, 2002. effort, leg fatigue, and respiratory
research. Med Sci Sports Exerc 1985: Marks LE. Sensory processes. New York: distress during prolonged, strenuous
17: 22–31. Academic Press Inc, 1994. bicycle riding. In: Borg G, ed.
Buckworth J, Dishman RK. Exercise Mihevic PM. Sensory cues for perceived Physical work and effort.
psychology. Champaign, IL: Human exertion. Med Sci Sports Exerc 1981: New York: Pergamon Press, 1977:
Kinetics, 2002. 13: 150–163. 401–416.
69
![Borg & Kaijser
this scale has also had a follower, the CR100 (or psychological factors (Morgan, 1973, 1994; Weiser &
‘‘centiMax’’ scale, giving ‘‘cM’’ values) (Borg & Stamper, 1977).
Borg, 1994, 2001, 2002), see Fig. 1. There are several important physiological corre-
The RPE scale was constructed to give data that lates for perceived exertion, two of these being HR
grow linearly with stimulus intensity, heart rates and blood lactate concentration ([La À ]). The ap-
(HRs) and oxygen consumption for aerobic work proximately linear increase of HR with power closely
of steady-state character on a bicycle ergometer follows the oxygen demands in the muscles, and can
(4–6 min). The linear growth function of RPE data be regarded as a good correlate for ‘‘central’’ factors.
during an incremental work test has been confirmed in Lactate is produced in the muscles as a natural part
´
several studies (see, e.g., Hassmen, 1991; Noble & of carbohydrate metabolism and has been suggested
Robertson, 1996; Borg, 1998). Data obtained with the to play a major role (even if not directly causal) in
scale can thus preferably be described with linear muscle fatigue and pain experienced during exercise
regression models according to the following equation: (for a review, see, e.g., Miles & Clarkson, 1994).
Lactate may thus be regarded as a good correlate for
R ¼ a þ cS ½2Š
some more ‘‘local’’ factors. The accumulation of
On the CR10 scale, as well as on the more fine graded lactate in the blood has long been said to show that
CR100 (centiMax) scale, verbal anchors and num- anaerobic processes supplement aerobic production
bers are placed congruently to render ratio data that of adenosine triphosphate in the muscles. However,
mimic what is obtained by magnitude estimation. some lactate seems to be produced in the muscles
The psychophysical growth function for overall per- also during fully aerobic conditions and, even at rest,
ceived exertion on a bicycle ergometer has been [La À ] can be expected to be around 1 mM. A more
determined by Borg (eqn. [1] with b 5 0) and the likely reason for blood lactate accumulation may
exponent found to be between 1.5 and 1.7 (see, e.g., therefore be that the production rate in the muscles is
Borg, 1962, 1998). higher than the removal rate (see, e.g., Brooks, 1985;
Already in his thesis Borg (1962) states that the ˚
Davis, 1985; Astrand & Rodahl, 1986, for a discus-
concept of overall perceived exertion can be regarded sion of possible physiological reasons for lactate
as a ‘‘Gestalt’’ made up of perceptions from several production).
important cues. These may be physiologically ‘‘local’’ It has long been known that blood lactate starts to
factors, such as the skin, muscles, joints, and ‘‘cen- increase above a certain exercise level and then keeps
tral’’ factors, such as cardiovascular and pulmonary increasing as the exercise intensity is increased (Dou-
organs (cp. Ekblom & Goldbarg, 1971), and also glas, 1927; Bang, 1936). The relationship with power
6 No exertion at all 0 Nothing at all Absolute maximum
"No I"
7 0.3
Extremely light 0.5 Extremely weak Just noticeable
8 "Maximal" Max I
0.7
9 Very light 1 Very weak Light Extremely strong
10 1.5
Very strong
2 Weak
11 Light
2.5
12 3 Moderate Strong Heavy
4
13 Somewhat hard
5 Strong Heavy
14 6 Moderate
15 Hard (heavy) 7 Very strong
8 Weak Light
16
9
17 Very hard Very weak
10 Extremely strong "Strongest I"
18 11 Extremely weak
Just noticeable
"Minimum"
19 Extremely hard
• Absolute maximum Highest possible Nothing at all
20 Maximal exertion
Fig. 1. Left: Borg RPE (Rating of Perceived Exertion) scale (Borg, 1970, 1998, r G Borg); middle: Borg CR10 (Category
Ratio) scale (Borg, 1982a, 1998, r G Borg); and right: Borg centiMax (CR100) scale (Borg & Borg, 2002, r G Borg & E
Borg).
58](data:image/gif;base64,R0lGODlhAQABAIAAAAAAAP///yH5BAEAAAAALAAAAAABAAEAAAIBRAA7)