Bogotá, 2014 Q4 - JLL
•
1 like•566 views

Colombia saw strong 4.6% GDP growth in 2014 driven by construction, financial services, and consumer demand. However, falling commodity prices negatively impacted mining, manufacturing, and petroleum. Imports grew faster than declining exports, pushing the current account deficit to 5% of GDP. The Central Bank has kept interest rates at 4.5% to support the economy as inflation remains at 3%. Significant new infrastructure projects and continued foreign investment are expected to fuel further economic growth.

Recommended
Recommended
More Related Content
Similar to Bogotá, 2014 Q4 - JLL
Similar to Bogotá, 2014 Q4 - JLL (20)
More from World Office Forum
More from World Office Forum (20)
Recently uploaded
Recently uploaded (17)
Bogotá, 2014 Q4 - JLL
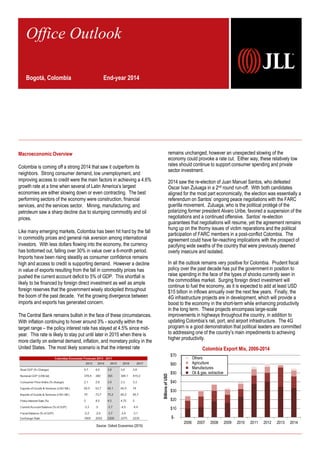
- 1. Office Outlook Bogotá, Colombia End-year 2014 Macroeconomic Overview Colombia is coming off a strong 2014 that saw it outperform its neighbors. Strong consumer demand, low unemployment, and improving access to credit were the main factors in achieving a 4.6% growth rate at a time when several of Latin America’s largest economies are either slowing down or even contracting. The best performing sectors of the economy were construction, financial services, and the services sector. Mining, manufacturing, and petroleum saw a sharp decline due to slumping commodity and oil prices. Like many emerging markets, Colombia has been hit hard by the fall in commodity prices and general risk aversion among international investors. With less dollars flowing into the economy, the currency has bottomed out, falling over 30% in value over a 6-month period. Imports have been rising steadily as consumer confidence remains high and access to credit is supporting demand. However a decline in value of exports resulting from the fall in commodity prices has pushed the current account deficit to 5% of GDP. This shortfall is likely to be financed by foreign direct investment as well as ample foreign reserves that the government wisely stockpiled throughout the boom of the past decade. Yet the growing divergence between imports and exports has generated concern. The Central Bank remains bullish in the face of these circumstances. With inflation continuing to hover around 3% - soundly within the target range – the policy interest rate has stayed at 4.5% since mid- year. This rate is likely to stay put until later in 2015 when there is more clarity on external demand, inflation, and monetary policy in the United States. The most likely scenario is that the interest rate remains unchanged, however an unexpected slowing of the economy could provoke a rate cut. Either way, these relatively low rates should continue to support consumer spending and private sector investment. 2014 saw the re-election of Juan Manuel Santos, who defeated Oscar Ivan Zuluaga in a 2nd round run-off. With both candidates aligned for the most part economically, the election was essentially a referendum on Santos’ ongoing peace negotiations with the FARC guerilla movement. Zuluaga, who is the political protégé of the polarizing former president Alvaro Uribe, favored a suspension of the negotiations and a continued offensive. Santos’ re-election guarantees that negotiations will resume, yet the agreement remains hung up on the thorny issues of victim reparations and the political participation of FARC members in a post-conflict Colombia. The agreement could have far-reaching implications with the prospect of pacifying wide swaths of the country that were previously deemed overly insecure and isolated. In all the outlook remains very positive for Colombia. Prudent fiscal policy over the past decade has put the government in position to raise spending in the face of the types of shocks currently seen in the commodities market. Surging foreign direct investment will continue to fuel the economy, as it is expected to add at least USD $15 billion in inflows annually over the next few years. Finally, the 4G infrastructure projects are in development, which will provide a boost to the economy in the short-term while enhancing productivity in the long term. These projects encompass large-scale improvements in highways throughout the country, in addition to updating Colombia’s rail, port, and airport infrastructure. The 4G program is a good demonstration that political leaders are committed to addressing one of the country’s main impediments to achieving higher productivity. Source: Oxford Economics (2015) $- $10 $20 $30 $40 $50 $60 $70 2006 2007 2008 2009 2010 2011 2012 2013 2014 BillionsofUSD Colombia Export Mix, 2006-2014 Others Agriculture Manufactures Oil & gas, extractive
- 2. Market Overview With fresh streams of investment coming in – both on the demand side as well as the supply side - Bogotá is one of Latin America’s hottest markets. The Colombian capital is one of the region’s most important financial hubs, and is growing as a logistical hub as well. It is increasingly catching the eye of international investors who are looking for a growing market that can promise steady returns. The metropolitan area contains approximately 1,800,000 m2 of Class A or Class AB space. Over 70% of this is in the El Norte sector, the most consolidated and traditional business district that contains the Avenida Chile, Andino/Nogal, Chicó, Calle 100, and Santa Barbara submarkets. 18% of the stock is in Salitre, the corridor that connects the airport with downtown. 4% lies in the old historic downtown and another 7% is in other isolated areas, mainly the northwest and far north of the city. Over the past few years, the Bogotá market has been characterized by pent-up demand, falling vacancy, and rising rents. With many companies looking to either set up shop in Colombia or grow an existing operation, demand has been high but in many cases – such as in 2013 – stifled by a limited supply. This situation generated a very low vacancy rate that fell to 3% a year ago. However a spike in production (170,000 m2) and rather disappointing net absorption (108,000 m2) in 2014 forced the vacancy rate up to 6.1%. The growing interest in office development by both domestic and foreign investors has put an ample amount of space in the production pipeline. Between 2015 – 2017 nearly 800,000 m2 will be delivered. This will likely change the complexion of the market, giving tenants more options and creating a more competitive environment for landlords and developers. JLL estimates that there remains a significant pent-up demand in Bogotá that is capable of absorbing about 200,000 m2 per year. The result will be a much-needed excess of space on the market that will slow the sharp rise in rents that has been witnessed over the last 5 years. The most active submarkets continue to be Chicó, Salitre, and Santa Barbara. In Chicó, developers remain constrained by zoning restrictions and small lots that limit the constructive potential of projects; however given the attractiveness of the location it continues to be the hottest submarket in the city. Salitre continues to see more consolidation, and with the delivery of buildings such as Buro 26, Optimus, Paralelo 26, and more development in the Connecta complex, this corridor is attracting large users who are looking for more affordable and efficient spaces. Santa Barbara, meanwhile, saw the completion of the 24,000 m2 Tierra Firme, though it has been slow to lease up. This submarket will see significant growth in the coming years as several projects have broken ground in the Usaquen neighborhood. While El Norte will remain the most highly desired business district, escalating rents and the lack of large lots (and therefore efficiently spaced buildings) are pushing both supply and demand to other parts of the city. Consequently, the Salitre and “Other” submarkets are seeing significant . Supply and Demand Bogotá, Colombia: End-Year 2014 Forec ast 0% 2% 4% 6% 8% 10% 12% 14% 16% 18% 20% - 50.000 100.000 150.000 200.000 250.000 300.000 VacancyRate RentableArea(m2) Historical Production, Absorption, and Vacancy Production (m2) Absorption (m2) Vacancy Rate Market Equilibrium Vacancy Rate Forecast 0% 2% 4% 6% 8% 10% 12% 14% 16% 18% 20% (10.000) - 10.000 20.000 30.000 40.000 50.000 60.000 Andino Nogal Ave. Chile Calle 100 Centro Intl Chico Salitre Santa Barbara Other VacancyRate(%) RentableArea(m2) Production and Absorption by Submarket, Q4 2014 Net Production, 2014 Net Absorption, 2014 Vacancy - 5 10 15 20 25 30 35 - 2.000 4.000 6.000 8.000 10.000 12.000 14.000 16.000 Andino/ Nogal Av. Chile Calle 100 Chico Santa Barbara Salitre Centro Intl Other NumberofProjects RentableArea(m2) Average Project Size by Submarket, Q4 2014 Average Rentable Area Number of Buildings under Construction
- 3. contrast, Salitre and “Other” are seeing Class A rents as low as COP 45,000-55,000/m2/month. Sale prices are between COP $8mil – 14mil/m2 for Class A space and between COP $5.5mil –9mil/m2 for Class AB space. Cap rates are typically between 8-10% depending on the characteristics of the transaction (asset class, tenant, lease term, etc.). Office Market Statistics Office Market Clock: Latin America JLL continues to view the Bogotá market as entering a state of deceleration in rents despite the fact that some properties are charging up to COP $100,000/m2/month. This is mainly due to the unprecedented amount of production that will enter the market in the next few years. While demand should remain high given the sound macroeconomic fundamentals in Colombia, it is unlikely to immediately absorb all the space coming online. This will create a more stable dynamic, since the growth in rents seen over the past few years is unsustainable. growth – mainly for the following reasons: 1) developers can find more affordable and larger lots here, which allows them to charge lower rents and build out larger floorplates; 2) tenants who are looking to optimize their operating costs are attracted to these parts because they can find efficient spaces and pay lower rents; and 3) buildings in the Salitre and the ‘’Other” sectors are typically developed by larger groups that finance the development and lease it. This is in contrast to El Norte, where the vast majority of projects are developed in the pre-sale model. Large tenants are showing more inclination to the for-lease model because they can establish a long-term relationship with their landlord which allows for better commercial conditions, and the building will likely be better maintained. Prices and Rents Due to the dynamics of the local market – low vacancy and high demand – rents have grown very rapidly in Colombian Pesos. Average Class A rents have grown nearly 6% Y-o-Y and over 10% in two years. However, given the dramatic slide in the exchange rate over the past six months, rents have fallen when stated in USD. Whereas a typical Class A building in USD at mid-year 2014 would have charged between $35-40/m2/month, rents in USD at the current exchange rate would be within the range of $25-30/m2/month. Rents in the El Norte submarkets are typically 10-25% higher than in the decentralized areas. Some new projects in Santa Barbara are now asking in excess of COP 100,000/m2/month, and even many second generation spaces in El Norte are asking at least COP 70,000. In 2013 End-Year 2014 End-Year Trend (next 12 months) Class A Rent (COP$/m²/mo.) 60k – 90k 65k – 95k Class AB Rent (COP$/m²/mo.) 50k – 72k 50k – 75k Service Charges (COP$/m²/mo.) 6k – 10k 6k – 10k Total Costs Class A (COP$/m²/mo.) 66k – 100k 71k – 98k Total Costs Class AB (COP$/m²/mo.) 56k – 82k 56k – 82k Production (m²) 90,000 170,000 Absorption (m²) 116,000 108,000 Vacancy Rate 3.0% 6.1% Vacancy (m2) 49,000 110,000 Future Supply (EY 2017) 2,600,000 m2 340 Buildings Source: JLL Research (2015) Bogotá, Colombia: End-Year 2014 - 200.000 400.000 600.000 800.000 1.000.000 1.200.000 1.400.000 1.600.000 1.800.000 Centro Intl: Q414 Centro Intl: Q417 El Norte: Q414 El Norte: Q417 Salitre: Q414 Salitre: Q417 Other: Q414 Other: Q417 RentableArea(m2) Change in Ownership Structure by Sector, 2014-2017 Single Operator Simplified Strata Title
- 4. Barranquilla Cartagena Bogotá Santa Marta Bucaramanga Stock: 80,000 m2 Vacancy: 8% 2014 Absorption: 12,000 m2 2014 Production: 8,000 m2 Class A Rents: COP 35k – 45k/m2/mo. Class AB Rents: COP 30k – 35k/m2/mo. Production through 2017: 50,000 m2 Cali Stock: 175,000 m2 Vacancy: 7% 2014 Absorption: 15,000 m2 2014 Production: 17,000 m2 Class A Rents: COP 40k – 45k/m2/mo. Class AB Rents: COP 15k – 35k/m2/mo Production through 2017: 50,000 m2 Caribbean Stock: 136,000 m2 Vacancy: 7.6% 2014 Absorption: 18,000 m2 2014 Production: 19,000 m2 Class A Rents: COP 45k – 60k/m2/mo. Class AB Rents: COP 35k – 55k/m2/mo. Production through 2017: 130,000 m2 Medellin Stock: 570,000 m2 Vacancy: 3.9% 2014 Absorption: 38,000 m2 2014 Production: 49,000 m2 Class A Rents: COP 35k – 60k/m2/mo. Class AB Rents: COP 25k – 45k/m2/mo. Production through 2017: 205,000 m2 Colombia at a Glance Exchange Rate (Feb 2015): 1 USD = 2,300 COP Bogotá Stock: 1,801,000 m2 Vacancy: 6.1% 2014 Absorption: 108,000 m2 2014 Production: 169,000 m2 Class A Rents: COP 65k – 100k/m2/mo. Class AB Rents: COP 45k – 68k/m2/mo. Production through 2017: 780,000 m2
- 5. Latin America: Northern Cone Jean Wettling – Vice President, Transactions Jean.Wettling@am.jll.com http://www.latinamerica.jll.com/ Scott Figler – Consultant Scott.Figler@am.jll.com http://www.latinamerica.jll.com/ Standard Unit of Measurement Unit of Measurement Square Meters (m2) Typical Market Practices Lease Contracts Rent Quoted in COP /m² /month Typical Lease Term 5 years Frequency of Rent Payment Monthly Deposit / Lease Guarantee Typically an insurance policy is requested in case of failed payment. Security of Tenure Only for the duration of the tenancy. No guarantee beyond the original lease term, unless negotiated. Statutory Right to Renew Yes (unless an option to renew is agreed at the outset and specified in the lease) Basis of Rent Increases or Rent Review CPI + 1 - 3% Frequency of Rent Increases or Rent Review Annual Transaction Fees Agency Fees 2 month’s rent for 5 year contract. Agency Fees (payable by Landlord / Tenant) Landlord Legal Fees (payable by Landlord / Tenant) Each part responsible for its own legal costs Incentives Rent Free Period 1-3 months The rent free period is not standardized in the local market, however typically occurs. The length of this period is negotiated between the parties. Service Charges, Repairs and Insurance Service Charges/Managements Fees Additional to the rental charge and payable monthly in advance Utilities (Sometimes separately metered, sometimes paid as a percentage of occupation) Electricity, telephone, AC, etc. paid by tenant according to consumption Car Parking 1 space per 50 m2 included in the lease contract. Internal (Tenant Space) Tenant Common Areas (reception, lift, stairs, etc.) Tenant External / Structural Landlord Building Insurance Landlord COPYRIGHT © JONES LANG LASALLE IP, INC. 2015. All rights reserved. Taxes Local Property Taxes Landlord, annually VAT on Rent & Service Charge (Payable by Tenant) 16% Disposal of Leases Sub-Letting & Assignment Normally yes (subject to landlord approval) Early Termination Unless otherwise stipulated in the rental contract, tenant is responsible for paying the entirety of the contractual obligation Tenant's Building Reinstatement Responsibilities at Lease End Original condition, allowing for normal wear and tear. Purchasing Properties Foreign Ownership No restrictions Strata Title (Partial ownership of the building) Strata title ownership is typical Security Deposit Case-by-case Agency Fees 3% paid by the Seller. Legal Fees Each part responsible for its own legal costs Other Transaction Costs Typically paid by Buyer