SlideShare a Scribd company logo
1 of 16
Download to read offline
Sell
High
43.72
48.75
48.61
48.42
49.00
41.00
59.76
74,093
166,682
2.46B
0.37
(39.25)
(1.24)
N/A
2013 2014 2015 2016
Rev Growth 3.10% 4.44% 0.59% -7.90%
NOI Growth 2.94% 2.89% 0.79% -14.12%
EBITDA Growth 4.32% 1.05% 0.29% -16.13%
EBITDA Margin 56.84% 55.05% 54.88% 49.94%
ICR 3.15 3.37 3.64 3.14
FFO Growth 11.85% 4.98% 5.64% -20.22%
P/FFO Multiple 43.72
Monte Carlo 45.43
Value/ShareMethodology
Market Cap
Beta
PE Ratio (TTM)
EPS (TTM)
Earnings Date
2.25 (4.62%)Dividend & Yield
Overview (CAD$)
Market Data (CAD$)
Financial Data (CAD$)
Valuation Result (CAD$)
Recommendation
Uncertainty
12-month Target price
Previous Close
Open
Day's Low
Day's High
52 Week Low
52 Week High
Volume
Avg. Volume
Boardwalk REIT
Date: 12-Apr-2017 Open Price: $48.61 Recommendation: Sell
Ticker: BEI-UN.TO Closing Price: $48.67 12-Month Target Price: $43.72
Executive Summary
Investment Recommendation
We issue a Sell recommendation on Boardwalk REIT with a 12-month target price of
$43.72 with a projected total return of -10.17% from its April 12, 2017 closing price
of $48.67. Our target price is calculated by (1) forecasting the 12-month target price
by P/FFO Multiple method, and (2) using Sensitivity Analysis – Monto Carlo approach
to simulate the 12-month target price.
Bulls Say
 The Boardwalk is one of the largest apartment rental companies among the whole
Canada and it is believed to maintain a dominant position in the residential industry.
 In the long run, the rally of the oil price would lead the recovery of the Alberta
province’s economy and bring the Boardwalk Company along for the ride.
 The Alberta province is expected to emerge from the worst recession in the history
because of the decreasing impact of wildfire and the rebuilding of Fort McMurray.
 The Boardwalk is currently availing itself of the downturn Alberta economy by
purchasing cheap assets, buying back shares, and giving a dividend increase.
 It is projected that the Canada’s economy would experience a stable increase in the
next several years, which would positively impact the rental and real estate industry.
Bears Say
 Certain expenditures and costs must be paid regardless of its business status. Also,
its properties are highly related to mortgages. Insufficient or unstable income may
lead to the default of the mortgage payments, leading to huge losses.
 A variety of new environmental, health and safety laws may cause unpredicted
liabilities and expenditures to the Boardwalk Company.
 The marketing and related strategy of other rivals may potentially impact Boardwalk
and pose threat to Boardwalk’s market position.
 The unemployment rate continuously went up and reached a 20-year high of across
the Alberta province. The bad economic performance slowed the in-migration of
Alberta. Consequently, vacancy rate would grow up dramatically, causing a decrease
of revenue.
 Although the oil prices have witnessed a historical low in the previous year, a lower
oil price might still continue over an extended period of time and cause continuous
downturn of Alberta’s economy, resulting in a poor future performance of the
Boardwalk.
Figure 1: Summary of Market,
Financial, and Valuation Data
Figure 2: Historical Price of Boardwalk Figure 3: Monte Carlo Simulation
57.64%
Sell
Sell
Source: Boardwalk REIT, Yahoo Finance
Business Overview
Boardwalk REIT
Boardwalk REIT is an unincorporated open-ended real estate investment trust
established on January 9, 2004. As of December 31, 2016, its portfolio valued around
28,923,950, including over 200 properties, 33,773 residential units within the
Provinces of Alberta, Saskatchewan, Ontario and Quebec, representing over 28
million net rentable square feet of revenue producing multi-family residential
apartment units (Figure 4). Boardwalk’s properties mainly vary between high-rises,
low-rises and townhomes and appeal to a wide demographic of resident members.
In November of 2016, Boardwalk announced the formation of joint venture with
RioCan REIT to build a 12-storey mixed used tower approximately 120,000 sq.ft of
residential and 10,000 sq.ft. of retail space with close proximity to the University of
Calgary, Foothills Hospital, and McMahon Stadium (Figure 5).
Boardwalk’s principal objectives are to provide its residents with the best quality
communities and superior customer service, while providing unitholders with
sustainable monthly cash distributions, and increase the value of its trust units
through selective acquisitions, dispositions, development, and effective
management of its residential multi-family communities. Boardwalk REIT was traded
on the Toronto Stock Exchange (“TSX”) under the trading symbol ‘BEI.UN’. From
2011 to 2016, its unit price of the stock fluctuated from 44.04 to 71.40 and its
regular monthly distribution varied from 0.15 to 0.1875. The assets were mainly
located in Alberta (60.6%), but the company also had assets in Quebec (17.8%),
Saskatchewan (13.9%), and Ontario (7.7%) (Figure 6).
Unitholders
Currently, Boardwalk’s equities are mainly shared by institutions and mutual funds
(Figure 8). In respect to shares owned by institutions, the Boardwalk properties
Limited, the company itself, holds the largest proportion of shares, accounting for
25.62% of the total shares. Beside the company itself, the top institution holder also
includes CIBC Asset Management Inc. (9.60% of the total shares), Sentry Investments
(7.47% of the total shares), and TD Asset Management Inc. (3.59% of the total
shares)
For the shares owned by the mutual funds, Columbia Acorn International Fund Z
holds 2.08% of the total shares, ranking it the top one owner in the mutual funds
section and followed by the MFS Diversified Income Fund Class A (1.45%) and MFS
Global Real Estate Fund Class A (0.90%).
Corporate Governance
Corporate governance means the process and structure used to direct and manage
the business and affairs of the corporation with the objective of enhancing
unitholder value, which includes ensuring the financial viability of the business. The
process and structure define the division of power and establish mechanisms for
achieving accountability among the board of trustees and management for the
benefit of the Trust.
Boardwalk is committed to adhering to the highest possible standards in its
corporate governance practices. As set forth in this Corporate Governance Manual,
these practices are designed to assist Boardwalk in achieving its principal stated
corporate objectives, which are to: (1) provide unitholders with stable and growing
cash distributions, partially, on a Canadian income tax-deferred basis, from
investments in its assets, platform and any additional revenue producing multi-
family residential properties or interests; and (2) increase trust unit value through
the effective management of its residential, multi-family, revenue-producing
properties and the acquisition of additional accretive properties or interests therein.
Boardwalk believes that in order to enhance unitholder value, on a long term basis, it
is advisable to take into account the interests of its other stakeholders.
Figure 4: Boardwalk REIT – Residential
Units among Canada
Figure 5: Brentwood Village Shopping
Centre in Calgary
Figure 6: Unit Breakdown by Province
Source: Annual Report 2016, Boardwalk REIT
Source: Development Portfolio Page, RioCan
Source: Annual Report 2016, Boardwalk REIT
Figure 7: NOI Breakdown by Province
Source: Annual Report 2016, Boardwalk REIT
Name Type Shares Pct
Boardwalk Ltd Inst. 4,475,000 25.62%
CIBC Asset Mgmt. Inst. 4,868,713 9.60%
Sentry Investments Inst. 3,787,959 7.47%
TD Asset Mgmt. Inst. 1,821,223 3.59%
Columbia Acorn Int’l Fund 1,053,355 2.08%
MFS Diversified
Income Fund 733,827 1.45%
MFS Global Real
Estate Fund 452,678 0.90%
The Board of Trustees has established a compensation, governance and nominations
committee which regularly reviews exiting Board policies and current
pronouncements on recommended “best practices” for corporate governance. The
Trust recognizes that proper and effective corporate governance is a significant
concern and priority for investors and other stakeholders and, accordingly, the Board
of Trustees has instituted a number of procedures and policies in an effort to always
improve the overall governance of the Trust.
Industry Overview
Demand Drivers
 Oil price expected to rally from the downturns
Alberta’s economy is heavily subjected to the energy industry. In the year 2015, the
energy industry contributes large proportion of Alberta’s total GDP (Figure 9). Based
on WTI, West Texas Intermediate, there has been a sharp drop in the oil price since
the year 2014 (Figure 10). The decrease in the oil price caused a downturn of
Alberta’s economy. Consequently, this caused (1) less confidence, lower expectation
and higher uncertainty of the future economy, (2) an increasing unemployment rate
across the whole Alberta province due to the negative correlation between the WTI
and unemployment rate (Figure 11), (3) a decreasing number of net international
migration and a negative net interprovincial migration (Figure 21), resulting in less
demand in the rental market. The oil price would still stay at a relatively low position
despite the fact that the oil price is predicted to rally from its historical low in the
following several years.
 Unemployment rate of Alberta expected to stay at high level
Unemployment rate can directly impact the vacancy rate and the demand in the
rental market. It is believed that the vacancy rate is positively related to the
unemployment rate because the unemployment and loss of salary income would
reduce the intent to rent, causing people to spend a smaller proportion of their
money on rental and to choose to rent apartments located in less favourable place.
Before year 2015, the unemployment rate was relatively low but there was a
continuously increase since 2015 (Figure 11). Currently, the unemployment rate is
around 8% provincially and an even higher unemployment rate is witnessed in the
major cities of Alberta (Figure 12). The unemployment rate of Alberta is expected to
maintenance at a high level at around 8% by 2018, would undoubtedly adversely
impact the rental and real estate industry in Alberta.
 Long term interest rate decrease with greatly potential
The interest rates was low throughout the year 2015 and 2016. As of February 2017,
it is suggested that there would be a continuous decrease in long term, namely five
and ten-year, mortgage rates. However, the potential impact of the increase of U.S
Federal Reserve interest rate should also be taken into consideration. Mortgage rate
is a key factor determining people’s preference between rental and real estate
purchasing.
 Economics performance sturdy nationally
Based on the GDP, Canada is believed to be in a sturdy economics condition. The
GDP increased stably with a greater average annual growth rate and a smaller
standard deviations in the following years when compared to other OECD countries
(Figure 20). The sturdy outlook of the Canadian economy would increase the
demand of the rental market and positively contribute to the real estate market
nationally
Figure 9: Economic Diversity 2015,
Alberta Province
Figure 9: Economic Diversity 2015,
Alberta Province
Source: Economic Highlights, Highlights of the
Alberta Economy 2017
Figure 8: Current Ownership of
Boardwalk REIT
Source: Boardwalk Ownership, Morningstar
Figure 10: West Texas Intermediate
Forecast
Source: Wall Street Journal and Alberta Energy,
f-forecast
Figure 11: Alberta Labour Market
Indicators Forecast
Source: Statistics Canada and Alberta Treasury
Board and Finance, f-forecast
* The number of people working or looking for
work
Industry Structure Analysis
In order to draw the competitive landscape of the residential REIT industry, it is
important to position the industry among the identified rivals, potential entrants,
buyers, substitutes, and suppliers that interact and interfere with it. To do so,
Porter’s Five Forces concept is the most used by professionals. In addition, the
competitor environment is also evaluated through the industry’s dominant economic
features such as market size and growth rate, number of rivals, and scope of
competitive rivalry.
 Threat of new entrants
REITs need to raise funds to acquire properties and run operations. Access to such
funds is often restricted; hence barriers to entry the industry are high. Moreover,
REIT's assets are subject to a variety of federal, state, and local environmental,
health and safety laws. Threat of new competitors is initially judged to be weak,
existing competitors fight to produce larger profits in the lodging business.
Consequently, the threat of new entrants is quite low, a new player would have a
great deal of trouble just moving into this industry.
 Bargaining power of suppliers.
The Residential REIT industry mainly identifies two types of suppliers (a) the
construction companies (b) the household suppliers such as decoration companies,
furniture, and infrastructure suppliers. Due to quite large and stable construction
suppliers, their bargaining power is relatively low. Moreover, residential REITs have a
huge range and choice of household suppliers. Overall, the threat of suppliers weakly
affects the residential industry.
 Bargaining power of buyers:
Powerful customers are able to exert pressure to drive down prices, or increase the
required quality for the same price, and therefore reduce profits in the industry.
Right now the bargaining power of buyers seems pretty high as there seems to be
more residential apartments than buyers. The issue of demand and supply, as with
any industry, is an important performance indicator for multi-family real estate. In
fiscal 2016, Boardwalk REIT reported a year-over-year decrease of 158 basis points in
its occupancy rate. A softening in the Western Canadian markets contributed to the
overall occupancy rate decrease. Since the vacancy rate may continue to increase in
the short run, as the overall economic and market condition is relatively sluggish,
would conclude that the bargaining power of buyers is at a high level.
 Threat of substitutes
The feasible substitute for REIT might be directly investing in real estate, which refers
to buy instead of rent. However, given the economic downturns and the slow
recovery mode, the threat of substitute in residential REIT business and its impact on
profitability of the industry is quite low.
 Rivalry among existing competitors
There is a moderate competitive rivalry right now. Each segment of the real estate
business is competitive. Numerous other residential developers and apartment
owners compete in seeking tenants. Although Boardwalk is one of the largest
residential REIT and its strategy is to own multi-family properties in premier locations
in each market in which it operates, some of the apartments of its competitors may
be newer, better located or better capitalized. The existence of alternative housing
could have a material adverse effect on Boardwalk’s ability to lease space in its
properties and on the rents charged or concessions granted, and could adversely
affect Boardwalk REIT’s revenues and its ability to meet its obligations.
Figure 12: Calgary CMA Full and Part
Time Employment
Source: Labour Market Indicators, Statistics
Canada
Figure 13: Calgary CMA Employment
Growth
Source: Conference Board of Canada Forecast,
Statistics Canada
Figure 14: Alberta Average Weekly
Earnings
Source: Labour Market Indicators, Statistics
Canada
Figure 15: Year-over-year Change in
Alberta Average Resale Price and Rented
Accommodation CPI
Source: Canadian Real Estate Association,
Statistics Canada
Three major competitors for boardwalk are,
1. Canadian Apartment Properties REIT (“CAPREIT”)
CAPREIT (Figure 16) was founded in 1997 and is headquartered in Toronto, Canada.
It operates as an open-end real estate investment trust, and owns more than 41,000
apartment and townhouse units as well as 6,400 land lease sites in 31 different
mobile home parks. It has 52% of properties located in Ontario with another 21% in
Quebec. And it plans to build approximately 9,300 new apartment suites. Shares
currently trade at $33.52 each, which reaches to a 52-week and five-year high. The
REIT’s market cap is $4.3 billion.
CAPREIT has a debt-to-net-assets ratio of 44.65, and a P/FFO ratio of 18.377. And
CAPREIT pays investors 10.41 cents per month for each share owned, which is a 3.9%
yield. The dividend has also been hiked four times in the last five years. The payout
ratio is slightly lower than Boardwalk’s, coming in at 70 %.
2. Northview Apartment REIT(“Northview”)
Northview (Figure 17) is an unincorporated, open-ended real estate investment
trust. Northview is Canada’s third largest publicly traded multi-family residential real
estate investor and operator, providing a broad spectrum of rental accommodations
with a portfolio of approximately 24,000 quality residential suites in more than 60
markets across eight provinces and two territories. While its portfolio consists
primarily of multi-family residential property, including apartments, townhomes and
single family apartment buildings.
Northview’s shares currently traded at $22.56 for each, approaching to a 52-week
high, and its market cap is $1.13 billion. The diluted FFO per unit of $2.21 for the
year ended December 31, 2016, and a P/FFO ratio of about 9.95. The payout ratio is
74.1% for 2016.
3. Morguard North American Residential REIT (“Morguard”)
Morguard North American Residential REIT (Figure 18) is an open-end real estate
investment trust. The REIT was formed to own a diversified portfolio of multi-suite
residential rental properties across Canada and the U.S. Its primary objectives are: to
generate stable and growing cash distributions to Unitholders on a tax-efficient
basis; to enhance the value of its portfolio and the long-term value of its units
through active asset and property management; and to expand the REIT's asset base,
primarily through acquisitions and property improvements.
Following its Initial Public Offering ("IPO") in April 2012, the REIT has doubled its
portfolio size to 13,215 suites at 46 multi-suite residential properties in North
America. The real estate portfolio consists of 31 U.S. low-rise and mid-rise apartment
communities and 15 Canadian residential apartment communities located in Alberta
and Ontario. It had total assets of $2.2 billion at December 31, 2016.
Morguard’s shares currently traded at C$15.12 for each, almost reaching to a 52-
week high, and its market cap now is $0.593 billion. The diluted FFO per unit of $1.20
for the year ended December 31, 2016, with a P/FFO ratio of about 12.177. The
payout ratio is 49% for 2016.
Sum-of-the-Parts Summary
 Low-level Force: threat of new entrants; bargaining power of suppliers; threat of
substitutes
 Medium-level Force: rivalry among existing competitors
 High-level Force: bargaining power of buyers
Previous Close 33.58
Open 33.64
Day's Low 33.49
Day's High 33.77
52 Week Low 28.14
52 Week High 33.78
Volume 126729
Avg. Volume 236466
Market Cap 4.53B
Beta (0.07)
PE Ratio (TTM) 10.18
EPS (TTM) 3.32
Earnings Date N/A
Dividend & Yield 1.28 (3.81%)
FFO 1.71
P/ FFO 18.38
Market/Financial Data ($CAD)
Figure 16: Summary of Market,
Financial Data, CAPREIT
Source: Canadian Apartment Properties REIT,
Yahoo Finance
Previous Close 22.56
Open 22.48
Day's Low 22.36
Day's High 22.54
52 Week Low 18.43
52 Week High 22.54
Volume 170664
Avg. Volume 84585
Market Cap 1.12B
Beta 1.09
PE Ratio (TTM) 15.68
EPS (TTM) 1.44
Earnings Date N/A
Dividend & Yield 1.63 (7.22%)
FFO 2.14
P/ FFO 10.52
Market/Financial Data ($CAD)
Figure 17: Summary of Market,
Financial Data, Northview
Source: Northview Apartment REIT, Yahoo Finance
Previous Close 15.12
Open 15.10
Day's Low 15.05
Day's High 15.30
52 Week Low 11.63
52 Week High 15.30
Volume 15042
Avg. Volume 42032
Market Cap 776.06M
Beta 0.45
PE Ratio (TTM) 26.29
EPS (TTM) 0.58
Earnings Date N/A
Dividend & Yield 0.64 (4.23%)
FFO 1.20
P/ FFO 11.35
Market/Financial Data ($CAD)
Figure 18: Summary of Market,
Financial Data, Morguard
Source: Morguard North American Residential
REIT, Yahoo Finance
Investment Summary
Investment Drivers
 Boardwalk expected to benefit from the recovery of the Alberta economy
Since Boardwalk is a Canadian apartment rental company and has the largest portion
of business in Alberta, the rally of the Alberta economy would decrease the
unemployment rate and allow people to choose more desirable apartment to rent
and to spend more on the their rental (Figure 19). Boardwalk is expected to benefit
from the lower unemployment rate and greater household income of the Alberta
residents.
 Boardwalk stay dominant in the residential rental industry
Boardwalk is believed to remain dominant and hold a stable market share in the
apartment rental industry. The steady development of Boardwalk in recent years has
made itself a reliable brand in the rental industry.
 Boardwalk’s strategic management methods
The company is taking the advantage of downturn of Alberta’s economy by
purchasing cheap assets, buying back shares, and giving investors a dividend
increase. Also, the Boardwalk, itself, is the largest holder of the equities, which
would undoubtedly reliability of the trust.
 Slow rally with historical high vacancy rate
Though it is suggested that the Boardwalk is going to benefit from the recovery of
Alberta’s economic recovery, it should not be neglected that, in the short run, the
unemployment rate and vacancy would still stay in a historical high level because the
slow recovery process (Figure 22). To some extent, the company would still suffer for
a certain time due to this slow recovery process.
Investment risk
 Limited liquidity and mortgage liability
Certain expenditures and costs must be paid regardless of its business status.
Boardwalk’s properties are highly related to mortgages. Insufficient or unstable
income may lead to the default of the mortgage payments, leading to a huge losses
to the company. Also, the illiquid of the Real estate would limit Boardwalk’s ability to
vary our portfolio promptly in response to changing economic or investment
conditions.
 Government laws and regulations
Boardwalk, as one of the company in the real estate industry, is committed to obey
the related Canadian laws and regulations regarding to real estate and environment.
The potential future laws and regulations may encumber Boardwalk with
unpredicted liability and corresponding costs.
 Entrance/Expansion of Competitors
Although the Boardwalk tried to attract tenants by using different marketing
strategies, the existence of the other similar companies and alternative housing can
negatively impact Boardwalk’s profits by offering lower prices to seize the market
share.
 Dividends and related cash distributions
Boardwalk announced to continuously make distribution, but the real amount of the
distributions heavily relies on many factors. The distributions may be greater than
Boardwalk’s available cash because of some uncontrollable factors or unpredicted
changes in some factors.
Figure 20: Canada GDP Growth Projection
Figure 19: Alberta GDP Growth Projection
Source: Statistics Canada and Alberta Treasury
Board and Finance, e-estimate, f-forecast
Source: Canada Economy Forecast, OECD Forecast
Figure 21: Alberta Natural Increase and
Immigration Drive Population Projection
Source: Change in the Alberta Population by
Component, Statistics Canada and Alberta Treasury
Board and Finance, f-forecast
Figure 22: Historical Alberta Vacancy Rate
Source: Boardwalk REIT Annual Report 2016
Market Cap Weights P/FFO
Company Name
CAPREIT 4.53B 51.04% 18.38
Northview REIT 1.12B 12.62% 10.52
Morguard REIT 776.06M 8.63% 11.35
Boardwalk REIT 2.46B 27.71% 17.13
Weighted Average 16.43
Comparable Companies-P/FFO Multiple (2016)
2017F
(Loss) profit for the year (60,629)
Adjustments -
Loss on sale of assets -
Fair value losses 167,897
Add back distributions to LP Class B Units
recorded as financing charges
9,224
Deferred income tax expense 33
Depreciation expense on Property Plant & Equip. 6,456
Funds from operations 122,980
Units 46,263
Funds from operations – per Unit 2.66
Boardwalk FFO Estimate
FFO estimated for 2017 2.66
Comparable P/FFO multiple 16.43
Implied 12-month Target price 43.72
Valuation Summary
As at end of 2012 2013 2014 2015 2016
Rental Revenue 433,205 446,626 466,435 469,209 432,140
Revenue Growth 0.51% 3.10% 4.44% 0.59% -7.90%
Total Revenue 439,901 453,584 473,245 476,148 438,846
Net operating income 276,064 284,189 292,402 294,702 253,099
NOI Growth 5.10% 2.94% 2.89% 0.79% -14.12%
Administration expense (28909) (26362) (31871) (33407) (33947)
Con. EBITDA 247,155 257,827 260,531 261,295 219,152
EBITDA Growth - 4.32% 1.05% 0.29% -16.13%
EBITDA margin 56.18% 56.84% 55.05% 54.88% 49.94%
Con. interest expense 89,649 81,813 77,341 71,766 69,784
Interest coverage ratio 2.76 3.15 3.37 3.64 3.14
NAV 2,845,021 3,082,664 3,214,498 3,459,536 2,680,206
Financial Analysis
 Long-term downturn of the Economy of Alberta
The oil price greatly dropped in the recent years and resulted the downturn of the
economy of Alberta. The long-term downturn and unpromising expectation of the
economy of Alberta is likely to depress the economy further and increase the
unemployment rate and vacancy rate.
Valuations
Valuation Methodology
To value Boardwalk REIT, I used a relative valuation approach. The trading multiples
analysis is appropriate to value REIT due to the comparable set of other public
competitors. The selected competitors were deemed comparable on the basis of
their business model (Residential REITs) and market capitalization. I valued
Boardwalk REIT using the P / FFO multiple. P / FFO was selected since (1) Multiples of
earnings measures of this kind are widely accepted in evaluating shares across global
stock markets and industries, and (2) FFO estimates are readily available through
market data providers, such as Bloomberg and Thomson Reuters, which facilitates
calculating P/FFO multiples.
 Valuation summary
I collected the three competitors’ P/FFO multiple of 2016, and gave different weights
to them based on each company’s market cap. Hence, I got a comparable industry
P/FFO multiple as 16.43 (Figure 23). Meanwhile, I forecasted the FFO of 2017 would
be 2.66 according to reasonable analysis (Figure 24). Hence, this implies a 12-month
target price of 43.72 (Figure 25).
Financial Analysis
 Rental revenue growth (Figure 26)
As with all real estate rental operators, Boardwalk REIT’s financial performance is
sensitive to occupancy rates. As previously mentioned, given a softening of the
rental markets, particularly in Alberta and Saskatchewan, and the impact uncertainty
resulting from lower oil prices, Boardwalk still need time to get recovered from the
downturn. Even though, it focus is on maintaining and increasing, in certain regions,
occupancy in the short term by offering various suite specific incentives in exchange
for longer-term leases. Hence, I would predict the rental revenue growth continued
to be negative in 2017 and 2018. And since the oil price is estimated to get back to a
relatively stable level, the rental revenue growth may then turn into positive.
 Net operating income and funds from operating (Figure 27)
The Trust is estimating a slowing of NOI and decline in FFO as the rental market
begins to rebalance. In 2017, it is anticipated that negative NOI and FFO growth
would be witnessed as the Trust carries the additional vacancy from 2016, and
begins 2017 with a lower revenue base than it had at the beginning of 2016. I
predicted the NOI growth for the following 3 years would be -11.71%, -5.8% and -
1.74%, respectively. By investing in the newest communities and developments, the
Trust has positioned itself to improve its portfolio which may allow Boardwalk to
recover for the following years.
 Consolidated EBITDA margin (Figure 26)
EBITDA margin is a measurement of a company's operating profitability as a
percentage of its total revenue. It is equal to earnings before interest, tax,
depreciation and amortization (EBITDA) divided by total revenue. Because EBITDA
excludes interest, depreciation, amortization and taxes, EBITDA margin can provide
an investor, business owner or financial professional with a clear view of a
company's operating profitability and cash flow.
Figure 23: P/FFO Multiple Summary, 2016
Source: Boardwalk REIT Annual Report 2016;
Yahoo Finance
Figure 24: Boardwalk FFO Projection 2017
Figure 25: Valuation Result, 12-month
Target Price
Source: Boardwalk REIT Annual Report 2016
Figure 26: Summary of Financial Analysis,
Boardwalk 2012 – 2016
2012 2013 2014 2015 2016
Net operating income 276,064 284,189 292,402 294,702 253,099
% Y to Y Growth 5.10% 2.94% 2.89% 0.79% -14.12%
FFO per unit 2.87 3.21 3.37 3.56 2.84
% Y to Y change 13.89% 11.85% 4.98% 5.64% -20.22%
NOI and FFO change
Liabilities Cost of Capital Predict Value
Mortgages payable 2.47% 381,416
LP Class B Units 6.19% 222,846
Deferred unit-based compensation 6.19% 3,178
Unitholders' equity
Boardwalk REIT Units 6.19% 3,209,180
Total 5.82% 3,816,620
2017 F
Cost of Capital
Number of Iteration 100000
Minimun $38.76
Maximum $53.13
Mean $45.45
Skewness 0.094
Kurtosis (0.62)
Median 45.38
% of Simulation Above $48.67 16.23%
% of Simulation Bbove $48.67 83.77%
Std. Dev. $3.04
Mean - 2 Std. Dev. $39.37
Mean - 1 Std. Dev. $42.41
Mean + 1 Std. Dev. $48.49
Mean + 2 Std. Dev. $51.53
Monte Carlo Summary Statistics
The EBITDA margin of Boardwalk were relatively high over the last 5 years from 2012
to 2016, it means that the Trust had a higher profitability in the industry. Even
though in 2016, the margin dropped a little bit because of the softening market and
the unexpected disaster in Alberta, the marginal still kept in a comparably high level.
 Interest coverage ratio (ICR)
The interest coverage ratio, measured as Earnings before Interest, Taxes,
Depreciation, and Amortization (EBITDA) to interest expense (excluding gains) for
the current year. The ratios for the last 5 years from 2012 to 2016 were 2.76, 3.15,
3.37, 3.64 and 3.14 respectively. By comparing with other three competitors in the
same industry (Figure 28), I found that Boardwalk had a quite high interest coverage
ratio, which means Boardwalk could cover its interest-related expenses better.
 Cost of capital
The Trust’s cost of capital is generally defined as its weighted average cost of raising
incremental capital and, thus, its hurdle rate for evaluating incremental investment
opportunities. The Trust currently has access to a lower cost of debt through its
access to the NHA insured market. However, even this market has different levels of
risk that are mainly priced through the term selected on the related mortgage. That
is, the longer the mortgage finance term, the longer the borrower is removing the
interest rate risk from the investment. As of February 2017, estimated CMHC-insured
five and ten-year mortgage rates were estimated to be 2.00% and 2.70%
respectively. Hence, using the weighted average method, I would assume the
mortgage rate was about 2.47% for 2017.
The other major component in the cost of capital relates to the marginal cost of
equity required for the investment. The determination of this cost has a number of
different models and definitions. However, for simplicity purposes, Boardwalk
determines its current cost of equity as the amount of AFFO reported compared to
its current market capitalization. For 2017, the FFO per Unit is predicted to be 2.66.
When compared to the Trust Unit’s target price of $42.95, as for 2014, this equates
to approximately 6.19% as its cost of equity.
Therefore, the Trust’s weighted average cost of capital was calculated to be 5.82%
(Figure 29).
Sensitivity Analysis — Monte Carol Simulation
To measure the impact of different key factors on the valuation, Monte Carol
simulation was performed under different scenarios and settings. 100,000
simulations were run to forecast the 12-month target price, the result (Figure 30)
showed 57.64% of the simulations below $46.00, supporting a Sell option, 34.34% of
the simulation between $46.00 – $50.00, supporting an On Hold option, 8.02% of the
simulation above $50.00, supporting a Buy option (Figure 31).
Figure 27: Summary of NOI and FFO
Change, Boardwalk 2012 – 2016
Source: Boardwalk REIT Annual Report 2016
Figure 28: Summary of ICR by Company
Source: Boardwalk REIT Annual Report 2016; Yahoo
Finance
Figure 29: Summary of Cost of Capital
Figure 31: Monte Carlo Simulation on 12-Month Target Price
Figure 30: Summary of Monte Carol
Statistics
AppendixA1:BoardwalkIncome
Statement
Asatendof201220132014201520162017F2018F2019F
Rentalrevenue433,205446,626466,435469,209432,140406,212398,087399,282
%YtoYChange4.10%3.10%4.44%0.59%(7.90%)(6.00%)(2.00%)(0.30%)
Ancillaryrentalincome6,6966,9586,8106,9396,7066,7266,7736,801
Totalrentalrevenue439,901453,584473,245476,148438,846412,938404,860406,083
Rentalexpenses
Operatingexpenses87,14389,00293,18094,17297,620100,510103,428105,807
%YtoYChange3.25%2.13%4.69%1.06%3.66%2.96%2.90%2.30%
Utilities39,32142,12147,57246,20044,71143,37143,37743,810
Propertytaxes36,77338,27240,09141,07443,41640,71341,32441,632
Netoperatingincome276,064284,189292,402294,702253,099228,343216,732214,834
StabilizedBuildingNOIGrowth5.10%2.94%2.89%0.79%(14.12%)(9.78%)(5.08%)(0.88%)
Operatingmargin62.76%62.65%61.79%61.89%57.67%55.30%53.53%52.90%
Financingcosts98,06288,81891,97785,37079,77476,86973,54976,731
Administration28,90932,20233,73233,40733,94733,32233,60233,570
Depreciationandamortization10,92211,92011,9339,64910,07910,76010,82610,870
Profitfromcontinuingoperationsbeforetheundernoted138,171151,249154,760166,276129,299107,39398,75593,664
(Loss)gainonsaleofassets135(235)(6,855)----
Fairvaluegains(losses)549,986174,42481,126130,361(186,681)(167,897)(161,646)(149,367)
(Loss)profitfromcontinuingoperationsbeforeincometax/recover688,292325,673235,65129,060(57,382)(60,504)(62,891)(55,703)
Incometaxexpense(recovery)222(538)(41)(212)(58)(125)(194)(126)
profitfromcontinuingoperations688,514325,135235,61028,848(57,440)(60,629)(63,086)(55,829)
profitfromdiscontinuedoperations,netoftax-12,59511,181-----
(Loss)profitfortheyear688,514337,730246,79128,848(57,440)(60,629)(63,086)(55,829)
Othercomprehensiveincome2,8502,1492,4451,014----
Totalcomprehensive(loss)income691,364339,879249,23629,862(57,440)(60,629)(63,086)(55,829)
IncomeStatement
Asatendof201220132014201520162017F2018F2019F
Assets
Non-currentassets
Investmentproperties$5,493,448$5,745,207$5,778,108$5,540,299$5,612,568$5,633,926$5,662,022$5,645,385
Property,plantandequipment20,67723,62526,12429,32024,14724,77925,59925,994
Deferredtaxassets945455378191164156143173
5,515,0705,769,2875,804,6105,569,8105,636,8795,658,8615,687,7645,671,551
Currentassets
Inventories3,2333,5853,5944,0267,2779,11610,72212,135
Prepaidassets3,7924,2094,4935,9659,14812,83617,43321,917
Tradeandotherreceivables2,4614,8197,2465,2305,5024,3594,5474,881
Segregatedtenants’securitydeposits12,09012,70412,13811,79510,70511,85411,83511,875
Cashandcashequivalents138,656131,079139,564237,01699,10290,78394,79093,749
160,232156,396167,035264,032131,734128,948139,327144,556
TotalAssets$5,675,302$5,925,683$5,971,645$5,833,842$5,768,613$5,787,809$5,827,090$5,816,107
Liabilities
Non-currentliabilities
Mortgagespayable$1,922,166$1,790,625$1,702,179$1,973,307$2,091,844$1,866,845$1,891,161$1,885,994
Debentures
LPClassBUnits288,772267,829275,392212,339217,709222,846239,223233,502
Othernon-currentliabilities5,4523,364972-----
Deferredunit-basedcompensation5,3064,8724,5103,7153,2193,1783,1863,268
Deferredtaxliabilities750131743814
Deferredgovernmentgrant2,2836,4366,7756,3976,0196,4076,3996,306
2,223,9862,073,1761,989,8412,195,7752,318,7952,099,2792,139,9772,129,083
Currentliabilities
Mortgagespayable326,010470,787467,320299,140343,822381,416392,497376,839
Deferredunit-basedcompensation3,7653,4533,2502,2182,7623,0902,9552,855
Deferredgovernmentgrant380378378378378378378
Refundabletenants’securitydeposits15,71816,37515,90014,24113,27515,10615,10215,000
Tradeandotherpayables55,72261,990136,968111,35268,26279,36088,45789,753
401,215552,985623,816427,329428,499479,349499,389484,825
TotalLiabilities2,625,2012,626,1612,613,6572,623,1042,747,2942,578,6282,639,3662,613,908
Equity
Unitholders’equity3,050,1013,299,5223,357,9883,210,7383,021,3193,209,1803,187,7243,202,199
TotalEquity3,050,1013,299,5223,357,9883,210,7383,021,3193,209,1803,187,7243,202,199
TotalLiabilitiesandEquity$5,675,302$5,925,683$5,971,645$5,833,842$5,768,613$5,787,809$5,827,090$5,816,107
BalanceSheet
AppendixA2:BoardwalkBalanceSheet
Name, Position,
Municipality of
Residence, and
Age Position Held Principal Occupation
Trustee
Since
Trust and
Deferred Units
Beneficially
Owned or
Controlled and
Market Value
James R. Dewald,
Calgary, Alberta,
57
Independent
Trustee and
Proposed
Trustee
Dean and Associate Professor, Strategy & Global
Management, Haskayne School of Business,
University of Calgary from April 1, 2013 to the
present. Prior positions at the Haskayne School of
Business include Interim Dean, Haskayne School of
Business (September 2012 to April 1, 2013),
Director of Real Estate and Entrepreneurship
Studies (2012), Associate Dean (2009-2012), and
Assistant Professor (2006–2009). Managing
Partner, Peters Dewald Land Company Inc. from
2001 to present; prior thereto, from 2001 until
2004, Principal, Stormpilots Inc.; in 2004, President
and CEO, Storm Creek Properties Inc.; from 1999
until 2000, President, Director and COO,
411HomeNet Group Inc.; from 1996 until 2000,
President, Director and CEO Hopewell Residential
Communities Inc.; from 1994 to 1996, President,
Director and CEO Walker, Newby & Partners Inc.
Dr. Dewald has been a professional engineer since
1981, and obtained his Ph.D. in Management
(specializing in strategy and global management)
from the University of Calgary in 2007. Dr. Dewald
obtained a Master’s of Business Administration
from the University of Alberta in 1984, and a
Bachelor of Sciences degree in engineering from
the University of Alberta in 1979.
10-May-15
16,199 Trust
Units
7,431 Deferred
Units
0.05%
$1,432,910
Gary Goodman
Toronto, Ontario
71
Independent
Trustee and
Proposed
Trustee
Executive Vice-President of Reichmann
International Development Corporation
and International Property Corporation
between December 2007 and June 2010.
Previously, CFO (December 2001 to
November 2006) and President and CEO
(from December 2006 to December 2007)
of IPC US REIT, a TSX listed Real Estate
Investment Trust which was sold to
Behringer Harvard in December 2007 for an
aggregate value of US$1.4 billion.
Prior thereto, Mr. Goodman also served as
a Director and Senior Vice President of
Olympia & York Developments Limited,
a Director of Campeau Corporation,
Trilon Financial Corporation, Huntingdon
Capital Corporation, Catellus Corporation
and Brinco Mining. Mr. Goodman is a
Director of Brightpath Early Learning Inc.
and a member of the Advisory Board of
Vision Opportunity Fund, a limited
partnership which invests in real estate
securities. Mr. Goodman is a Chartered
Accountant (Gold Medalist) and has a
Bachelor of Commerce degree from the
University of Toronto.
May 13,
2009
4,792 Trust
Units
9,597 Deferred
Units
0.03%
$872,546
Appendix A3: Trustees of Boardwalk
Appendix A3 (Cont’d): Trustees of Boardwalk
Name, Position,
Municipality of
Residence, and
Age Position Held Principal Occupation
Trustee
Since
Trust and
Deferred Units
Beneficially
Owned or
Controlled and
Market Value
Arthur L.
Havener, Jr.
St. Louis,
Missouri
47
Independent
Trustee, Lead
Trustee and
Proposed
Trustee
Principal, Stampede Capital LLC, a firm
designed to provide real estate consulting
support to publicly traded real estate
investment trusts and institutional
investors, as well as certain private equity
investment opportunities, from April 2007
to the present. Mr. Havener was a Vice
President of A.G. Edwards and Sons Inc.
from June, 1988 until March, 2007 and
Head of Real Estate research from 2002 to
2007. Mr. Havener obtained a Master’s of
Business Administration from Webster
University in St. Louis, Missouri in 1992
and a Bachelor of Science from University
of Missouri – Columbia in 1989. Mr.
Havener is a graduate of the Directors
Education Program, which is jointly
developed by the Institute of Corporate
Directors and the Rotman School of
Management, University of Toronto. Mr.
Havener is also an Alderman and Chair of
the Finance Committee in the
Municipality of Sunset Hills, Missouri.
May 10,
2007
10,902 Trust
Units
10,370 Deferred
Units
0.04%
$1,289,911
Sam Kolias
Calgary, Alberta
52
Chairman,
Chief
Executive
Officer,
Trustee and
Proposed
Trustee
Executive of the Trust since 1993. Mr.
Kolias obtained a Bachelor of Science in
Civil Engineering in 1983 from the
University of Calgary, and a designation
as a Certified Property Manager from the
Real Estate Institute of Canada in 1995.
Mr. Kolias has been a fellow of the Real
Estate Institute of Canada since 1985.
Prior to July 1993, Mr. Kolias was
President and co-founder of Boardwalk
Equities Inc. (now called BPCL Holdings
Inc.) and President and co-founder of
Boardwalk Properties Co. Ltd.
July
1993
4,337,500 Trust
Units
Nil (0) Deferred
Units
9.05%
$263,026,000
Samantha Kolias
Calgary, Alberta
26
Trustee and
Proposed
Trustee
Controller of BPCL since September
2012. Prior thereto, Senior Accountant at
KPMG LLP, from September 2009 to
August 2012. Prior thereto, Educator at Lululemon
Athletica, from May 2009 to
August 2009, and A/R Trucking
Accountant at Canadian Natural
Resources Ltd., from May 2007 to August
2007. Ms. Kolias is a Chartered
Accountant and has a Bachelor of
Commerce from Queen’s University.
N/A
Nil Trust Units
Nil (0) Deferred
Units
0.0% $Nil
Appendix A3 (Cont’d): Trustees of Boardwalk
Name, Position,
Municipality of
Residence, and
Age Position Held Principal Occupation
Trustee
Since
Trust and
Deferred Units
Beneficially
Owned or
Controlled and
Market Value
Al W. Mawani
Thornhill,
Ontario
62
Independent
Trustee and
Proposed
Trustee
President and CEO, Calloway REIT, from
May 1, 2011 to March 21, 2013; Principal,
Exponent Capital Partners Inc., a real
estate advisory and private equity firm,
from February, 2002 to April 30, 2011,
and was Vice President of the Industrial
Promotion Services unit of the Aga Khan
Fund for Economic Development, another
private equity organization, from May
2001 to February 2004. Prior thereto, Mr.
Mawani was Executive Vice-President of
Business Development for one (1) year,
and Senior Vice-President and Chief
Financial Officer for ten (10) years, at
Oxford Properties Group Inc., one of
Canada’s largest real estate companies.
Mr. Mawani is a Chartered Accountant
and has a Master’s in Business
Administration from the University of
Toronto and a Master’s in Law from York
University.
April 30,
2002
43,483 Trust
Units
8,984 Deferred
Units
0.11%
$3,181,588
Andrea M.
Stephen
Toronto, Ontario
49
Independent
Trustee and
Proposed
Trustee
Senior and then Executive Vice President,
Investments for The Cadillac Fairview
Corporation from May 2000 to December
2011. Prior thereto, Ms. Stephen held
several positions with the Ontario
Teachers' Pension Plan Board from
September 1995 to May 2000. Prior
thereto, Ms. Stephen was Director of
Financial Reporting with Bramalea
Centres from July 1993 to May 1995, and
Audit Manager at KPMG from September
1986 to July 1993. Ms. Stephen served on
Multiplan’s Board of Directors for six (6)
years from 2006 to 2012. She was also a
member of the Pension Real Estate
Association Board of Directors (PREA),
from March 2009 to March 2012. Ms.
Stephen obtained an undergraduate degree
in business from St. Francis Xavier
University in 1986 and became a
Chartered Accountant in 1990. Ms.
Stephen has also been a director of First
Capital Realty Inc. since January 9, 2012
and of the Macerich Company in the
United States, since January 13, 2013.
May 15,
2012
3,500.00 Trust
Units
3,474 Deferred
Units
0.02%
$422,710
References
Boardwalk REIT (2016). 2016 Annual Report of the Boardwalk. Retrieved from
https://www.bwalk.com/en-CA/Investors/GetInvestorDocument/259
Economic Outlook and Fiscal Plan 2017-20. Retrieved from
http://finance.alberta.ca/publications/budget/budget2017/fiscal-plan-economic-
outlook.pdf
Ann-Marie Lurie, 2017 Economic Outlook & Regional Housing Market Forecast. Retrieved
from http://www.creb.com/-/media/Public/Forecast2017/2017ForecastReport.pdf?la=en
Mining and Oil and Gas Extraction, Retrieved from
https://occinfo.alis.alberta.ca/occinfopreview/industries/mining-and-oil-and-gas-
extraction.aspx
Highlights of Albert Economy 2017. Retrieved from
http://www.albertacanada.com/files/albertacanada/SP-
EH_highlightsABEconomyPresentation.pdf
Boardwalk REIT. (BEI-UN.TO) (2017). Profile, business summary. Yahoo!Finance. Retrieved
from https://ca.finance.yahoo.com/quote/BEI-UN.TO?p=BEI-UN.TO
Canadian Apartment Properties REIT. (CAR-UN.TO) (2017). Profile, business
summary. Yahoo!Finance. Retrieved from https://ca.finance.yahoo.com/quote/CAR-
UN.TO?p=CAR-UN.TO
Northview Apartment Properties REIT. (NVU-UN.TO) (2017). Profile, business
summary. Yahoo!Finance. Retrieved from https://ca.finance.yahoo.com/quote/NVU-
UN.TO/?p=NVU-UN.TO
Morguard North American Residential REIT. (MRG-UN.TO) (2017). Profile, business
summary. Yahoo!Finance. https://ca.finance.yahoo.com/quote/MRG-UN.TO/?p=MRG-
UN.TO
Canadian Apartment Properties REIT (2016). 2016 annual report of the Canadian Apartment
Properties REIT. Retrieved from
http://www.snl.com/Cache/1001220547.PDF?O=PDF&T=&Y=&D=&FID=1001220547
&iid=4105050
Northview Apartment Properties REIT (2016). 2016 Annual Financial Report of the Northview
Apartment Properties REIT. Retrieved from
https://s3.amazonaws.com/lws_lift/northview/userfiles/Financials/2016/Northview%2020
16%20Annual%20FS.pdf
Morguard North American Residential REIT (2016). 2016 Annual Report of the Morguard North
American Residential REIT. Retrieved from
http://www.morguard.com/Documents/Morguard%20REIT/Financial%20Reports/MRT_
2016_AR.PDF
Rothschild, M., Roy, N., & Dukesz, Nick. Real Estate Investment Trusts, Retrieved from
http://www.theglobeandmail.com/globe-investor/investment-ideas/research-
reports/article28079098.ece/BINARY/2016+REIT+Outlook.pdf
RioCan REIT and Boardwalk REIT Team Up To Create a Joint Venture To Develop a Mixed
Use Retail and Rental Residential Tower at RioCan's Brentwood Village Shopping
Centre. (2016, November). Retrieved from http://investor.riocan.com/English/investor-
relations/press-releases/press-release-details/2016/RIOCAN-REIT-AND-
BOARDWALK-REIT-TEAM-UP-TO-CREATE-A-JOINT-VENTURE-TO-DEVELOP-
A-MIXED-USE-RETAIL-AND-RENTAL-RESIDENTIAL-TOWER-AT-RIOCANS-
BRENTWOOD-VILLAGE-SHOPPING-CENTRE/default.aspx

More Related Content

What's hot

Managing Abu Dhabi's $627 Billion Sovereign Wealth Fund (ADIA), Presentation ...
Managing Abu Dhabi's $627 Billion Sovereign Wealth Fund (ADIA), Presentation ...Managing Abu Dhabi's $627 Billion Sovereign Wealth Fund (ADIA), Presentation ...
Managing Abu Dhabi's $627 Billion Sovereign Wealth Fund (ADIA), Presentation ...Aaron Beydoun
 
marshall & llsley corp annual reports 2005
marshall  & llsley corp annual reports 2005marshall  & llsley corp annual reports 2005
marshall & llsley corp annual reports 2005finance36
 
Corporate Presentation – June 2008
Corporate Presentation – June 2008Corporate Presentation – June 2008
Corporate Presentation – June 2008RiRossi
 
Aveda energy investor presentation september 2013
Aveda energy investor presentation september  2013Aveda energy investor presentation september  2013
Aveda energy investor presentation september 2013AvedaEnergy
 
3Q18 Fixed Income Final
3Q18 Fixed Income Final3Q18 Fixed Income Final
3Q18 Fixed Income FinalWelltower
 
Nicola Wealth Real Estate: Midyear Update & Opportunities Ahead
Nicola Wealth Real Estate: Midyear Update & Opportunities AheadNicola Wealth Real Estate: Midyear Update & Opportunities Ahead
Nicola Wealth Real Estate: Midyear Update & Opportunities AheadNicola Wealth
 
January Investor Presentation
January Investor Presentation January Investor Presentation
January Investor Presentation SandRidgeIR
 
Third Point Reinsurance Ltd. Investor Presentation
Third Point Reinsurance Ltd. Investor PresentationThird Point Reinsurance Ltd. Investor Presentation
Third Point Reinsurance Ltd. Investor Presentationirthirdpointre
 
1609 fun investor presentation
1609 fun investor presentation1609 fun investor presentation
1609 fun investor presentationcedarfair
 
Management Investor Presentation - Q2 2014
Management Investor Presentation - Q2 2014Management Investor Presentation - Q2 2014
Management Investor Presentation - Q2 2014RioCan
 
Mercer Capital's Value Focus: Auto Dealer Industry | Data as of Mid-Year 2020
Mercer Capital's Value Focus: Auto Dealer Industry | Data as of Mid-Year 2020Mercer Capital's Value Focus: Auto Dealer Industry | Data as of Mid-Year 2020
Mercer Capital's Value Focus: Auto Dealer Industry | Data as of Mid-Year 2020Mercer Capital
 
MIC.CN Stock Pitch
MIC.CN Stock PitchMIC.CN Stock Pitch
MIC.CN Stock PitchR Young
 
Repsol: General Shareholders Meeting 2014
Repsol: General Shareholders Meeting 2014Repsol: General Shareholders Meeting 2014
Repsol: General Shareholders Meeting 2014Repsol
 

What's hot (20)

Managing Abu Dhabi's $627 Billion Sovereign Wealth Fund (ADIA), Presentation ...
Managing Abu Dhabi's $627 Billion Sovereign Wealth Fund (ADIA), Presentation ...Managing Abu Dhabi's $627 Billion Sovereign Wealth Fund (ADIA), Presentation ...
Managing Abu Dhabi's $627 Billion Sovereign Wealth Fund (ADIA), Presentation ...
 
marshall & llsley corp annual reports 2005
marshall  & llsley corp annual reports 2005marshall  & llsley corp annual reports 2005
marshall & llsley corp annual reports 2005
 
Corporate Presentation – June 2008
Corporate Presentation – June 2008Corporate Presentation – June 2008
Corporate Presentation – June 2008
 
May Investor Presentation
May Investor PresentationMay Investor Presentation
May Investor Presentation
 
May Investor Presentation
May Investor PresentationMay Investor Presentation
May Investor Presentation
 
Aveda energy investor presentation september 2013
Aveda energy investor presentation september  2013Aveda energy investor presentation september  2013
Aveda energy investor presentation september 2013
 
3Q18 Fixed Income Final
3Q18 Fixed Income Final3Q18 Fixed Income Final
3Q18 Fixed Income Final
 
FREEMAN final
FREEMAN  finalFREEMAN  final
FREEMAN final
 
Nicola Wealth Real Estate: Midyear Update & Opportunities Ahead
Nicola Wealth Real Estate: Midyear Update & Opportunities AheadNicola Wealth Real Estate: Midyear Update & Opportunities Ahead
Nicola Wealth Real Estate: Midyear Update & Opportunities Ahead
 
Cabo Corporate Presentation
Cabo Corporate PresentationCabo Corporate Presentation
Cabo Corporate Presentation
 
January Investor Presentation
January Investor Presentation January Investor Presentation
January Investor Presentation
 
Third Point Reinsurance Ltd. Investor Presentation
Third Point Reinsurance Ltd. Investor PresentationThird Point Reinsurance Ltd. Investor Presentation
Third Point Reinsurance Ltd. Investor Presentation
 
1609 fun investor presentation
1609 fun investor presentation1609 fun investor presentation
1609 fun investor presentation
 
Lehman brothers
Lehman brothersLehman brothers
Lehman brothers
 
Management Investor Presentation - Q2 2014
Management Investor Presentation - Q2 2014Management Investor Presentation - Q2 2014
Management Investor Presentation - Q2 2014
 
Mercer Capital's Value Focus: Auto Dealer Industry | Data as of Mid-Year 2020
Mercer Capital's Value Focus: Auto Dealer Industry | Data as of Mid-Year 2020Mercer Capital's Value Focus: Auto Dealer Industry | Data as of Mid-Year 2020
Mercer Capital's Value Focus: Auto Dealer Industry | Data as of Mid-Year 2020
 
October Investor Presentation
October Investor PresentationOctober Investor Presentation
October Investor Presentation
 
Lehman Brothers Annual Report 2007
Lehman Brothers Annual Report 2007Lehman Brothers Annual Report 2007
Lehman Brothers Annual Report 2007
 
MIC.CN Stock Pitch
MIC.CN Stock PitchMIC.CN Stock Pitch
MIC.CN Stock Pitch
 
Repsol: General Shareholders Meeting 2014
Repsol: General Shareholders Meeting 2014Repsol: General Shareholders Meeting 2014
Repsol: General Shareholders Meeting 2014
 

Similar to Boardwalk REIT Investment Recommedation Project

Banc 2016 - Investor Presentation
Banc 2016 - Investor PresentationBanc 2016 - Investor Presentation
Banc 2016 - Investor PresentationBancofCalifornia
 
Banc 2016 - Third Quarter Investor Presentation
Banc 2016 - Third Quarter Investor PresentationBanc 2016 - Third Quarter Investor Presentation
Banc 2016 - Third Quarter Investor PresentationBancofCalifornia
 
Treasury Presentation
Treasury PresentationTreasury Presentation
Treasury PresentationFaisal Rajeh
 
Banc 2016 First Quarter Earnings - Investor Presentation
Banc 2016 First Quarter Earnings - Investor PresentationBanc 2016 First Quarter Earnings - Investor Presentation
Banc 2016 First Quarter Earnings - Investor PresentationBancofCalifornia
 
Bladex 4Q23 Earning Results Presentation
Bladex 4Q23 Earning Results PresentationBladex 4Q23 Earning Results Presentation
Bladex 4Q23 Earning Results PresentationBladex
 
IDFC Dynamic Equity Fund_Fund spotlight
IDFC Dynamic Equity Fund_Fund spotlightIDFC Dynamic Equity Fund_Fund spotlight
IDFC Dynamic Equity Fund_Fund spotlightJubiIdfcHybrid
 
IDFC Dynamic Equity Fund_Fund spotlight
IDFC Dynamic Equity Fund_Fund spotlightIDFC Dynamic Equity Fund_Fund spotlight
IDFC Dynamic Equity Fund_Fund spotlightJubiIdfcHybrid
 
Mercer Capital's Business Development Companies Quarterly Newsletter | Q1 2015
Mercer Capital's Business Development Companies Quarterly Newsletter | Q1 2015Mercer Capital's Business Development Companies Quarterly Newsletter | Q1 2015
Mercer Capital's Business Development Companies Quarterly Newsletter | Q1 2015Mercer Capital
 
Banc 2016 Second Quarter Earnings - Investor Presentation
Banc 2016 Second Quarter Earnings - Investor PresentationBanc 2016 Second Quarter Earnings - Investor Presentation
Banc 2016 Second Quarter Earnings - Investor PresentationBancofCalifornia
 
Mercer Capital's Bank Watch | October 2020 | Low Rates and Tighter NIMs Spur ...
Mercer Capital's Bank Watch | October 2020 | Low Rates and Tighter NIMs Spur ...Mercer Capital's Bank Watch | October 2020 | Low Rates and Tighter NIMs Spur ...
Mercer Capital's Bank Watch | October 2020 | Low Rates and Tighter NIMs Spur ...Mercer Capital
 
Earnings 4Q15 Presentation
Earnings 4Q15 PresentationEarnings 4Q15 Presentation
Earnings 4Q15 Presentationir_digitalrealty
 
Capital return-announcement-with-non-gaaps
Capital return-announcement-with-non-gaapsCapital return-announcement-with-non-gaaps
Capital return-announcement-with-non-gaapsDelta_Airlines
 
Cedar Point Analyst Day
Cedar Point Analyst DayCedar Point Analyst Day
Cedar Point Analyst Daycedarfair
 

Similar to Boardwalk REIT Investment Recommedation Project (20)

Banc 2016 - Investor Presentation
Banc 2016 - Investor PresentationBanc 2016 - Investor Presentation
Banc 2016 - Investor Presentation
 
Banc 2016 - Third Quarter Investor Presentation
Banc 2016 - Third Quarter Investor PresentationBanc 2016 - Third Quarter Investor Presentation
Banc 2016 - Third Quarter Investor Presentation
 
Economic Overview
Economic OverviewEconomic Overview
Economic Overview
 
Treasury Presentation
Treasury PresentationTreasury Presentation
Treasury Presentation
 
Banc 2016 First Quarter Earnings - Investor Presentation
Banc 2016 First Quarter Earnings - Investor PresentationBanc 2016 First Quarter Earnings - Investor Presentation
Banc 2016 First Quarter Earnings - Investor Presentation
 
September Investor Presentation
September Investor PresentationSeptember Investor Presentation
September Investor Presentation
 
Bladex 4Q23 Earning Results Presentation
Bladex 4Q23 Earning Results PresentationBladex 4Q23 Earning Results Presentation
Bladex 4Q23 Earning Results Presentation
 
IDFC Dynamic Equity Fund_Fund spotlight
IDFC Dynamic Equity Fund_Fund spotlightIDFC Dynamic Equity Fund_Fund spotlight
IDFC Dynamic Equity Fund_Fund spotlight
 
IDFC Dynamic Equity Fund_Fund spotlight
IDFC Dynamic Equity Fund_Fund spotlightIDFC Dynamic Equity Fund_Fund spotlight
IDFC Dynamic Equity Fund_Fund spotlight
 
Mercer Capital's Business Development Companies Quarterly Newsletter | Q1 2015
Mercer Capital's Business Development Companies Quarterly Newsletter | Q1 2015Mercer Capital's Business Development Companies Quarterly Newsletter | Q1 2015
Mercer Capital's Business Development Companies Quarterly Newsletter | Q1 2015
 
Banc 2016 Second Quarter Earnings - Investor Presentation
Banc 2016 Second Quarter Earnings - Investor PresentationBanc 2016 Second Quarter Earnings - Investor Presentation
Banc 2016 Second Quarter Earnings - Investor Presentation
 
June Investor Presentation
June Investor PresentationJune Investor Presentation
June Investor Presentation
 
Mercer Capital's Bank Watch | October 2020 | Low Rates and Tighter NIMs Spur ...
Mercer Capital's Bank Watch | October 2020 | Low Rates and Tighter NIMs Spur ...Mercer Capital's Bank Watch | October 2020 | Low Rates and Tighter NIMs Spur ...
Mercer Capital's Bank Watch | October 2020 | Low Rates and Tighter NIMs Spur ...
 
Earnings 4Q15 Presentation
Earnings 4Q15 PresentationEarnings 4Q15 Presentation
Earnings 4Q15 Presentation
 
UBS Global Oil and Gas Conference
UBS Global Oil and Gas ConferenceUBS Global Oil and Gas Conference
UBS Global Oil and Gas Conference
 
Dvn july-2018-investor-presentation
Dvn july-2018-investor-presentationDvn july-2018-investor-presentation
Dvn july-2018-investor-presentation
 
May Investor Presentation
May Investor PresentationMay Investor Presentation
May Investor Presentation
 
Dvn may-2018-investor-presentation
Dvn may-2018-investor-presentationDvn may-2018-investor-presentation
Dvn may-2018-investor-presentation
 
Capital return-announcement-with-non-gaaps
Capital return-announcement-with-non-gaapsCapital return-announcement-with-non-gaaps
Capital return-announcement-with-non-gaaps
 
Cedar Point Analyst Day
Cedar Point Analyst DayCedar Point Analyst Day
Cedar Point Analyst Day
 

Recently uploaded

Instant Issue Debit Cards - School Designs
Instant Issue Debit Cards - School DesignsInstant Issue Debit Cards - School Designs
Instant Issue Debit Cards - School Designsegoetzinger
 
High Class Call Girls Nagpur Grishma Call 7001035870 Meet With Nagpur Escorts
High Class Call Girls Nagpur Grishma Call 7001035870 Meet With Nagpur EscortsHigh Class Call Girls Nagpur Grishma Call 7001035870 Meet With Nagpur Escorts
High Class Call Girls Nagpur Grishma Call 7001035870 Meet With Nagpur Escortsranjana rawat
 
TEST BANK For Corporate Finance, 13th Edition By Stephen Ross, Randolph Weste...
TEST BANK For Corporate Finance, 13th Edition By Stephen Ross, Randolph Weste...TEST BANK For Corporate Finance, 13th Edition By Stephen Ross, Randolph Weste...
TEST BANK For Corporate Finance, 13th Edition By Stephen Ross, Randolph Weste...ssifa0344
 
Dividend Policy and Dividend Decision Theories.pptx
Dividend Policy and Dividend Decision Theories.pptxDividend Policy and Dividend Decision Theories.pptx
Dividend Policy and Dividend Decision Theories.pptxanshikagoel52
 
(DIYA) Bhumkar Chowk Call Girls Just Call 7001035870 [ Cash on Delivery ] Pun...
(DIYA) Bhumkar Chowk Call Girls Just Call 7001035870 [ Cash on Delivery ] Pun...(DIYA) Bhumkar Chowk Call Girls Just Call 7001035870 [ Cash on Delivery ] Pun...
(DIYA) Bhumkar Chowk Call Girls Just Call 7001035870 [ Cash on Delivery ] Pun...ranjana rawat
 
The Economic History of the U.S. Lecture 22.pdf
The Economic History of the U.S. Lecture 22.pdfThe Economic History of the U.S. Lecture 22.pdf
The Economic History of the U.S. Lecture 22.pdfGale Pooley
 
Pooja 9892124323 : Call Girl in Juhu Escorts Service Free Home Delivery
Pooja 9892124323 : Call Girl in Juhu Escorts Service Free Home DeliveryPooja 9892124323 : Call Girl in Juhu Escorts Service Free Home Delivery
Pooja 9892124323 : Call Girl in Juhu Escorts Service Free Home DeliveryPooja Nehwal
 
The Economic History of the U.S. Lecture 23.pdf
The Economic History of the U.S. Lecture 23.pdfThe Economic History of the U.S. Lecture 23.pdf
The Economic History of the U.S. Lecture 23.pdfGale Pooley
 
Andheri Call Girls In 9825968104 Mumbai Hot Models
Andheri Call Girls In 9825968104 Mumbai Hot ModelsAndheri Call Girls In 9825968104 Mumbai Hot Models
Andheri Call Girls In 9825968104 Mumbai Hot Modelshematsharma006
 
Call Girls Service Nagpur Maya Call 7001035870 Meet With Nagpur Escorts
Call Girls Service Nagpur Maya Call 7001035870 Meet With Nagpur EscortsCall Girls Service Nagpur Maya Call 7001035870 Meet With Nagpur Escorts
Call Girls Service Nagpur Maya Call 7001035870 Meet With Nagpur Escortsranjana rawat
 
06_Joeri Van Speybroek_Dell_MeetupDora&Cybersecurity.pdf
06_Joeri Van Speybroek_Dell_MeetupDora&Cybersecurity.pdf06_Joeri Van Speybroek_Dell_MeetupDora&Cybersecurity.pdf
06_Joeri Van Speybroek_Dell_MeetupDora&Cybersecurity.pdfFinTech Belgium
 
Solution Manual for Financial Accounting, 11th Edition by Robert Libby, Patri...
Solution Manual for Financial Accounting, 11th Edition by Robert Libby, Patri...Solution Manual for Financial Accounting, 11th Edition by Robert Libby, Patri...
Solution Manual for Financial Accounting, 11th Edition by Robert Libby, Patri...ssifa0344
 
Solution Manual for Principles of Corporate Finance 14th Edition by Richard B...
Solution Manual for Principles of Corporate Finance 14th Edition by Richard B...Solution Manual for Principles of Corporate Finance 14th Edition by Richard B...
Solution Manual for Principles of Corporate Finance 14th Edition by Richard B...ssifa0344
 
Booking open Available Pune Call Girls Shivane 6297143586 Call Hot Indian Gi...
Booking open Available Pune Call Girls Shivane  6297143586 Call Hot Indian Gi...Booking open Available Pune Call Girls Shivane  6297143586 Call Hot Indian Gi...
Booking open Available Pune Call Girls Shivane 6297143586 Call Hot Indian Gi...Call Girls in Nagpur High Profile
 
20240429 Calibre April 2024 Investor Presentation.pdf
20240429 Calibre April 2024 Investor Presentation.pdf20240429 Calibre April 2024 Investor Presentation.pdf
20240429 Calibre April 2024 Investor Presentation.pdfAdnet Communications
 
The Economic History of the U.S. Lecture 17.pdf
The Economic History of the U.S. Lecture 17.pdfThe Economic History of the U.S. Lecture 17.pdf
The Economic History of the U.S. Lecture 17.pdfGale Pooley
 
03_Emmanuel Ndiaye_Degroof Petercam.pptx
03_Emmanuel Ndiaye_Degroof Petercam.pptx03_Emmanuel Ndiaye_Degroof Petercam.pptx
03_Emmanuel Ndiaye_Degroof Petercam.pptxFinTech Belgium
 
Best VIP Call Girls Noida Sector 18 Call Me: 8448380779
Best VIP Call Girls Noida Sector 18 Call Me: 8448380779Best VIP Call Girls Noida Sector 18 Call Me: 8448380779
Best VIP Call Girls Noida Sector 18 Call Me: 8448380779Delhi Call girls
 
CALL ON ➥8923113531 🔝Call Girls Gomti Nagar Lucknow best sexual service
CALL ON ➥8923113531 🔝Call Girls Gomti Nagar Lucknow best sexual serviceCALL ON ➥8923113531 🔝Call Girls Gomti Nagar Lucknow best sexual service
CALL ON ➥8923113531 🔝Call Girls Gomti Nagar Lucknow best sexual serviceanilsa9823
 
OAT_RI_Ep19 WeighingTheRisks_Apr24_TheYellowMetal.pptx
OAT_RI_Ep19 WeighingTheRisks_Apr24_TheYellowMetal.pptxOAT_RI_Ep19 WeighingTheRisks_Apr24_TheYellowMetal.pptx
OAT_RI_Ep19 WeighingTheRisks_Apr24_TheYellowMetal.pptxhiddenlevers
 

Recently uploaded (20)

Instant Issue Debit Cards - School Designs
Instant Issue Debit Cards - School DesignsInstant Issue Debit Cards - School Designs
Instant Issue Debit Cards - School Designs
 
High Class Call Girls Nagpur Grishma Call 7001035870 Meet With Nagpur Escorts
High Class Call Girls Nagpur Grishma Call 7001035870 Meet With Nagpur EscortsHigh Class Call Girls Nagpur Grishma Call 7001035870 Meet With Nagpur Escorts
High Class Call Girls Nagpur Grishma Call 7001035870 Meet With Nagpur Escorts
 
TEST BANK For Corporate Finance, 13th Edition By Stephen Ross, Randolph Weste...
TEST BANK For Corporate Finance, 13th Edition By Stephen Ross, Randolph Weste...TEST BANK For Corporate Finance, 13th Edition By Stephen Ross, Randolph Weste...
TEST BANK For Corporate Finance, 13th Edition By Stephen Ross, Randolph Weste...
 
Dividend Policy and Dividend Decision Theories.pptx
Dividend Policy and Dividend Decision Theories.pptxDividend Policy and Dividend Decision Theories.pptx
Dividend Policy and Dividend Decision Theories.pptx
 
(DIYA) Bhumkar Chowk Call Girls Just Call 7001035870 [ Cash on Delivery ] Pun...
(DIYA) Bhumkar Chowk Call Girls Just Call 7001035870 [ Cash on Delivery ] Pun...(DIYA) Bhumkar Chowk Call Girls Just Call 7001035870 [ Cash on Delivery ] Pun...
(DIYA) Bhumkar Chowk Call Girls Just Call 7001035870 [ Cash on Delivery ] Pun...
 
The Economic History of the U.S. Lecture 22.pdf
The Economic History of the U.S. Lecture 22.pdfThe Economic History of the U.S. Lecture 22.pdf
The Economic History of the U.S. Lecture 22.pdf
 
Pooja 9892124323 : Call Girl in Juhu Escorts Service Free Home Delivery
Pooja 9892124323 : Call Girl in Juhu Escorts Service Free Home DeliveryPooja 9892124323 : Call Girl in Juhu Escorts Service Free Home Delivery
Pooja 9892124323 : Call Girl in Juhu Escorts Service Free Home Delivery
 
The Economic History of the U.S. Lecture 23.pdf
The Economic History of the U.S. Lecture 23.pdfThe Economic History of the U.S. Lecture 23.pdf
The Economic History of the U.S. Lecture 23.pdf
 
Andheri Call Girls In 9825968104 Mumbai Hot Models
Andheri Call Girls In 9825968104 Mumbai Hot ModelsAndheri Call Girls In 9825968104 Mumbai Hot Models
Andheri Call Girls In 9825968104 Mumbai Hot Models
 
Call Girls Service Nagpur Maya Call 7001035870 Meet With Nagpur Escorts
Call Girls Service Nagpur Maya Call 7001035870 Meet With Nagpur EscortsCall Girls Service Nagpur Maya Call 7001035870 Meet With Nagpur Escorts
Call Girls Service Nagpur Maya Call 7001035870 Meet With Nagpur Escorts
 
06_Joeri Van Speybroek_Dell_MeetupDora&Cybersecurity.pdf
06_Joeri Van Speybroek_Dell_MeetupDora&Cybersecurity.pdf06_Joeri Van Speybroek_Dell_MeetupDora&Cybersecurity.pdf
06_Joeri Van Speybroek_Dell_MeetupDora&Cybersecurity.pdf
 
Solution Manual for Financial Accounting, 11th Edition by Robert Libby, Patri...
Solution Manual for Financial Accounting, 11th Edition by Robert Libby, Patri...Solution Manual for Financial Accounting, 11th Edition by Robert Libby, Patri...
Solution Manual for Financial Accounting, 11th Edition by Robert Libby, Patri...
 
Solution Manual for Principles of Corporate Finance 14th Edition by Richard B...
Solution Manual for Principles of Corporate Finance 14th Edition by Richard B...Solution Manual for Principles of Corporate Finance 14th Edition by Richard B...
Solution Manual for Principles of Corporate Finance 14th Edition by Richard B...
 
Booking open Available Pune Call Girls Shivane 6297143586 Call Hot Indian Gi...
Booking open Available Pune Call Girls Shivane  6297143586 Call Hot Indian Gi...Booking open Available Pune Call Girls Shivane  6297143586 Call Hot Indian Gi...
Booking open Available Pune Call Girls Shivane 6297143586 Call Hot Indian Gi...
 
20240429 Calibre April 2024 Investor Presentation.pdf
20240429 Calibre April 2024 Investor Presentation.pdf20240429 Calibre April 2024 Investor Presentation.pdf
20240429 Calibre April 2024 Investor Presentation.pdf
 
The Economic History of the U.S. Lecture 17.pdf
The Economic History of the U.S. Lecture 17.pdfThe Economic History of the U.S. Lecture 17.pdf
The Economic History of the U.S. Lecture 17.pdf
 
03_Emmanuel Ndiaye_Degroof Petercam.pptx
03_Emmanuel Ndiaye_Degroof Petercam.pptx03_Emmanuel Ndiaye_Degroof Petercam.pptx
03_Emmanuel Ndiaye_Degroof Petercam.pptx
 
Best VIP Call Girls Noida Sector 18 Call Me: 8448380779
Best VIP Call Girls Noida Sector 18 Call Me: 8448380779Best VIP Call Girls Noida Sector 18 Call Me: 8448380779
Best VIP Call Girls Noida Sector 18 Call Me: 8448380779
 
CALL ON ➥8923113531 🔝Call Girls Gomti Nagar Lucknow best sexual service
CALL ON ➥8923113531 🔝Call Girls Gomti Nagar Lucknow best sexual serviceCALL ON ➥8923113531 🔝Call Girls Gomti Nagar Lucknow best sexual service
CALL ON ➥8923113531 🔝Call Girls Gomti Nagar Lucknow best sexual service
 
OAT_RI_Ep19 WeighingTheRisks_Apr24_TheYellowMetal.pptx
OAT_RI_Ep19 WeighingTheRisks_Apr24_TheYellowMetal.pptxOAT_RI_Ep19 WeighingTheRisks_Apr24_TheYellowMetal.pptx
OAT_RI_Ep19 WeighingTheRisks_Apr24_TheYellowMetal.pptx
 

Boardwalk REIT Investment Recommedation Project

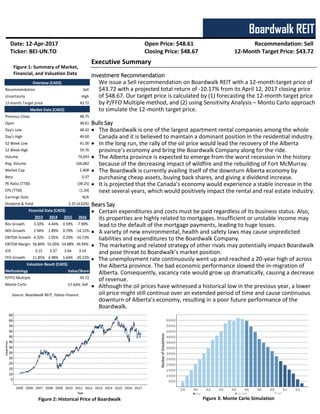
  • 1. Sell High 43.72 48.75 48.61 48.42 49.00 41.00 59.76 74,093 166,682 2.46B 0.37 (39.25) (1.24) N/A 2013 2014 2015 2016 Rev Growth 3.10% 4.44% 0.59% -7.90% NOI Growth 2.94% 2.89% 0.79% -14.12% EBITDA Growth 4.32% 1.05% 0.29% -16.13% EBITDA Margin 56.84% 55.05% 54.88% 49.94% ICR 3.15 3.37 3.64 3.14 FFO Growth 11.85% 4.98% 5.64% -20.22% P/FFO Multiple 43.72 Monte Carlo 45.43 Value/ShareMethodology Market Cap Beta PE Ratio (TTM) EPS (TTM) Earnings Date 2.25 (4.62%)Dividend & Yield Overview (CAD$) Market Data (CAD$) Financial Data (CAD$) Valuation Result (CAD$) Recommendation Uncertainty 12-month Target price Previous Close Open Day's Low Day's High 52 Week Low 52 Week High Volume Avg. Volume Boardwalk REIT Date: 12-Apr-2017 Open Price: $48.61 Recommendation: Sell Ticker: BEI-UN.TO Closing Price: $48.67 12-Month Target Price: $43.72 Executive Summary Investment Recommendation We issue a Sell recommendation on Boardwalk REIT with a 12-month target price of $43.72 with a projected total return of -10.17% from its April 12, 2017 closing price of $48.67. Our target price is calculated by (1) forecasting the 12-month target price by P/FFO Multiple method, and (2) using Sensitivity Analysis – Monto Carlo approach to simulate the 12-month target price. Bulls Say  The Boardwalk is one of the largest apartment rental companies among the whole Canada and it is believed to maintain a dominant position in the residential industry.  In the long run, the rally of the oil price would lead the recovery of the Alberta province’s economy and bring the Boardwalk Company along for the ride.  The Alberta province is expected to emerge from the worst recession in the history because of the decreasing impact of wildfire and the rebuilding of Fort McMurray.  The Boardwalk is currently availing itself of the downturn Alberta economy by purchasing cheap assets, buying back shares, and giving a dividend increase.  It is projected that the Canada’s economy would experience a stable increase in the next several years, which would positively impact the rental and real estate industry. Bears Say  Certain expenditures and costs must be paid regardless of its business status. Also, its properties are highly related to mortgages. Insufficient or unstable income may lead to the default of the mortgage payments, leading to huge losses.  A variety of new environmental, health and safety laws may cause unpredicted liabilities and expenditures to the Boardwalk Company.  The marketing and related strategy of other rivals may potentially impact Boardwalk and pose threat to Boardwalk’s market position.  The unemployment rate continuously went up and reached a 20-year high of across the Alberta province. The bad economic performance slowed the in-migration of Alberta. Consequently, vacancy rate would grow up dramatically, causing a decrease of revenue.  Although the oil prices have witnessed a historical low in the previous year, a lower oil price might still continue over an extended period of time and cause continuous downturn of Alberta’s economy, resulting in a poor future performance of the Boardwalk. Figure 1: Summary of Market, Financial, and Valuation Data Figure 2: Historical Price of Boardwalk Figure 3: Monte Carlo Simulation 57.64% Sell Sell Source: Boardwalk REIT, Yahoo Finance
  • 2. Business Overview Boardwalk REIT Boardwalk REIT is an unincorporated open-ended real estate investment trust established on January 9, 2004. As of December 31, 2016, its portfolio valued around 28,923,950, including over 200 properties, 33,773 residential units within the Provinces of Alberta, Saskatchewan, Ontario and Quebec, representing over 28 million net rentable square feet of revenue producing multi-family residential apartment units (Figure 4). Boardwalk’s properties mainly vary between high-rises, low-rises and townhomes and appeal to a wide demographic of resident members. In November of 2016, Boardwalk announced the formation of joint venture with RioCan REIT to build a 12-storey mixed used tower approximately 120,000 sq.ft of residential and 10,000 sq.ft. of retail space with close proximity to the University of Calgary, Foothills Hospital, and McMahon Stadium (Figure 5). Boardwalk’s principal objectives are to provide its residents with the best quality communities and superior customer service, while providing unitholders with sustainable monthly cash distributions, and increase the value of its trust units through selective acquisitions, dispositions, development, and effective management of its residential multi-family communities. Boardwalk REIT was traded on the Toronto Stock Exchange (“TSX”) under the trading symbol ‘BEI.UN’. From 2011 to 2016, its unit price of the stock fluctuated from 44.04 to 71.40 and its regular monthly distribution varied from 0.15 to 0.1875. The assets were mainly located in Alberta (60.6%), but the company also had assets in Quebec (17.8%), Saskatchewan (13.9%), and Ontario (7.7%) (Figure 6). Unitholders Currently, Boardwalk’s equities are mainly shared by institutions and mutual funds (Figure 8). In respect to shares owned by institutions, the Boardwalk properties Limited, the company itself, holds the largest proportion of shares, accounting for 25.62% of the total shares. Beside the company itself, the top institution holder also includes CIBC Asset Management Inc. (9.60% of the total shares), Sentry Investments (7.47% of the total shares), and TD Asset Management Inc. (3.59% of the total shares) For the shares owned by the mutual funds, Columbia Acorn International Fund Z holds 2.08% of the total shares, ranking it the top one owner in the mutual funds section and followed by the MFS Diversified Income Fund Class A (1.45%) and MFS Global Real Estate Fund Class A (0.90%). Corporate Governance Corporate governance means the process and structure used to direct and manage the business and affairs of the corporation with the objective of enhancing unitholder value, which includes ensuring the financial viability of the business. The process and structure define the division of power and establish mechanisms for achieving accountability among the board of trustees and management for the benefit of the Trust. Boardwalk is committed to adhering to the highest possible standards in its corporate governance practices. As set forth in this Corporate Governance Manual, these practices are designed to assist Boardwalk in achieving its principal stated corporate objectives, which are to: (1) provide unitholders with stable and growing cash distributions, partially, on a Canadian income tax-deferred basis, from investments in its assets, platform and any additional revenue producing multi- family residential properties or interests; and (2) increase trust unit value through the effective management of its residential, multi-family, revenue-producing properties and the acquisition of additional accretive properties or interests therein. Boardwalk believes that in order to enhance unitholder value, on a long term basis, it is advisable to take into account the interests of its other stakeholders. Figure 4: Boardwalk REIT – Residential Units among Canada Figure 5: Brentwood Village Shopping Centre in Calgary Figure 6: Unit Breakdown by Province Source: Annual Report 2016, Boardwalk REIT Source: Development Portfolio Page, RioCan Source: Annual Report 2016, Boardwalk REIT Figure 7: NOI Breakdown by Province Source: Annual Report 2016, Boardwalk REIT
  • 3. Name Type Shares Pct Boardwalk Ltd Inst. 4,475,000 25.62% CIBC Asset Mgmt. Inst. 4,868,713 9.60% Sentry Investments Inst. 3,787,959 7.47% TD Asset Mgmt. Inst. 1,821,223 3.59% Columbia Acorn Int’l Fund 1,053,355 2.08% MFS Diversified Income Fund 733,827 1.45% MFS Global Real Estate Fund 452,678 0.90% The Board of Trustees has established a compensation, governance and nominations committee which regularly reviews exiting Board policies and current pronouncements on recommended “best practices” for corporate governance. The Trust recognizes that proper and effective corporate governance is a significant concern and priority for investors and other stakeholders and, accordingly, the Board of Trustees has instituted a number of procedures and policies in an effort to always improve the overall governance of the Trust. Industry Overview Demand Drivers  Oil price expected to rally from the downturns Alberta’s economy is heavily subjected to the energy industry. In the year 2015, the energy industry contributes large proportion of Alberta’s total GDP (Figure 9). Based on WTI, West Texas Intermediate, there has been a sharp drop in the oil price since the year 2014 (Figure 10). The decrease in the oil price caused a downturn of Alberta’s economy. Consequently, this caused (1) less confidence, lower expectation and higher uncertainty of the future economy, (2) an increasing unemployment rate across the whole Alberta province due to the negative correlation between the WTI and unemployment rate (Figure 11), (3) a decreasing number of net international migration and a negative net interprovincial migration (Figure 21), resulting in less demand in the rental market. The oil price would still stay at a relatively low position despite the fact that the oil price is predicted to rally from its historical low in the following several years.  Unemployment rate of Alberta expected to stay at high level Unemployment rate can directly impact the vacancy rate and the demand in the rental market. It is believed that the vacancy rate is positively related to the unemployment rate because the unemployment and loss of salary income would reduce the intent to rent, causing people to spend a smaller proportion of their money on rental and to choose to rent apartments located in less favourable place. Before year 2015, the unemployment rate was relatively low but there was a continuously increase since 2015 (Figure 11). Currently, the unemployment rate is around 8% provincially and an even higher unemployment rate is witnessed in the major cities of Alberta (Figure 12). The unemployment rate of Alberta is expected to maintenance at a high level at around 8% by 2018, would undoubtedly adversely impact the rental and real estate industry in Alberta.  Long term interest rate decrease with greatly potential The interest rates was low throughout the year 2015 and 2016. As of February 2017, it is suggested that there would be a continuous decrease in long term, namely five and ten-year, mortgage rates. However, the potential impact of the increase of U.S Federal Reserve interest rate should also be taken into consideration. Mortgage rate is a key factor determining people’s preference between rental and real estate purchasing.  Economics performance sturdy nationally Based on the GDP, Canada is believed to be in a sturdy economics condition. The GDP increased stably with a greater average annual growth rate and a smaller standard deviations in the following years when compared to other OECD countries (Figure 20). The sturdy outlook of the Canadian economy would increase the demand of the rental market and positively contribute to the real estate market nationally Figure 9: Economic Diversity 2015, Alberta Province Figure 9: Economic Diversity 2015, Alberta Province Source: Economic Highlights, Highlights of the Alberta Economy 2017 Figure 8: Current Ownership of Boardwalk REIT Source: Boardwalk Ownership, Morningstar Figure 10: West Texas Intermediate Forecast Source: Wall Street Journal and Alberta Energy, f-forecast Figure 11: Alberta Labour Market Indicators Forecast Source: Statistics Canada and Alberta Treasury Board and Finance, f-forecast * The number of people working or looking for work
  • 4. Industry Structure Analysis In order to draw the competitive landscape of the residential REIT industry, it is important to position the industry among the identified rivals, potential entrants, buyers, substitutes, and suppliers that interact and interfere with it. To do so, Porter’s Five Forces concept is the most used by professionals. In addition, the competitor environment is also evaluated through the industry’s dominant economic features such as market size and growth rate, number of rivals, and scope of competitive rivalry.  Threat of new entrants REITs need to raise funds to acquire properties and run operations. Access to such funds is often restricted; hence barriers to entry the industry are high. Moreover, REIT's assets are subject to a variety of federal, state, and local environmental, health and safety laws. Threat of new competitors is initially judged to be weak, existing competitors fight to produce larger profits in the lodging business. Consequently, the threat of new entrants is quite low, a new player would have a great deal of trouble just moving into this industry.  Bargaining power of suppliers. The Residential REIT industry mainly identifies two types of suppliers (a) the construction companies (b) the household suppliers such as decoration companies, furniture, and infrastructure suppliers. Due to quite large and stable construction suppliers, their bargaining power is relatively low. Moreover, residential REITs have a huge range and choice of household suppliers. Overall, the threat of suppliers weakly affects the residential industry.  Bargaining power of buyers: Powerful customers are able to exert pressure to drive down prices, or increase the required quality for the same price, and therefore reduce profits in the industry. Right now the bargaining power of buyers seems pretty high as there seems to be more residential apartments than buyers. The issue of demand and supply, as with any industry, is an important performance indicator for multi-family real estate. In fiscal 2016, Boardwalk REIT reported a year-over-year decrease of 158 basis points in its occupancy rate. A softening in the Western Canadian markets contributed to the overall occupancy rate decrease. Since the vacancy rate may continue to increase in the short run, as the overall economic and market condition is relatively sluggish, would conclude that the bargaining power of buyers is at a high level.  Threat of substitutes The feasible substitute for REIT might be directly investing in real estate, which refers to buy instead of rent. However, given the economic downturns and the slow recovery mode, the threat of substitute in residential REIT business and its impact on profitability of the industry is quite low.  Rivalry among existing competitors There is a moderate competitive rivalry right now. Each segment of the real estate business is competitive. Numerous other residential developers and apartment owners compete in seeking tenants. Although Boardwalk is one of the largest residential REIT and its strategy is to own multi-family properties in premier locations in each market in which it operates, some of the apartments of its competitors may be newer, better located or better capitalized. The existence of alternative housing could have a material adverse effect on Boardwalk’s ability to lease space in its properties and on the rents charged or concessions granted, and could adversely affect Boardwalk REIT’s revenues and its ability to meet its obligations. Figure 12: Calgary CMA Full and Part Time Employment Source: Labour Market Indicators, Statistics Canada Figure 13: Calgary CMA Employment Growth Source: Conference Board of Canada Forecast, Statistics Canada Figure 14: Alberta Average Weekly Earnings Source: Labour Market Indicators, Statistics Canada Figure 15: Year-over-year Change in Alberta Average Resale Price and Rented Accommodation CPI Source: Canadian Real Estate Association, Statistics Canada
  • 5. Three major competitors for boardwalk are, 1. Canadian Apartment Properties REIT (“CAPREIT”) CAPREIT (Figure 16) was founded in 1997 and is headquartered in Toronto, Canada. It operates as an open-end real estate investment trust, and owns more than 41,000 apartment and townhouse units as well as 6,400 land lease sites in 31 different mobile home parks. It has 52% of properties located in Ontario with another 21% in Quebec. And it plans to build approximately 9,300 new apartment suites. Shares currently trade at $33.52 each, which reaches to a 52-week and five-year high. The REIT’s market cap is $4.3 billion. CAPREIT has a debt-to-net-assets ratio of 44.65, and a P/FFO ratio of 18.377. And CAPREIT pays investors 10.41 cents per month for each share owned, which is a 3.9% yield. The dividend has also been hiked four times in the last five years. The payout ratio is slightly lower than Boardwalk’s, coming in at 70 %. 2. Northview Apartment REIT(“Northview”) Northview (Figure 17) is an unincorporated, open-ended real estate investment trust. Northview is Canada’s third largest publicly traded multi-family residential real estate investor and operator, providing a broad spectrum of rental accommodations with a portfolio of approximately 24,000 quality residential suites in more than 60 markets across eight provinces and two territories. While its portfolio consists primarily of multi-family residential property, including apartments, townhomes and single family apartment buildings. Northview’s shares currently traded at $22.56 for each, approaching to a 52-week high, and its market cap is $1.13 billion. The diluted FFO per unit of $2.21 for the year ended December 31, 2016, and a P/FFO ratio of about 9.95. The payout ratio is 74.1% for 2016. 3. Morguard North American Residential REIT (“Morguard”) Morguard North American Residential REIT (Figure 18) is an open-end real estate investment trust. The REIT was formed to own a diversified portfolio of multi-suite residential rental properties across Canada and the U.S. Its primary objectives are: to generate stable and growing cash distributions to Unitholders on a tax-efficient basis; to enhance the value of its portfolio and the long-term value of its units through active asset and property management; and to expand the REIT's asset base, primarily through acquisitions and property improvements. Following its Initial Public Offering ("IPO") in April 2012, the REIT has doubled its portfolio size to 13,215 suites at 46 multi-suite residential properties in North America. The real estate portfolio consists of 31 U.S. low-rise and mid-rise apartment communities and 15 Canadian residential apartment communities located in Alberta and Ontario. It had total assets of $2.2 billion at December 31, 2016. Morguard’s shares currently traded at C$15.12 for each, almost reaching to a 52- week high, and its market cap now is $0.593 billion. The diluted FFO per unit of $1.20 for the year ended December 31, 2016, with a P/FFO ratio of about 12.177. The payout ratio is 49% for 2016. Sum-of-the-Parts Summary  Low-level Force: threat of new entrants; bargaining power of suppliers; threat of substitutes  Medium-level Force: rivalry among existing competitors  High-level Force: bargaining power of buyers Previous Close 33.58 Open 33.64 Day's Low 33.49 Day's High 33.77 52 Week Low 28.14 52 Week High 33.78 Volume 126729 Avg. Volume 236466 Market Cap 4.53B Beta (0.07) PE Ratio (TTM) 10.18 EPS (TTM) 3.32 Earnings Date N/A Dividend & Yield 1.28 (3.81%) FFO 1.71 P/ FFO 18.38 Market/Financial Data ($CAD) Figure 16: Summary of Market, Financial Data, CAPREIT Source: Canadian Apartment Properties REIT, Yahoo Finance Previous Close 22.56 Open 22.48 Day's Low 22.36 Day's High 22.54 52 Week Low 18.43 52 Week High 22.54 Volume 170664 Avg. Volume 84585 Market Cap 1.12B Beta 1.09 PE Ratio (TTM) 15.68 EPS (TTM) 1.44 Earnings Date N/A Dividend & Yield 1.63 (7.22%) FFO 2.14 P/ FFO 10.52 Market/Financial Data ($CAD) Figure 17: Summary of Market, Financial Data, Northview Source: Northview Apartment REIT, Yahoo Finance Previous Close 15.12 Open 15.10 Day's Low 15.05 Day's High 15.30 52 Week Low 11.63 52 Week High 15.30 Volume 15042 Avg. Volume 42032 Market Cap 776.06M Beta 0.45 PE Ratio (TTM) 26.29 EPS (TTM) 0.58 Earnings Date N/A Dividend & Yield 0.64 (4.23%) FFO 1.20 P/ FFO 11.35 Market/Financial Data ($CAD) Figure 18: Summary of Market, Financial Data, Morguard Source: Morguard North American Residential REIT, Yahoo Finance
  • 6. Investment Summary Investment Drivers  Boardwalk expected to benefit from the recovery of the Alberta economy Since Boardwalk is a Canadian apartment rental company and has the largest portion of business in Alberta, the rally of the Alberta economy would decrease the unemployment rate and allow people to choose more desirable apartment to rent and to spend more on the their rental (Figure 19). Boardwalk is expected to benefit from the lower unemployment rate and greater household income of the Alberta residents.  Boardwalk stay dominant in the residential rental industry Boardwalk is believed to remain dominant and hold a stable market share in the apartment rental industry. The steady development of Boardwalk in recent years has made itself a reliable brand in the rental industry.  Boardwalk’s strategic management methods The company is taking the advantage of downturn of Alberta’s economy by purchasing cheap assets, buying back shares, and giving investors a dividend increase. Also, the Boardwalk, itself, is the largest holder of the equities, which would undoubtedly reliability of the trust.  Slow rally with historical high vacancy rate Though it is suggested that the Boardwalk is going to benefit from the recovery of Alberta’s economic recovery, it should not be neglected that, in the short run, the unemployment rate and vacancy would still stay in a historical high level because the slow recovery process (Figure 22). To some extent, the company would still suffer for a certain time due to this slow recovery process. Investment risk  Limited liquidity and mortgage liability Certain expenditures and costs must be paid regardless of its business status. Boardwalk’s properties are highly related to mortgages. Insufficient or unstable income may lead to the default of the mortgage payments, leading to a huge losses to the company. Also, the illiquid of the Real estate would limit Boardwalk’s ability to vary our portfolio promptly in response to changing economic or investment conditions.  Government laws and regulations Boardwalk, as one of the company in the real estate industry, is committed to obey the related Canadian laws and regulations regarding to real estate and environment. The potential future laws and regulations may encumber Boardwalk with unpredicted liability and corresponding costs.  Entrance/Expansion of Competitors Although the Boardwalk tried to attract tenants by using different marketing strategies, the existence of the other similar companies and alternative housing can negatively impact Boardwalk’s profits by offering lower prices to seize the market share.  Dividends and related cash distributions Boardwalk announced to continuously make distribution, but the real amount of the distributions heavily relies on many factors. The distributions may be greater than Boardwalk’s available cash because of some uncontrollable factors or unpredicted changes in some factors. Figure 20: Canada GDP Growth Projection Figure 19: Alberta GDP Growth Projection Source: Statistics Canada and Alberta Treasury Board and Finance, e-estimate, f-forecast Source: Canada Economy Forecast, OECD Forecast Figure 21: Alberta Natural Increase and Immigration Drive Population Projection Source: Change in the Alberta Population by Component, Statistics Canada and Alberta Treasury Board and Finance, f-forecast Figure 22: Historical Alberta Vacancy Rate Source: Boardwalk REIT Annual Report 2016
  • 7. Market Cap Weights P/FFO Company Name CAPREIT 4.53B 51.04% 18.38 Northview REIT 1.12B 12.62% 10.52 Morguard REIT 776.06M 8.63% 11.35 Boardwalk REIT 2.46B 27.71% 17.13 Weighted Average 16.43 Comparable Companies-P/FFO Multiple (2016) 2017F (Loss) profit for the year (60,629) Adjustments - Loss on sale of assets - Fair value losses 167,897 Add back distributions to LP Class B Units recorded as financing charges 9,224 Deferred income tax expense 33 Depreciation expense on Property Plant & Equip. 6,456 Funds from operations 122,980 Units 46,263 Funds from operations – per Unit 2.66 Boardwalk FFO Estimate FFO estimated for 2017 2.66 Comparable P/FFO multiple 16.43 Implied 12-month Target price 43.72 Valuation Summary As at end of 2012 2013 2014 2015 2016 Rental Revenue 433,205 446,626 466,435 469,209 432,140 Revenue Growth 0.51% 3.10% 4.44% 0.59% -7.90% Total Revenue 439,901 453,584 473,245 476,148 438,846 Net operating income 276,064 284,189 292,402 294,702 253,099 NOI Growth 5.10% 2.94% 2.89% 0.79% -14.12% Administration expense (28909) (26362) (31871) (33407) (33947) Con. EBITDA 247,155 257,827 260,531 261,295 219,152 EBITDA Growth - 4.32% 1.05% 0.29% -16.13% EBITDA margin 56.18% 56.84% 55.05% 54.88% 49.94% Con. interest expense 89,649 81,813 77,341 71,766 69,784 Interest coverage ratio 2.76 3.15 3.37 3.64 3.14 NAV 2,845,021 3,082,664 3,214,498 3,459,536 2,680,206 Financial Analysis  Long-term downturn of the Economy of Alberta The oil price greatly dropped in the recent years and resulted the downturn of the economy of Alberta. The long-term downturn and unpromising expectation of the economy of Alberta is likely to depress the economy further and increase the unemployment rate and vacancy rate. Valuations Valuation Methodology To value Boardwalk REIT, I used a relative valuation approach. The trading multiples analysis is appropriate to value REIT due to the comparable set of other public competitors. The selected competitors were deemed comparable on the basis of their business model (Residential REITs) and market capitalization. I valued Boardwalk REIT using the P / FFO multiple. P / FFO was selected since (1) Multiples of earnings measures of this kind are widely accepted in evaluating shares across global stock markets and industries, and (2) FFO estimates are readily available through market data providers, such as Bloomberg and Thomson Reuters, which facilitates calculating P/FFO multiples.  Valuation summary I collected the three competitors’ P/FFO multiple of 2016, and gave different weights to them based on each company’s market cap. Hence, I got a comparable industry P/FFO multiple as 16.43 (Figure 23). Meanwhile, I forecasted the FFO of 2017 would be 2.66 according to reasonable analysis (Figure 24). Hence, this implies a 12-month target price of 43.72 (Figure 25). Financial Analysis  Rental revenue growth (Figure 26) As with all real estate rental operators, Boardwalk REIT’s financial performance is sensitive to occupancy rates. As previously mentioned, given a softening of the rental markets, particularly in Alberta and Saskatchewan, and the impact uncertainty resulting from lower oil prices, Boardwalk still need time to get recovered from the downturn. Even though, it focus is on maintaining and increasing, in certain regions, occupancy in the short term by offering various suite specific incentives in exchange for longer-term leases. Hence, I would predict the rental revenue growth continued to be negative in 2017 and 2018. And since the oil price is estimated to get back to a relatively stable level, the rental revenue growth may then turn into positive.  Net operating income and funds from operating (Figure 27) The Trust is estimating a slowing of NOI and decline in FFO as the rental market begins to rebalance. In 2017, it is anticipated that negative NOI and FFO growth would be witnessed as the Trust carries the additional vacancy from 2016, and begins 2017 with a lower revenue base than it had at the beginning of 2016. I predicted the NOI growth for the following 3 years would be -11.71%, -5.8% and - 1.74%, respectively. By investing in the newest communities and developments, the Trust has positioned itself to improve its portfolio which may allow Boardwalk to recover for the following years.  Consolidated EBITDA margin (Figure 26) EBITDA margin is a measurement of a company's operating profitability as a percentage of its total revenue. It is equal to earnings before interest, tax, depreciation and amortization (EBITDA) divided by total revenue. Because EBITDA excludes interest, depreciation, amortization and taxes, EBITDA margin can provide an investor, business owner or financial professional with a clear view of a company's operating profitability and cash flow. Figure 23: P/FFO Multiple Summary, 2016 Source: Boardwalk REIT Annual Report 2016; Yahoo Finance Figure 24: Boardwalk FFO Projection 2017 Figure 25: Valuation Result, 12-month Target Price Source: Boardwalk REIT Annual Report 2016 Figure 26: Summary of Financial Analysis, Boardwalk 2012 – 2016
  • 8. 2012 2013 2014 2015 2016 Net operating income 276,064 284,189 292,402 294,702 253,099 % Y to Y Growth 5.10% 2.94% 2.89% 0.79% -14.12% FFO per unit 2.87 3.21 3.37 3.56 2.84 % Y to Y change 13.89% 11.85% 4.98% 5.64% -20.22% NOI and FFO change Liabilities Cost of Capital Predict Value Mortgages payable 2.47% 381,416 LP Class B Units 6.19% 222,846 Deferred unit-based compensation 6.19% 3,178 Unitholders' equity Boardwalk REIT Units 6.19% 3,209,180 Total 5.82% 3,816,620 2017 F Cost of Capital Number of Iteration 100000 Minimun $38.76 Maximum $53.13 Mean $45.45 Skewness 0.094 Kurtosis (0.62) Median 45.38 % of Simulation Above $48.67 16.23% % of Simulation Bbove $48.67 83.77% Std. Dev. $3.04 Mean - 2 Std. Dev. $39.37 Mean - 1 Std. Dev. $42.41 Mean + 1 Std. Dev. $48.49 Mean + 2 Std. Dev. $51.53 Monte Carlo Summary Statistics The EBITDA margin of Boardwalk were relatively high over the last 5 years from 2012 to 2016, it means that the Trust had a higher profitability in the industry. Even though in 2016, the margin dropped a little bit because of the softening market and the unexpected disaster in Alberta, the marginal still kept in a comparably high level.  Interest coverage ratio (ICR) The interest coverage ratio, measured as Earnings before Interest, Taxes, Depreciation, and Amortization (EBITDA) to interest expense (excluding gains) for the current year. The ratios for the last 5 years from 2012 to 2016 were 2.76, 3.15, 3.37, 3.64 and 3.14 respectively. By comparing with other three competitors in the same industry (Figure 28), I found that Boardwalk had a quite high interest coverage ratio, which means Boardwalk could cover its interest-related expenses better.  Cost of capital The Trust’s cost of capital is generally defined as its weighted average cost of raising incremental capital and, thus, its hurdle rate for evaluating incremental investment opportunities. The Trust currently has access to a lower cost of debt through its access to the NHA insured market. However, even this market has different levels of risk that are mainly priced through the term selected on the related mortgage. That is, the longer the mortgage finance term, the longer the borrower is removing the interest rate risk from the investment. As of February 2017, estimated CMHC-insured five and ten-year mortgage rates were estimated to be 2.00% and 2.70% respectively. Hence, using the weighted average method, I would assume the mortgage rate was about 2.47% for 2017. The other major component in the cost of capital relates to the marginal cost of equity required for the investment. The determination of this cost has a number of different models and definitions. However, for simplicity purposes, Boardwalk determines its current cost of equity as the amount of AFFO reported compared to its current market capitalization. For 2017, the FFO per Unit is predicted to be 2.66. When compared to the Trust Unit’s target price of $42.95, as for 2014, this equates to approximately 6.19% as its cost of equity. Therefore, the Trust’s weighted average cost of capital was calculated to be 5.82% (Figure 29). Sensitivity Analysis — Monte Carol Simulation To measure the impact of different key factors on the valuation, Monte Carol simulation was performed under different scenarios and settings. 100,000 simulations were run to forecast the 12-month target price, the result (Figure 30) showed 57.64% of the simulations below $46.00, supporting a Sell option, 34.34% of the simulation between $46.00 – $50.00, supporting an On Hold option, 8.02% of the simulation above $50.00, supporting a Buy option (Figure 31). Figure 27: Summary of NOI and FFO Change, Boardwalk 2012 – 2016 Source: Boardwalk REIT Annual Report 2016 Figure 28: Summary of ICR by Company Source: Boardwalk REIT Annual Report 2016; Yahoo Finance Figure 29: Summary of Cost of Capital Figure 31: Monte Carlo Simulation on 12-Month Target Price Figure 30: Summary of Monte Carol Statistics
  • 9. AppendixA1:BoardwalkIncome Statement Asatendof201220132014201520162017F2018F2019F Rentalrevenue433,205446,626466,435469,209432,140406,212398,087399,282 %YtoYChange4.10%3.10%4.44%0.59%(7.90%)(6.00%)(2.00%)(0.30%) Ancillaryrentalincome6,6966,9586,8106,9396,7066,7266,7736,801 Totalrentalrevenue439,901453,584473,245476,148438,846412,938404,860406,083 Rentalexpenses Operatingexpenses87,14389,00293,18094,17297,620100,510103,428105,807 %YtoYChange3.25%2.13%4.69%1.06%3.66%2.96%2.90%2.30% Utilities39,32142,12147,57246,20044,71143,37143,37743,810 Propertytaxes36,77338,27240,09141,07443,41640,71341,32441,632 Netoperatingincome276,064284,189292,402294,702253,099228,343216,732214,834 StabilizedBuildingNOIGrowth5.10%2.94%2.89%0.79%(14.12%)(9.78%)(5.08%)(0.88%) Operatingmargin62.76%62.65%61.79%61.89%57.67%55.30%53.53%52.90% Financingcosts98,06288,81891,97785,37079,77476,86973,54976,731 Administration28,90932,20233,73233,40733,94733,32233,60233,570 Depreciationandamortization10,92211,92011,9339,64910,07910,76010,82610,870 Profitfromcontinuingoperationsbeforetheundernoted138,171151,249154,760166,276129,299107,39398,75593,664 (Loss)gainonsaleofassets135(235)(6,855)---- Fairvaluegains(losses)549,986174,42481,126130,361(186,681)(167,897)(161,646)(149,367) (Loss)profitfromcontinuingoperationsbeforeincometax/recover688,292325,673235,65129,060(57,382)(60,504)(62,891)(55,703) Incometaxexpense(recovery)222(538)(41)(212)(58)(125)(194)(126) profitfromcontinuingoperations688,514325,135235,61028,848(57,440)(60,629)(63,086)(55,829) profitfromdiscontinuedoperations,netoftax-12,59511,181----- (Loss)profitfortheyear688,514337,730246,79128,848(57,440)(60,629)(63,086)(55,829) Othercomprehensiveincome2,8502,1492,4451,014---- Totalcomprehensive(loss)income691,364339,879249,23629,862(57,440)(60,629)(63,086)(55,829) IncomeStatement
  • 10. Asatendof201220132014201520162017F2018F2019F Assets Non-currentassets Investmentproperties$5,493,448$5,745,207$5,778,108$5,540,299$5,612,568$5,633,926$5,662,022$5,645,385 Property,plantandequipment20,67723,62526,12429,32024,14724,77925,59925,994 Deferredtaxassets945455378191164156143173 5,515,0705,769,2875,804,6105,569,8105,636,8795,658,8615,687,7645,671,551 Currentassets Inventories3,2333,5853,5944,0267,2779,11610,72212,135 Prepaidassets3,7924,2094,4935,9659,14812,83617,43321,917 Tradeandotherreceivables2,4614,8197,2465,2305,5024,3594,5474,881 Segregatedtenants’securitydeposits12,09012,70412,13811,79510,70511,85411,83511,875 Cashandcashequivalents138,656131,079139,564237,01699,10290,78394,79093,749 160,232156,396167,035264,032131,734128,948139,327144,556 TotalAssets$5,675,302$5,925,683$5,971,645$5,833,842$5,768,613$5,787,809$5,827,090$5,816,107 Liabilities Non-currentliabilities Mortgagespayable$1,922,166$1,790,625$1,702,179$1,973,307$2,091,844$1,866,845$1,891,161$1,885,994 Debentures LPClassBUnits288,772267,829275,392212,339217,709222,846239,223233,502 Othernon-currentliabilities5,4523,364972----- Deferredunit-basedcompensation5,3064,8724,5103,7153,2193,1783,1863,268 Deferredtaxliabilities750131743814 Deferredgovernmentgrant2,2836,4366,7756,3976,0196,4076,3996,306 2,223,9862,073,1761,989,8412,195,7752,318,7952,099,2792,139,9772,129,083 Currentliabilities Mortgagespayable326,010470,787467,320299,140343,822381,416392,497376,839 Deferredunit-basedcompensation3,7653,4533,2502,2182,7623,0902,9552,855 Deferredgovernmentgrant380378378378378378378 Refundabletenants’securitydeposits15,71816,37515,90014,24113,27515,10615,10215,000 Tradeandotherpayables55,72261,990136,968111,35268,26279,36088,45789,753 401,215552,985623,816427,329428,499479,349499,389484,825 TotalLiabilities2,625,2012,626,1612,613,6572,623,1042,747,2942,578,6282,639,3662,613,908 Equity Unitholders’equity3,050,1013,299,5223,357,9883,210,7383,021,3193,209,1803,187,7243,202,199 TotalEquity3,050,1013,299,5223,357,9883,210,7383,021,3193,209,1803,187,7243,202,199 TotalLiabilitiesandEquity$5,675,302$5,925,683$5,971,645$5,833,842$5,768,613$5,787,809$5,827,090$5,816,107 BalanceSheet AppendixA2:BoardwalkBalanceSheet
  • 11. Name, Position, Municipality of Residence, and Age Position Held Principal Occupation Trustee Since Trust and Deferred Units Beneficially Owned or Controlled and Market Value James R. Dewald, Calgary, Alberta, 57 Independent Trustee and Proposed Trustee Dean and Associate Professor, Strategy & Global Management, Haskayne School of Business, University of Calgary from April 1, 2013 to the present. Prior positions at the Haskayne School of Business include Interim Dean, Haskayne School of Business (September 2012 to April 1, 2013), Director of Real Estate and Entrepreneurship Studies (2012), Associate Dean (2009-2012), and Assistant Professor (2006–2009). Managing Partner, Peters Dewald Land Company Inc. from 2001 to present; prior thereto, from 2001 until 2004, Principal, Stormpilots Inc.; in 2004, President and CEO, Storm Creek Properties Inc.; from 1999 until 2000, President, Director and COO, 411HomeNet Group Inc.; from 1996 until 2000, President, Director and CEO Hopewell Residential Communities Inc.; from 1994 to 1996, President, Director and CEO Walker, Newby & Partners Inc. Dr. Dewald has been a professional engineer since 1981, and obtained his Ph.D. in Management (specializing in strategy and global management) from the University of Calgary in 2007. Dr. Dewald obtained a Master’s of Business Administration from the University of Alberta in 1984, and a Bachelor of Sciences degree in engineering from the University of Alberta in 1979. 10-May-15 16,199 Trust Units 7,431 Deferred Units 0.05% $1,432,910 Gary Goodman Toronto, Ontario 71 Independent Trustee and Proposed Trustee Executive Vice-President of Reichmann International Development Corporation and International Property Corporation between December 2007 and June 2010. Previously, CFO (December 2001 to November 2006) and President and CEO (from December 2006 to December 2007) of IPC US REIT, a TSX listed Real Estate Investment Trust which was sold to Behringer Harvard in December 2007 for an aggregate value of US$1.4 billion. Prior thereto, Mr. Goodman also served as a Director and Senior Vice President of Olympia & York Developments Limited, a Director of Campeau Corporation, Trilon Financial Corporation, Huntingdon Capital Corporation, Catellus Corporation and Brinco Mining. Mr. Goodman is a Director of Brightpath Early Learning Inc. and a member of the Advisory Board of Vision Opportunity Fund, a limited partnership which invests in real estate securities. Mr. Goodman is a Chartered Accountant (Gold Medalist) and has a Bachelor of Commerce degree from the University of Toronto. May 13, 2009 4,792 Trust Units 9,597 Deferred Units 0.03% $872,546 Appendix A3: Trustees of Boardwalk
  • 12. Appendix A3 (Cont’d): Trustees of Boardwalk Name, Position, Municipality of Residence, and Age Position Held Principal Occupation Trustee Since Trust and Deferred Units Beneficially Owned or Controlled and Market Value Arthur L. Havener, Jr. St. Louis, Missouri 47 Independent Trustee, Lead Trustee and Proposed Trustee Principal, Stampede Capital LLC, a firm designed to provide real estate consulting support to publicly traded real estate investment trusts and institutional investors, as well as certain private equity investment opportunities, from April 2007 to the present. Mr. Havener was a Vice President of A.G. Edwards and Sons Inc. from June, 1988 until March, 2007 and Head of Real Estate research from 2002 to 2007. Mr. Havener obtained a Master’s of Business Administration from Webster University in St. Louis, Missouri in 1992 and a Bachelor of Science from University of Missouri – Columbia in 1989. Mr. Havener is a graduate of the Directors Education Program, which is jointly developed by the Institute of Corporate Directors and the Rotman School of Management, University of Toronto. Mr. Havener is also an Alderman and Chair of the Finance Committee in the Municipality of Sunset Hills, Missouri. May 10, 2007 10,902 Trust Units 10,370 Deferred Units 0.04% $1,289,911 Sam Kolias Calgary, Alberta 52 Chairman, Chief Executive Officer, Trustee and Proposed Trustee Executive of the Trust since 1993. Mr. Kolias obtained a Bachelor of Science in Civil Engineering in 1983 from the University of Calgary, and a designation as a Certified Property Manager from the Real Estate Institute of Canada in 1995. Mr. Kolias has been a fellow of the Real Estate Institute of Canada since 1985. Prior to July 1993, Mr. Kolias was President and co-founder of Boardwalk Equities Inc. (now called BPCL Holdings Inc.) and President and co-founder of Boardwalk Properties Co. Ltd. July 1993 4,337,500 Trust Units Nil (0) Deferred Units 9.05% $263,026,000 Samantha Kolias Calgary, Alberta 26 Trustee and Proposed Trustee Controller of BPCL since September 2012. Prior thereto, Senior Accountant at KPMG LLP, from September 2009 to August 2012. Prior thereto, Educator at Lululemon Athletica, from May 2009 to August 2009, and A/R Trucking Accountant at Canadian Natural Resources Ltd., from May 2007 to August 2007. Ms. Kolias is a Chartered Accountant and has a Bachelor of Commerce from Queen’s University. N/A Nil Trust Units Nil (0) Deferred Units 0.0% $Nil
  • 13. Appendix A3 (Cont’d): Trustees of Boardwalk Name, Position, Municipality of Residence, and Age Position Held Principal Occupation Trustee Since Trust and Deferred Units Beneficially Owned or Controlled and Market Value Al W. Mawani Thornhill, Ontario 62 Independent Trustee and Proposed Trustee President and CEO, Calloway REIT, from May 1, 2011 to March 21, 2013; Principal, Exponent Capital Partners Inc., a real estate advisory and private equity firm, from February, 2002 to April 30, 2011, and was Vice President of the Industrial Promotion Services unit of the Aga Khan Fund for Economic Development, another private equity organization, from May 2001 to February 2004. Prior thereto, Mr. Mawani was Executive Vice-President of Business Development for one (1) year, and Senior Vice-President and Chief Financial Officer for ten (10) years, at Oxford Properties Group Inc., one of Canada’s largest real estate companies. Mr. Mawani is a Chartered Accountant and has a Master’s in Business Administration from the University of Toronto and a Master’s in Law from York University. April 30, 2002 43,483 Trust Units 8,984 Deferred Units 0.11% $3,181,588 Andrea M. Stephen Toronto, Ontario 49 Independent Trustee and Proposed Trustee Senior and then Executive Vice President, Investments for The Cadillac Fairview Corporation from May 2000 to December 2011. Prior thereto, Ms. Stephen held several positions with the Ontario Teachers' Pension Plan Board from September 1995 to May 2000. Prior thereto, Ms. Stephen was Director of Financial Reporting with Bramalea Centres from July 1993 to May 1995, and Audit Manager at KPMG from September 1986 to July 1993. Ms. Stephen served on Multiplan’s Board of Directors for six (6) years from 2006 to 2012. She was also a member of the Pension Real Estate Association Board of Directors (PREA), from March 2009 to March 2012. Ms. Stephen obtained an undergraduate degree in business from St. Francis Xavier University in 1986 and became a Chartered Accountant in 1990. Ms. Stephen has also been a director of First Capital Realty Inc. since January 9, 2012 and of the Macerich Company in the United States, since January 13, 2013. May 15, 2012 3,500.00 Trust Units 3,474 Deferred Units 0.02% $422,710
  • 14. References Boardwalk REIT (2016). 2016 Annual Report of the Boardwalk. Retrieved from https://www.bwalk.com/en-CA/Investors/GetInvestorDocument/259 Economic Outlook and Fiscal Plan 2017-20. Retrieved from http://finance.alberta.ca/publications/budget/budget2017/fiscal-plan-economic- outlook.pdf Ann-Marie Lurie, 2017 Economic Outlook & Regional Housing Market Forecast. Retrieved from http://www.creb.com/-/media/Public/Forecast2017/2017ForecastReport.pdf?la=en Mining and Oil and Gas Extraction, Retrieved from https://occinfo.alis.alberta.ca/occinfopreview/industries/mining-and-oil-and-gas- extraction.aspx Highlights of Albert Economy 2017. Retrieved from http://www.albertacanada.com/files/albertacanada/SP- EH_highlightsABEconomyPresentation.pdf Boardwalk REIT. (BEI-UN.TO) (2017). Profile, business summary. Yahoo!Finance. Retrieved from https://ca.finance.yahoo.com/quote/BEI-UN.TO?p=BEI-UN.TO Canadian Apartment Properties REIT. (CAR-UN.TO) (2017). Profile, business summary. Yahoo!Finance. Retrieved from https://ca.finance.yahoo.com/quote/CAR- UN.TO?p=CAR-UN.TO Northview Apartment Properties REIT. (NVU-UN.TO) (2017). Profile, business summary. Yahoo!Finance. Retrieved from https://ca.finance.yahoo.com/quote/NVU- UN.TO/?p=NVU-UN.TO
  • 15. Morguard North American Residential REIT. (MRG-UN.TO) (2017). Profile, business summary. Yahoo!Finance. https://ca.finance.yahoo.com/quote/MRG-UN.TO/?p=MRG- UN.TO Canadian Apartment Properties REIT (2016). 2016 annual report of the Canadian Apartment Properties REIT. Retrieved from http://www.snl.com/Cache/1001220547.PDF?O=PDF&T=&Y=&D=&FID=1001220547 &iid=4105050 Northview Apartment Properties REIT (2016). 2016 Annual Financial Report of the Northview Apartment Properties REIT. Retrieved from https://s3.amazonaws.com/lws_lift/northview/userfiles/Financials/2016/Northview%2020 16%20Annual%20FS.pdf Morguard North American Residential REIT (2016). 2016 Annual Report of the Morguard North American Residential REIT. Retrieved from http://www.morguard.com/Documents/Morguard%20REIT/Financial%20Reports/MRT_ 2016_AR.PDF Rothschild, M., Roy, N., & Dukesz, Nick. Real Estate Investment Trusts, Retrieved from http://www.theglobeandmail.com/globe-investor/investment-ideas/research- reports/article28079098.ece/BINARY/2016+REIT+Outlook.pdf RioCan REIT and Boardwalk REIT Team Up To Create a Joint Venture To Develop a Mixed Use Retail and Rental Residential Tower at RioCan's Brentwood Village Shopping Centre. (2016, November). Retrieved from http://investor.riocan.com/English/investor- relations/press-releases/press-release-details/2016/RIOCAN-REIT-AND- BOARDWALK-REIT-TEAM-UP-TO-CREATE-A-JOINT-VENTURE-TO-DEVELOP-