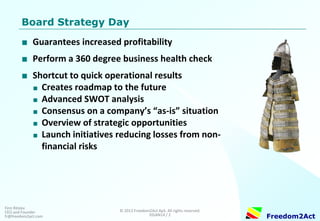
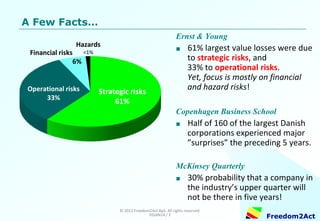
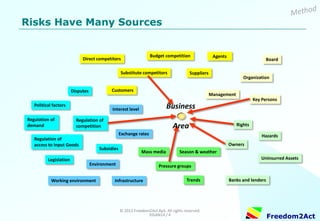
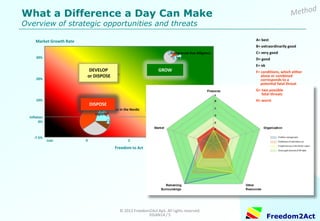
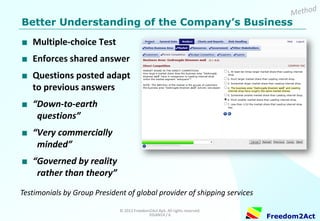
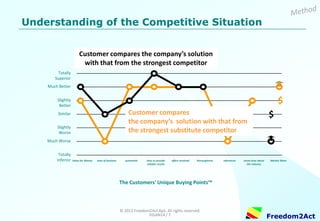
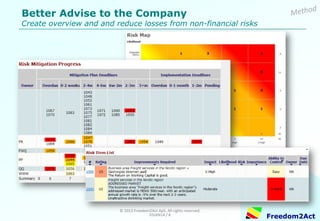
Copyright © 2008-2014 Freedom2Act ApS. All rights reserved. 06OCT14 / 1 
Freedom2Act 
Finn Ritslev CEO and Founder fr@freedom2act.com 
1x1 
Board Strategy Day 
Freedom2Act
Copyright © 2008-2014 Freedom2Act ApS. All rights reserved. 06OCT14 / 2 
Freedom2Act 
Finn Ritslev CEO and Founder fr@freedom2act.com 
Board Strategy Day 
■Guarantees increased profitability 
■Perform a 360 degree business health check 
■Shortcut to quick operational results 
■Creates roadmap to the future 
■Advanced SWOT analysis 
■Consensus on a company’s “as-is” situation 
■Overview of strategic opportunities 
■Launch initiatives reducing exposure to non- financial risks
Copyright © 2008-2014 Freedom2Act ApS. All rights reserved. 06OCT14 / 3 
Freedom2Act 
A Few Facts… 
Ernst & Young 
■61% largest value losses were due to strategic risks, and 33% to operational risks. Yet, focus is mostly on financial and hazard risks! 
Copenhagen Business School 
■Half of 160 of the largest Danish corporations experienced major ”surprises” the preceding 5 years. 
McKinsey Quarterly 
■30% probability that a company in the industry’s upper quarter will not be there in five years! 
Operational risks 
33% 
Financial risks 
6% 
Strategic risks 61% 
Hazards <1%
Copyright © 2008-2014 Freedom2Act ApS. All rights reserved. 06OCT14 / 4 
Freedom2Act 
Risks Have Many Sources 
Direct competitors 
Customers 
Substitute competitors 
Suppliers 
Budget competition 
Agents 
Board 
Management 
Organization 
Key Persons 
Rights 
Uninsurred Assets 
Owners 
Banks and lenders 
Hazards 
Mass media 
Season & weather 
Pressure groups 
Trends 
Interest level 
Exchange rates 
Infrastructure 
Environment 
Legislation 
Disputes 
Regulation of demand 
Regulation of competition 
Regulation of access to Input Goods 
Working environment 
Political factors 
Subsidies 
Business Area
Copyright © 2008-2014 Freedom2Act ApS. All rights reserved. 06OCT14 / 5 
Freedom2Act 
What a Difference a Few Hours Can Make Overview of businesses
Copyright © 2008-2014 Freedom2Act ApS. All rights reserved. 06OCT14 / 6 
Freedom2Act 
What a Difference a Day Can Make Overview of strategic opportunities and threats 
30% 
Freedom to Act 
Low 
High 
Market Growth Rate 
0% 
10% 
20% 
Inflation 
-7.5% 
Freight services in the Nordic region 
Tool for sales opportunity management 
Commercial Due Diligence 
GROW 
DISPOSE 
DEVELOP 
or DISPOSE 
MAINTAIN
Copyright © 2008-2014 Freedom2Act ApS. All rights reserved. 06OCT14 / 7 
Freedom2Act 
Better Understanding of the Company’s Business 
■Multiple-choice Test 
■Enforces shared answer 
■Questions posted adapt to previous answers 
■“Down-to-earth questions” 
■“Very commercially minded” 
■“Governed by reality rather than theory” 
Testimonials by Group President in global shipping, logistics and marine services provider
Copyright © 2008-2014 Freedom2Act ApS. All rights reserved. 06OCT14 / 8 
Freedom2Act 
Understanding of the Competitive Situation 
Customer compares the company’s solution with that from the strongest competitor 
The Customers' Unique Buying Points™ 
Totally Superior 
Much Better 
Slightly Better 
Similar 
Slightly Worse 
Much Worse 
Totally Inferior 
$ 
Value for Money 
ease of business 
$ 
systematic 
time to provide reliable results 
effort involved 
thoroughness 
references 
know-how about the industry 
Market Share 
Customer compares the company’s solution with that from the strongest substitute competitor
Copyright © 2008-2014 Freedom2Act ApS. All rights reserved. 06OCT14 / 9 
Freedom2Act 
Better Advise to the Company Create overview and and reduce losses from non-financial risks
Copyright © 2008-2014 Freedom2Act ApS. All rights reserved. 06OCT14 / 10 
Freedom2Act 
Risk Item Progress Management 
■Overview 
■Planning phase 
■Implementation 
■Quick identification of delays
Copyright © 2008-2014 Freedom2Act ApS. All rights reserved. 06OCT14 / 11 
Freedom2Act 
Freedom2Act Strategy Review™ 
“The road to achieve goals is paved with stones, some small, some large, some boulders ………….. 
………..removing large “stones” increases the success rate!” 
Quick and efficient generation of a ”Roadmap” to the future Citation: Johan Mellin, Commercial Risk Manager, TeliaSonera
Copyright © 2008-2014 Freedom2Act ApS. All rights reserved. 06OCT14 / 12 
Freedom2Act 
Proven Technology 
Proven on more than a thousand businesses 
large and small in 
Northern Europe
Copyright © 2008-2014 Freedom2Act ApS. All rights reserved. 06OCT14 / 13 
Freedom2Act 
Selected References and Testimonials 
Johan Mellin, Commercial Risk Manager, TeliaSonera: “Fast and efficient generation of a ”Roadmap” to the future.“ 
SVP, International Fire Service, Falck : “Contains what is required to analyze a company and come to concrete actions.“ “The analysis is based upon internal knowledge.” “Provides a more strict business case.“ “Visibility on competences.“ “Rapid identification of problem areas.“ “Good to jumpstart integration processes.” “May affect multiplier from 6½ to 7.” 
Senior Director, Novozymes: “A tool that is very relevant in companies that do not master strategy processes.” “Extremely useful for commercial due diligence processes in acquisitions.“ “Quick and effective transfer of knowledge from the acquired company to purchaser.”
Copyright © 2008-2014 Freedom2Act ApS. All rights reserved. 06OCT14 / 14 
Freedom2Act 
Who are We? 
Freedom2Act ApS 
■Founded 2001 
■Strategy reviews 
■Risk identification and assessments 
■Risk mitigation 
■Sales opportunity qualification 
■Portfolio segmentation 
Finn Ritslev, Founder and CEO 
■M.ScEE, DTU, Denmark PED, IMD Business School, Switzerland 
■Software development, project management, marketing and sales, business development, and strategic planning 
Partners 
■Alameda Global Consulting Limited 
■Bluecon 
■IEAS International Executive Advisory Services GmbH 
■IIB Executive Consultants
Copyright © 2008-2014 Freedom2Act ApS. All rights reserved. 06OCT14 / 15 
Freedom2Act 
Reach Us On … 
www.freedom2act.com if you want to know more

Board Strategy Day

  • 1.
    Copyright © 2008-2014Freedom2Act ApS. All rights reserved. 06OCT14 / 1 Freedom2Act Finn Ritslev CEO and Founder fr@freedom2act.com 1x1 Board Strategy Day Freedom2Act
  • 2.
    Copyright © 2008-2014Freedom2Act ApS. All rights reserved. 06OCT14 / 2 Freedom2Act Finn Ritslev CEO and Founder fr@freedom2act.com Board Strategy Day ■Guarantees increased profitability ■Perform a 360 degree business health check ■Shortcut to quick operational results ■Creates roadmap to the future ■Advanced SWOT analysis ■Consensus on a company’s “as-is” situation ■Overview of strategic opportunities ■Launch initiatives reducing exposure to non- financial risks
  • 3.
    Copyright © 2008-2014Freedom2Act ApS. All rights reserved. 06OCT14 / 3 Freedom2Act A Few Facts… Ernst & Young ■61% largest value losses were due to strategic risks, and 33% to operational risks. Yet, focus is mostly on financial and hazard risks! Copenhagen Business School ■Half of 160 of the largest Danish corporations experienced major ”surprises” the preceding 5 years. McKinsey Quarterly ■30% probability that a company in the industry’s upper quarter will not be there in five years! Operational risks 33% Financial risks 6% Strategic risks 61% Hazards <1%
  • 4.
    Copyright © 2008-2014Freedom2Act ApS. All rights reserved. 06OCT14 / 4 Freedom2Act Risks Have Many Sources Direct competitors Customers Substitute competitors Suppliers Budget competition Agents Board Management Organization Key Persons Rights Uninsurred Assets Owners Banks and lenders Hazards Mass media Season & weather Pressure groups Trends Interest level Exchange rates Infrastructure Environment Legislation Disputes Regulation of demand Regulation of competition Regulation of access to Input Goods Working environment Political factors Subsidies Business Area
  • 5.
    Copyright © 2008-2014Freedom2Act ApS. All rights reserved. 06OCT14 / 5 Freedom2Act What a Difference a Few Hours Can Make Overview of businesses
  • 6.
    Copyright © 2008-2014Freedom2Act ApS. All rights reserved. 06OCT14 / 6 Freedom2Act What a Difference a Day Can Make Overview of strategic opportunities and threats 30% Freedom to Act Low High Market Growth Rate 0% 10% 20% Inflation -7.5% Freight services in the Nordic region Tool for sales opportunity management Commercial Due Diligence GROW DISPOSE DEVELOP or DISPOSE MAINTAIN
  • 7.
    Copyright © 2008-2014Freedom2Act ApS. All rights reserved. 06OCT14 / 7 Freedom2Act Better Understanding of the Company’s Business ■Multiple-choice Test ■Enforces shared answer ■Questions posted adapt to previous answers ■“Down-to-earth questions” ■“Very commercially minded” ■“Governed by reality rather than theory” Testimonials by Group President in global shipping, logistics and marine services provider
  • 8.
    Copyright © 2008-2014Freedom2Act ApS. All rights reserved. 06OCT14 / 8 Freedom2Act Understanding of the Competitive Situation Customer compares the company’s solution with that from the strongest competitor The Customers' Unique Buying Points™ Totally Superior Much Better Slightly Better Similar Slightly Worse Much Worse Totally Inferior $ Value for Money ease of business $ systematic time to provide reliable results effort involved thoroughness references know-how about the industry Market Share Customer compares the company’s solution with that from the strongest substitute competitor
  • 9.
    Copyright © 2008-2014Freedom2Act ApS. All rights reserved. 06OCT14 / 9 Freedom2Act Better Advise to the Company Create overview and and reduce losses from non-financial risks
  • 10.
    Copyright © 2008-2014Freedom2Act ApS. All rights reserved. 06OCT14 / 10 Freedom2Act Risk Item Progress Management ■Overview ■Planning phase ■Implementation ■Quick identification of delays
  • 11.
    Copyright © 2008-2014Freedom2Act ApS. All rights reserved. 06OCT14 / 11 Freedom2Act Freedom2Act Strategy Review™ “The road to achieve goals is paved with stones, some small, some large, some boulders ………….. ………..removing large “stones” increases the success rate!” Quick and efficient generation of a ”Roadmap” to the future Citation: Johan Mellin, Commercial Risk Manager, TeliaSonera
  • 12.
    Copyright © 2008-2014Freedom2Act ApS. All rights reserved. 06OCT14 / 12 Freedom2Act Proven Technology Proven on more than a thousand businesses large and small in Northern Europe
  • 13.
    Copyright © 2008-2014Freedom2Act ApS. All rights reserved. 06OCT14 / 13 Freedom2Act Selected References and Testimonials Johan Mellin, Commercial Risk Manager, TeliaSonera: “Fast and efficient generation of a ”Roadmap” to the future.“ SVP, International Fire Service, Falck : “Contains what is required to analyze a company and come to concrete actions.“ “The analysis is based upon internal knowledge.” “Provides a more strict business case.“ “Visibility on competences.“ “Rapid identification of problem areas.“ “Good to jumpstart integration processes.” “May affect multiplier from 6½ to 7.” Senior Director, Novozymes: “A tool that is very relevant in companies that do not master strategy processes.” “Extremely useful for commercial due diligence processes in acquisitions.“ “Quick and effective transfer of knowledge from the acquired company to purchaser.”
  • 14.
    Copyright © 2008-2014Freedom2Act ApS. All rights reserved. 06OCT14 / 14 Freedom2Act Who are We? Freedom2Act ApS ■Founded 2001 ■Strategy reviews ■Risk identification and assessments ■Risk mitigation ■Sales opportunity qualification ■Portfolio segmentation Finn Ritslev, Founder and CEO ■M.ScEE, DTU, Denmark PED, IMD Business School, Switzerland ■Software development, project management, marketing and sales, business development, and strategic planning Partners ■Alameda Global Consulting Limited ■Bluecon ■IEAS International Executive Advisory Services GmbH ■IIB Executive Consultants
  • 15.
    Copyright © 2008-2014Freedom2Act ApS. All rights reserved. 06OCT14 / 15 Freedom2Act Reach Us On … www.freedom2act.com if you want to know more

Editor's Notes

  • #6 The Strategic Opportunity Map has been inspired by the GE/McKinsey matrix.The size of each circle represents the total value of the addressed market. The blue pie represents the Business Area’s market share. The red indicated the size of the hardest direct competitor while the brown corresponds to the hardest substitute competitor. The arrows indicate whether the business area is gaining or losing market share – no error indicates a “stable” market situation.Business areas in the green zone (upper right corner) are potential future ”stars” while those in the red/black zone (lower left corner) are likely to have major or even fatal future problems. The further away from the yellow zone a business area in the green zone, the more attractive it is relative to other business areas; and visa-versa for business areas placed in the red/black zone.
  • #20 The Strategic Opportunity Map is more sophisticated the Boston Consulting Group’s BCG matrix. It’s similar to the GE/McKinsey matrix.The size of each circle represents the total value of the addressed market. The green pie represents the corresponding Business Area’s market share. The red indicated the size of the hardest direct competitor while the brown corresponds to the hardest substitute competitor. The arrows indicate whether the business area is gaining or losing market share – no error indicates a “stable” market situation.Business areas in the green zone (upper right corner) are potential future ”stars” while those in the red/black zone (lower left corner) are likely to have major or even fatal future problems. The further away from the yellow zone a business area in the green zone, the more attractive it is relative to other business areas; and visa-versa for business areas placed in the red/black zone.
  • #22 The diagnosis is based upon the answers given during the fact-finding process and it identifies and assesses those factors, which controls and limits the business’ potential to develop. The report includes a comprehensive external and internal situation analysis and a SWOT analysis comprising 140 business-related factors in each analyzed business area complemented by intuitive and communicative graphics.The graph shows stakeholders and those external forces that influences the company or business area.Kind of arrows:A heavy red arrow pointing towards the center indicates a potentially fatal relationship.Arrows pointing towards the center correspond to forces that act against the development of the business area.Arrows pointing out from the center correspond to forces acting against the development of the other party.Arrows pointing both ways correspond to a competitive situation where the forces act either ways.Lines with a link in each end correspond to a mutual dependency of the parties. They gain from cooperation.Thickness of the line:A thin gray arrow corresponds to a relation that allows for great freedom to act.A thick arrow corresponds to a strong dependency.A very thick red inward pointing arrow corresponds to a fatal dependency.