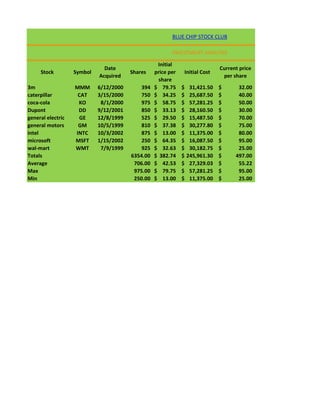
BLUE CHIP STOCK CLUB

                                                         INVESTMENT ANALYSIS

                                                   Initial
                              Date                                               Current price
     Stock         Symbol               Shares    price per       Initial Cost
                            Acquired                                              per share
                                                    share
3m                 MMM      6/12/2000       394   $ 79.75     $    31,421.50     $      32.00
caterpillar         CAT     3/15/2000       750   $ 34.25     $    25,687.50     $      40.00
coca-cola           KO       8/1/2000       975   $ 58.75     $    57,281.25     $      50.00
Dupont              DD      9/12/2001       850   $ 33.13     $    28,160.50     $      30.00
general electric    GE      12/8/1999       525   $ 29.50     $    15,487.50     $      70.00
general motors      GM      10/5/1999       810   $ 37.38     $    30,277.80     $      75.00
intel              INTC     10/3/2002       875   $ 13.00     $    11,375.00     $      80.00
microsoft          MSFT     1/15/2002       250   $ 64.35     $    16,087.50     $      95.00
wal-mart           WMT       7/9/1999       925   $ 32.63     $    30,182.75     $      25.00
Totals                                  6354.00   $ 382.74    $   245,961.30     $     497.00
Average                                  706.00   $ 42.53     $    27,329.03     $      55.22
Max                                      975.00   $ 79.75     $    57,281.25     $      95.00
Min                                      250.00   $ 13.00     $    11,375.00     $      25.00
Percent Gain
Current value   Gain/Loss
                                loss

$ 12,608.00 $ (18,813.50)        -59.87%
$ 30,000.00 $   4,312.50          16.79%
$ 48,750.00 $ (8,531.25)         -14.89%
$ 25,500.00 $ (2,660.50)          -9.45%
$ 36,750.00 $ 21,262.50          137.29%
$ 60,750.00 $ 30,472.20          100.64%
$ 70,000.00 $ 58,625.00          515.38%
$ 23,750.00 $   7,662.50          47.63%
$ 23,125.00 $ (7,057.75)         -23.38%
$ 331,233.00 $ 85,271.70    $       7.10
$ 36,803.67 $   9,474.63    $       0.79
$ 70,000.00 $ 58,625.00     $       5.15
$ 12,608.00 $ (18,813.50)   $      (0.60)

Blue Chips

  • 1.
    BLUE CHIP STOCKCLUB INVESTMENT ANALYSIS Initial Date Current price Stock Symbol Shares price per Initial Cost Acquired per share share 3m MMM 6/12/2000 394 $ 79.75 $ 31,421.50 $ 32.00 caterpillar CAT 3/15/2000 750 $ 34.25 $ 25,687.50 $ 40.00 coca-cola KO 8/1/2000 975 $ 58.75 $ 57,281.25 $ 50.00 Dupont DD 9/12/2001 850 $ 33.13 $ 28,160.50 $ 30.00 general electric GE 12/8/1999 525 $ 29.50 $ 15,487.50 $ 70.00 general motors GM 10/5/1999 810 $ 37.38 $ 30,277.80 $ 75.00 intel INTC 10/3/2002 875 $ 13.00 $ 11,375.00 $ 80.00 microsoft MSFT 1/15/2002 250 $ 64.35 $ 16,087.50 $ 95.00 wal-mart WMT 7/9/1999 925 $ 32.63 $ 30,182.75 $ 25.00 Totals 6354.00 $ 382.74 $ 245,961.30 $ 497.00 Average 706.00 $ 42.53 $ 27,329.03 $ 55.22 Max 975.00 $ 79.75 $ 57,281.25 $ 95.00 Min 250.00 $ 13.00 $ 11,375.00 $ 25.00
  • 2.
    Percent Gain Current value Gain/Loss loss $ 12,608.00 $ (18,813.50) -59.87% $ 30,000.00 $ 4,312.50 16.79% $ 48,750.00 $ (8,531.25) -14.89% $ 25,500.00 $ (2,660.50) -9.45% $ 36,750.00 $ 21,262.50 137.29% $ 60,750.00 $ 30,472.20 100.64% $ 70,000.00 $ 58,625.00 515.38% $ 23,750.00 $ 7,662.50 47.63% $ 23,125.00 $ (7,057.75) -23.38% $ 331,233.00 $ 85,271.70 $ 7.10 $ 36,803.67 $ 9,474.63 $ 0.79 $ 70,000.00 $ 58,625.00 $ 5.15 $ 12,608.00 $ (18,813.50) $ (0.60)