Unlocking the Power of ChatGPT and AI in Testing - A Real-World Look, present...
120222 Palm Oil Market
1. Market Weekly Analysis
Feb20, 2011 (Week 8)
1) Market Last week – the market moves in103points range.
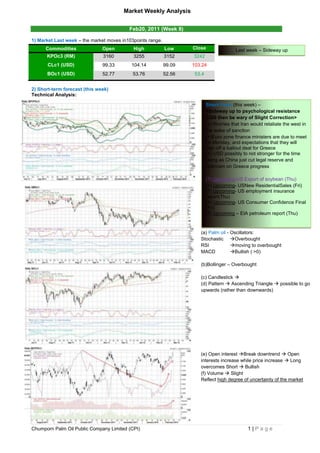
Commodities Open High Low Close Last week – Sideway up
KPOc3 (RM) 3160 3255 3152 3242
CLc1 (USD) 99.33 104.14 99.09 103.24
BOc1 (USD) 52.77 53.76 52.56 53.4
2) Short-term forecast (this week)
Technical Analysis:
Short-Term (this week) –
<Sideway up to psychological resistance
3300 then be wary of Slight Correction>
(+) Worries that Iran would retaliate the west in
the wake of sanction
(+)Euro zone finance ministers are due to meet
on Monday, and expectations that they will
sign off a bailout deal for Greece
(+) USD possibly to not stronger for the time
being as China just cut legal reserve and
optimism on Greece progress
(?) Upcoming-US Export of soybean (Thu)
(+) Upcoming- USNew ResidentialSales (Fri)
(?) Upcoming- US employment insurance
report(Thu)
(+) Upcoming- US Consumer Confidence Final
(Fri)
(?) Upcoming – EIA petroleum report (Thu)
(a) Palm oil - Oscillators:
Stochastic Overbought
RSI moving to overbought
MACD Bullish ( >0)
(b)Bollinger – Overbought
(c) Candlestick
(d) Pattern Ascending Triangle possible to go
upwards (rather than downwards)
(e) Open interest Break downtrend Open
interests increase while price increase Long
overcomes Short Bullish
(f) Volume Slight
Reflect high degree of uncertainty of the market
Chumporn Palm Oil Public Company Limited (CPI) 1|Page
2. Market Weekly Analysis
Fundamental Factors:
Date Effect Factors
Feb 1 (Wed) (-) U.S. crude inventories jumped more than 4 million barrels last week, exceeding
an expected build of 2.4 million barrels. Gasoline demand fell to an 11-year low.
EIA/S
(-) Home prices fell more steeply than expected in November ( The S&P/Case-
Shiller composite index), and consumers turned less optimistic in January,
(Conference Board) highlighting the hurdles still facing the bumpy economic
recovery
Feb 2 (Thu) (+)
China manufacturing improves slightly in January (PMI)
Feb 3 (Fri) (+) U.S. economy in January created jobs at the fastest pace in nine months,
fueling hopes of stronger demand in the top petroleum-consuming nation.
(+) Iran's supreme leader threatened on Friday to retaliate against the West for
sanctions.
Feb 4 (Sat) (+) Closely-watch analytics firm Informa Economics lowered its forecast for soy
production in Argentina and Brazil, helping to lift soybean futures to the highest
level since October.
Feb 6 (Mon) (+) Rains have been forecast this week in key growing regions of Argentina but dry
weather over the past month was likely to reduce yields in the No. 3 world soy
exporter.
Feb 14 (Tue) (+) Soybeans were little changed, hovering near a four-month top on concerns of
dryness in Brazil, which could further damage the crop following a drought in
January that curbed South American crop yields.
Feb 15 (Wed) (-) Exports of Malaysian palm oil products for Feb. 1-15 fell 14 percent to 509,107
tonnes from 591,995 tonnes shipped during Jan. 1-15, cargo surveyor Intertek
Testing Services said on Wednesday
Feb 16 (Thu) (+) In the week ending February 11, the advance figure for seasonally adjusted
initial claims was 348,000, a decrease of 13,000 from the previous week's
revised figure of 361,000. The 4-week moving average was 365,250, a
decrease of 1,750 from the previous week's revised average of 367,000
Feb 17 (Fri) (+) The Consumer Price Index for All Urban Consumers (CPI-U) increased0.2
percent in January on a seasonally adjusted basis, the U.S. Bureau of Labor
Statistics reported today. Over the last 12 months, the all items index increased
2.9 percent before seasonal adjustment.
(+) Argentina's Agriculture Ministry on Thursday estimated the country's 2011/12
soybean harvest at 43.5 million to 45 million tonnes, well below USDA's current
forecast of 48 million.
Feb 19 (Sun) (+) China is seen making more cuts to banks’ reserve requirements to fuel
lending and sustain economic growth as the housing market cools (50
bp).
Feb 20 (Mon) (-) Exports of Malaysian palm oil products for Feb. 1-20 fell 2 percent to 783,112
tonnes from 799,210 tonnes shipped during Jan. 1-20, cargo surveyor Intertek
Testing Services said on Monday
Chumporn Palm Oil Public Company Limited (CPI) 2|Page
3. Market Weekly Analysis
3) Medium-term forecast (one month ahead)
Technical Analysis:
Medium-Term
Feb 2012
Assumption
Expected average crude oil = 101
Target price of palm oil likely to = 3250
1Q2012
Assumption
Expected average crude oil = 103
Target price of palm oil likely to = 3400
Medium& Long-Term Fundamental:
Effect Time Factor
(+) Long-term Malaysia's oil palm industry will spend RM4.4 billion to replant some 365,000 hectares
from 2011 to 2013 (or ~13% out of all plantation area)
(+) Long-term Possible of QE3 to spur economy in Q2, Q3 (Long-term)
(+) Long-term M2 increases in the world economy as most central banks use monetary expansion
presently.
(+) Long-term Biodiesel Mandate Latin America will spur consumption of soy oil
th
(+) Long-term China cut legal reserve to 21%.(and cut further lately on Feb 17 ) 50BP
(+) Long-term ECB cut the monetary interest to 1% and likely to cut to 0.75% soon
(+) Long-term Major central banks (US, Japan, Swill, Canada etc) have cut interest swap line by 0.5%
to support world economy.
(+) Long-term The possibility of Fiscal Union and ESM measure in EU in 1Q2012 + Leaders completed the fiscal-
discipline treaty, which speeds sanctions on high-deficit states and requires euro countries to anchor
balanced-budget rules in national law
(+) Long-term The tension in Persian Gulf as long as Iran still resumes its nuclear programme
(-) Long-term The Euro-Zone debt crisis
(+) Long-term Expectation of money supply increase in US benefit commodities after Fed promised to
keep interest at 0% further 2 years.
(+) Long-term US defence secretary Leon Panetta believed Israel was likely to bomb Iran within months
to stop it building a nuclear bomb. (April, May or June) (Washington Post columnist.)
(-) Long-term The U.S. CIA director told a Senate committee on Tuesday that OPEC member Saudi
Arabia's oil production appears to be ramping up and can fill some of the shortfall caused
by sanctions on Iranian exports. Also, current sanctions appear to be biting much more in
recent weeks. [nL2E8CVCW1]
(-) Long-term Malaysia's 2012 palm oil production is expected to rise 2.3 percent to 19.3 million tonnes
as more estates come into maturity, an official from the country's industry regulator
Malaysian Palm Oil Board said on Thursday Jan 19, 12.
(o) Long-term EIA forecast the oil demand will increase in slower pace – 1.27mbpd in 2012 and 1.47
mbpd in 2013.
(+) Long-term Malaysia has issued this year's tax-free crude palm oil export quotas of 3 million tonnes
(+) Medium-term China will expand loan in 1Q2012.
(+) Medium-term La Nina to cause drought in Latin America in soybean crop belt + expected drop in
output.
(+) Medium-term Winter season in northern hemisphere to spur demand for oil.
(+) Medium-term Recover signs in US economy
(-) Medium-term S&P cut credit rating 9 country in EU including France
(-) Medium-term The possibility of Fiscal Union and ESM measure in EU in 1Q2012 is in doubt with its real practice.
Chumporn Palm Oil Public Company Limited (CPI) 3|Page
4. Market Weekly Analysis
4) IndicativeStatistics
Palm oil
2,000,000 800,000
Export Trend 1,843,602 Export by Destination
1,800,000
700,000 700,047
1,614,720
1,600,000
662,461
600,000
1,400,000 1,381,315
500,000
1,200,000 460,990
(T) 1,000,000 1,114,593 (T) 400,000 435,664
331,903
948,012 315,700
800,000
300,000
236,102
600,000
224,278 217,206
200,000
400,000
200,000 100,000
87,621
-
-
Jan
Jan
Jan
Jan
Jan
Jan
Nov
Mar
May
Jul
Sep
Nov
Mar
May
Jul
Sep
Mar
May
Jul
Sep
Nov
Mar
May
Jul
Sep
Nov
Jul
Sep
Nov
Mar
May
Mar
May
Jan Feb Mar Apr May Jun Jul Aug Sep Oct Nov Dec Jan Feb Mar Apr May Jun Jul Aug Sep Oct Nov Dec Jan Feb Mar Apr May Jun
2007 2008 2009 2010 2011 2012 2010 2011 2012
Overall Export China India US EU Pakistan Others
Figure1 – Malaysian Palm Oil Export for 5 Years – The Figure2 – Palm Oil Export by Country – 4 countries
export quantity has been rising in upward trend and has a accounted for 60% of overall export have slow their
cycle in its aspect. purchasing.
Soybean
100 300 Unit: M Tonnes
Production Major Grower
2012
90
250 2008 2009 2010 2011 Dec Jan Feb
80
World 220.47 211.96 260.85 264.18 259.22 257.00 257.00
70 US 72.86 80.75 91.42 90.61 82.89 83.17 83.17
200
Brazil 61.00 57.80 69.00 75.50 75.00 74.00 74.00
60
Argentina 46.20 32.00 54.50 49.00 52.00 50.50 50.50
Tonnes
Tonnes
50 150
Others 40.41 41.41 45.93 49.07 49.33 49.33 49.33
40
100
30
20
50 Figure3+ Table1– Soybean Production – Due to La Nina that
10 cause dry spell in America continent, soybean production
0 0 slightly drops from last year by 2.7%. While US has a biggest
2008 2009 2010 2011 2012 (Dec) 2012 (Feb)
drop at 8.2%, Brazil edges lower by 2%.
World US Brazil Argentina Others
160
Consumption Major Countries 300 Unit: M Tonnes
2012
140
250 2008 2009 2010 2011 Jan Feb
120 World 231.09 221.40 238.25 251.74 259.62 252.58
200 US 51.36 47.75 50.27 48.00 46.83 48.47
100
China 51.16 51.84 59.61 66.14 71.30 69.50
Tonnes
Tonnes
80 150
Others 128.57 121.81 128.36 137.59 141.49 134.61
60
100
40 Figure4+ Table2– Soybean Consumption– The demand is
50 growing in slower pace. Supply- Demand ratio (S/D) becomes
20
lower from 1.05 to 1.02 for 2011 and 2012 respectively.
0 0
2008 2009 2010 2011 2012 (Jan) 2012 (Feb)
World US China Others
Chumporn Palm Oil Public Company Limited (CPI) 4|Page
5. Market Weekly Analysis
5) Palm Oil Stock Situation
Malaysian Palm oil Stock:
Unit : Baht/Kg
Malaysia Production, Export and Stock Unit : Ton
The Assumption:
60 2,500,000
57 -Production forecast by MPOB is19.36 MT for
Forecast
52 2012, increase by from last year (18.9 MT)
50
2,000,000
-Export, Import and Local disappear is
44
estimated by using simple moving average
40
39
figure for 12 months period.
36 36 36
34 1,500,000
37 38
31 31 31 30
35 30
2,427,761
35 30
30 28
27 26 27 28
34 34 33 28 < Updated on Feb20, 2011>
26 26 26 31 31 31
26 25 26 26 25 30 30 30
<Dramatic changes in stock>
2,007,967
2,004,952
24 24 25 23 24 28
27 27 27 28
22 26 1,000,000
1,645,452
25
1,626,442
25 24 24 25
23 21 24
20
22 21 22
1,358,452
1,336,442
1,248,452
20 20
1,203,142
19
2,119,985
2,039,224
1,792,840
1,481,410
1,614,066
1,918,023
2,052,870
1,996,317
2,100,415
2,068,754
1,884,560
1,562,323
1,451,153
2,000,656
1,654,967
1,622,580
1,405,740
2,238,717
1,708,101
1,785,233
1,985,055
500,000
1,670,762
1,636,670
1,934,613
1,723,262
1,832,847
1,363,657
1,565,532
10
1,418,980
1,292,303
1,366,576
1,556,866
1,614,671
1,415,109
1,405,500
1,328,440
0 -
Jan Mar May Jul Sep Nov Jan Mar May Jul Sep Nov Jan Mar May Jul Sep Nov Jan Mar May Jul Sep Nov
2009 2010 2011 2012
Stock CPO Malaysia CPO Production Malaysia (MPOB) EXPORT Malaysia (convert to CPO) Price CPO Thailand (Ex-Vat) Price CPO Malaysia
Jan-12 Feb-12 Mar-12 Apr-12 May-12 Jun-12 Jul-12 Aug-12 Sep-12 Oct-12 Nov-12 Dec-12 Total
MPOB 1,080,050 1,056,990 1,200,000 1,406,700 1,585,310 1,650,000 1,827,000 1,899,500 1,962,809 1,997,220 1,932,100 1,759,803 19,357,482
Production CPO 1,287,194 1,158,475 1,250,000 1,406,700 1,585,310 1,650,000 1,827,000 1,899,500 1,962,809 1,997,220 1,932,100 1,759,803 19,716,111
Im port 209,408 110,000 110,000 110,000 110,000 110,000 110,000 110,000 110,000 110,000 110,000 110,000 1,419,408
Export CPO 1,381,315 1,500,000 1,500,000 1,500,000 1,500,000 1,500,000 1,500,000 1,500,000 1,500,000 1,500,000 1,500,000 1,500,000 17,881,315
Local Disaapear 146,544 150,000 150,000 150,000 150,000 150,000 150,000 150,000 150,000 150,000 150,000 150,000 1,796,544
Ending Stock 2,007,967 1,626,442 1,336,442 1,203,142 1,248,452 1,358,452 1,645,452 2,004,952 2,427,761 2,884,981 3,277,081 3,496,884
Forecast as of Jan31, 2011:
Jan-11 Feb-11 Mar-11 Apr-11 May-11 Jun-11 Jul-11 Aug-11 Sep-11 Oct-11 Nov-11 Dec-11 Total Jan-12 Feb-12 Mar-12
Production CPO 1,057,961 1,094,339 1,416,032 1,530,009 1,740,252 1,753,203 1,751,264 1,667,230 1,869,369 1,908,422 1,626,668 1,494,893 18,909,642 1,400,000 1,400,000 1,450,000
Im port 164,938 189,411 133,505 63,391 105,976 109,568 109,958 73,768 74,746 45,478 88,265 146,672 1,305,676 100,000 100,000 100,000
Export CPO 1,210,806 1,114,537 1,234,651 1,331,742 1,402,071 1,581,268 1,729,518 1,688,785 1,543,425 1,840,405 1,660,402 1,589,883 17,927,493 1,315,323 1,320,000 1,360,000
Local Disaapear 207,784 106,783 182,230 204,962 196,896 146,656 188,257 163,970 165,265 133,065 86,192 81,212 1,863,272 170,000 170,000 170,000
Ending Stock 1,418,980 1,481,410 1,614,066 1,670,762 1,918,023 2,052,870 1,996,317 1,884,560 2,119,985 2,100,415 2,068,754 2,039,224 2,053,901 2,063,901 2,083,901
Forecast as of Dec 13, 2011:
Jan-11 Feb-11 Mar-11 Apr-11 May-11 Jun-11 Jul-11 Aug-11 Sep-11 Oct-11 Nov-11 Dec-11 Total Jan-12 Feb-12 Mar-12
Production CPO 1,057,961 1,094,339 1,416,032 1,530,009 1,740,252 1,753,203 1,751,264 1,667,230 1,869,369 1,908,422 1,626,668 1,480,000 18,894,749 1,400,000 1,350,000 1,360,000
Im port 164,938 189,411 133,505 63,391 105,976 109,568 109,958 73,768 74,746 45,478 88,265 100,000 1,259,004 100,000 100,000 100,000
Export CPO 1,210,806 1,114,537 1,234,651 1,331,742 1,402,071 1,581,268 1,729,518 1,688,785 1,543,425 1,840,405 1,660,402 1,500,000 17,837,610 1,400,000 1,350,000 1,300,000
Local Disaapear 207,784 106,783 182,230 204,962 196,896 146,656 188,257 163,970 165,265 133,065 86,192 170,000 1,952,060 170,000 170,000 170,000
Ending Stock 1,418,980 1,481,410 1,614,066 1,670,762 1,918,023 2,052,870 1,996,317 1,884,560 2,119,985 2,100,415 2,068,754 1,978,754 1,908,754 1,838,754 1,828,754
Forecast as of Dec 05, 2011:
Jan-11 Feb-11 Mar-11 Apr-11 May-11 Jun-11 Jul-11 Aug-11 Sep-11 Oct-11 Nov-11 Dec-11 Total Jan-12 Feb-12 Mar-12
Production CPO 1,057,961 1,094,339 1,416,032 1,530,009 1,740,252 1,753,203 1,751,264 1,667,230 1,869,369 1,908,422 1,580,000 1,480,000 18,848,081 1,400,000 1,350,000 1,360,000
Im port 164,938 189,411 133,505 63,391 105,976 109,568 109,958 73,768 74,746 45,478 100,000 100,000 1,270,739 100,000 100,000 100,000
Export CPO 1,210,806 1,114,537 1,234,651 1,331,742 1,402,071 1,581,268 1,729,518 1,688,785 1,543,425 1,840,405 1,533,000 1,500,000 17,710,208 1,400,000 1,350,000 1,300,000
Local Disaapear 207,784 106,783 182,230 204,962 196,896 146,656 188,257 163,970 165,265 133,065 170,000 170,000 2,035,868 170,000 170,000 170,000
Ending Stock 1,418,980 1,481,410 1,614,066 1,670,762 1,918,023 2,052,870 1,996,317 1,884,560 2,119,985 2,100,415 2,077,415 1,987,415 1,917,415 1,847,415 1,837,415
Chumporn Palm Oil Public Company Limited (CPI) 5|Page
7. Market Weekly Analysis
6) Palm Oil Forecast for 2012
Q1 2012 Q2 2012 Q3 2012 Q4 2012 Average 2012
Dec-11 Jan-12 Feb-12 Mar-12 Apr-12 May-12 Jun-12 Jul-12 Aug-12 Sep-12 Oct-12 Nov-12 Dec-12
Crude oil price 105 105 105 105 105 105 105 105 105 105 105 105 105
Palm oil price 3,197 3,462 3,470 3,477 3,485 3,492 3,499 3,507 3,514 3,522 3,529 3,537 3,474
Limitation:
The model has tied up the palm oil price with the crude oil price, so if the crude price is not accurate, the palm
oil price predicted hereby will not accurate as well.
About the model:
The sample used to construct the model comes from time series data of palm oil (FCPOc3) and crude oil
price (CLc1) since Jan2007 to Nov 2011.
The forecasted figures is derived by econometric method under the mathematical model below:
The model can describe the price of palm oil about 80%. The rest 20% is unexplained and may be affected
by other factors such as stock, production, soybean etc.
The coefficient of Crude price, time and the constant terms is highly statistical significant.
Here are some statistical result from running SPSS;
Model Summary(b)
Change Statistics
Adjusted R Std. Error of R Square
Model R R Square Square the Estimate Change F Change df1 df2 Sig. F Change
1 .902(a) .814 .807 258.20845 .814 120.483 2 55 .000
a Predictors: (Constant), CRUDE1, TIME
b Dependent Variable: PALM
Coefficients(a)
Unstandardized Standardized
Coefficients Coefficients 95% Confidence Interval for B Correlations Collinearity Statistics
Model B Std. Error Beta t Sig. Lower Bound Upper Bound Zero-order Partial Part Tolerance VIF
1 (Constant
496.976 144.839 3.431 .001 206.713 787.240
)
TIME 7.424 2.045 .213 3.630 .001 3.325 11.523 .331 .440 .211 .981 1.020
CRUDE1 23.858 1.652 .848 14.439 .000 20.547 27.169 .877 .890 .839 .981 1.020
a Dependent Variable: PALM
To see the accuracy of our forecast, please follow the link below:
http://intranet/intra/catalog.php?category=7&ksub=11&mnulv2=1
Remark:
(1) The Market Weekly Analysis can also be accessed via CPI intranet / Marketing dept.
(2) The main source of information used to prepare this report is from Department of Internal Trade, MPOB, Reuter
Bloomberg and various Thai news agencies.
***************
Prepared by Poonsak Tananat / Market Analysis Officer / Purchasing Raw Material Dept.
Chumporn Palm Oil Public Company Limited (CPI) 7|Page