Download as PDF, PPTX


![Report data embedded
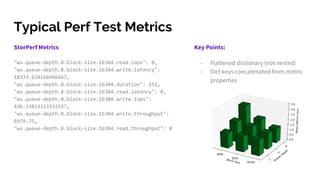
StorPerf Report Data
- "rs.queue-depth.2.block-size.16384":
"iops":
"read":
"steady_state": true,
"series": [...],
"range": 80.7440000000006,
"average": 2566.9578000000006,
"slope": -7.916618181818701
"write":
...
- “wr.queue-depth.2.block-size.2048”:
...
Key Points
- Metrics grouped in multi level dict
- Data broken down into series
- Statistics for each metric generated
-](https://image.slidesharecdn.com/ds3-bigdatafortesting-headingforpostprocessandanalytics-fileid-109177-170622030606/85/Big-Data-for-Testing-Heading-for-Post-Process-and-Analytics-12-320.jpg)


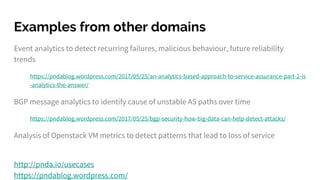
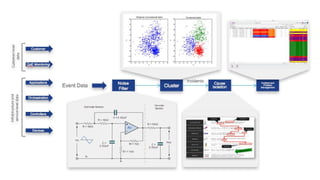
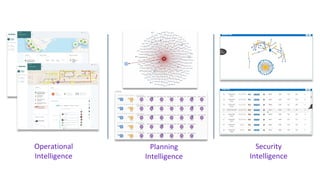

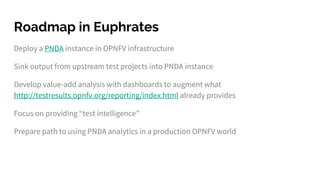


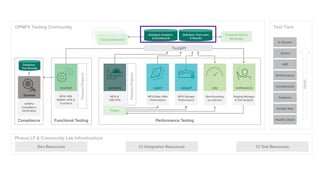
The document discusses big data analytics in the context of testing and performance analysis, featuring speakers from ZTE Corporation and Cisco who highlight their respective projects and interests. It provides an overview of the current state of test data, analytics methods using the pnda.io platform, and expectations for future development within the community, emphasizing the importance of traceability and anomaly detection. Additionally, it outlines use cases from other domains and sets a roadmap for integrating pnda analytics into the OPNFV infrastructure.


