Download to read offline

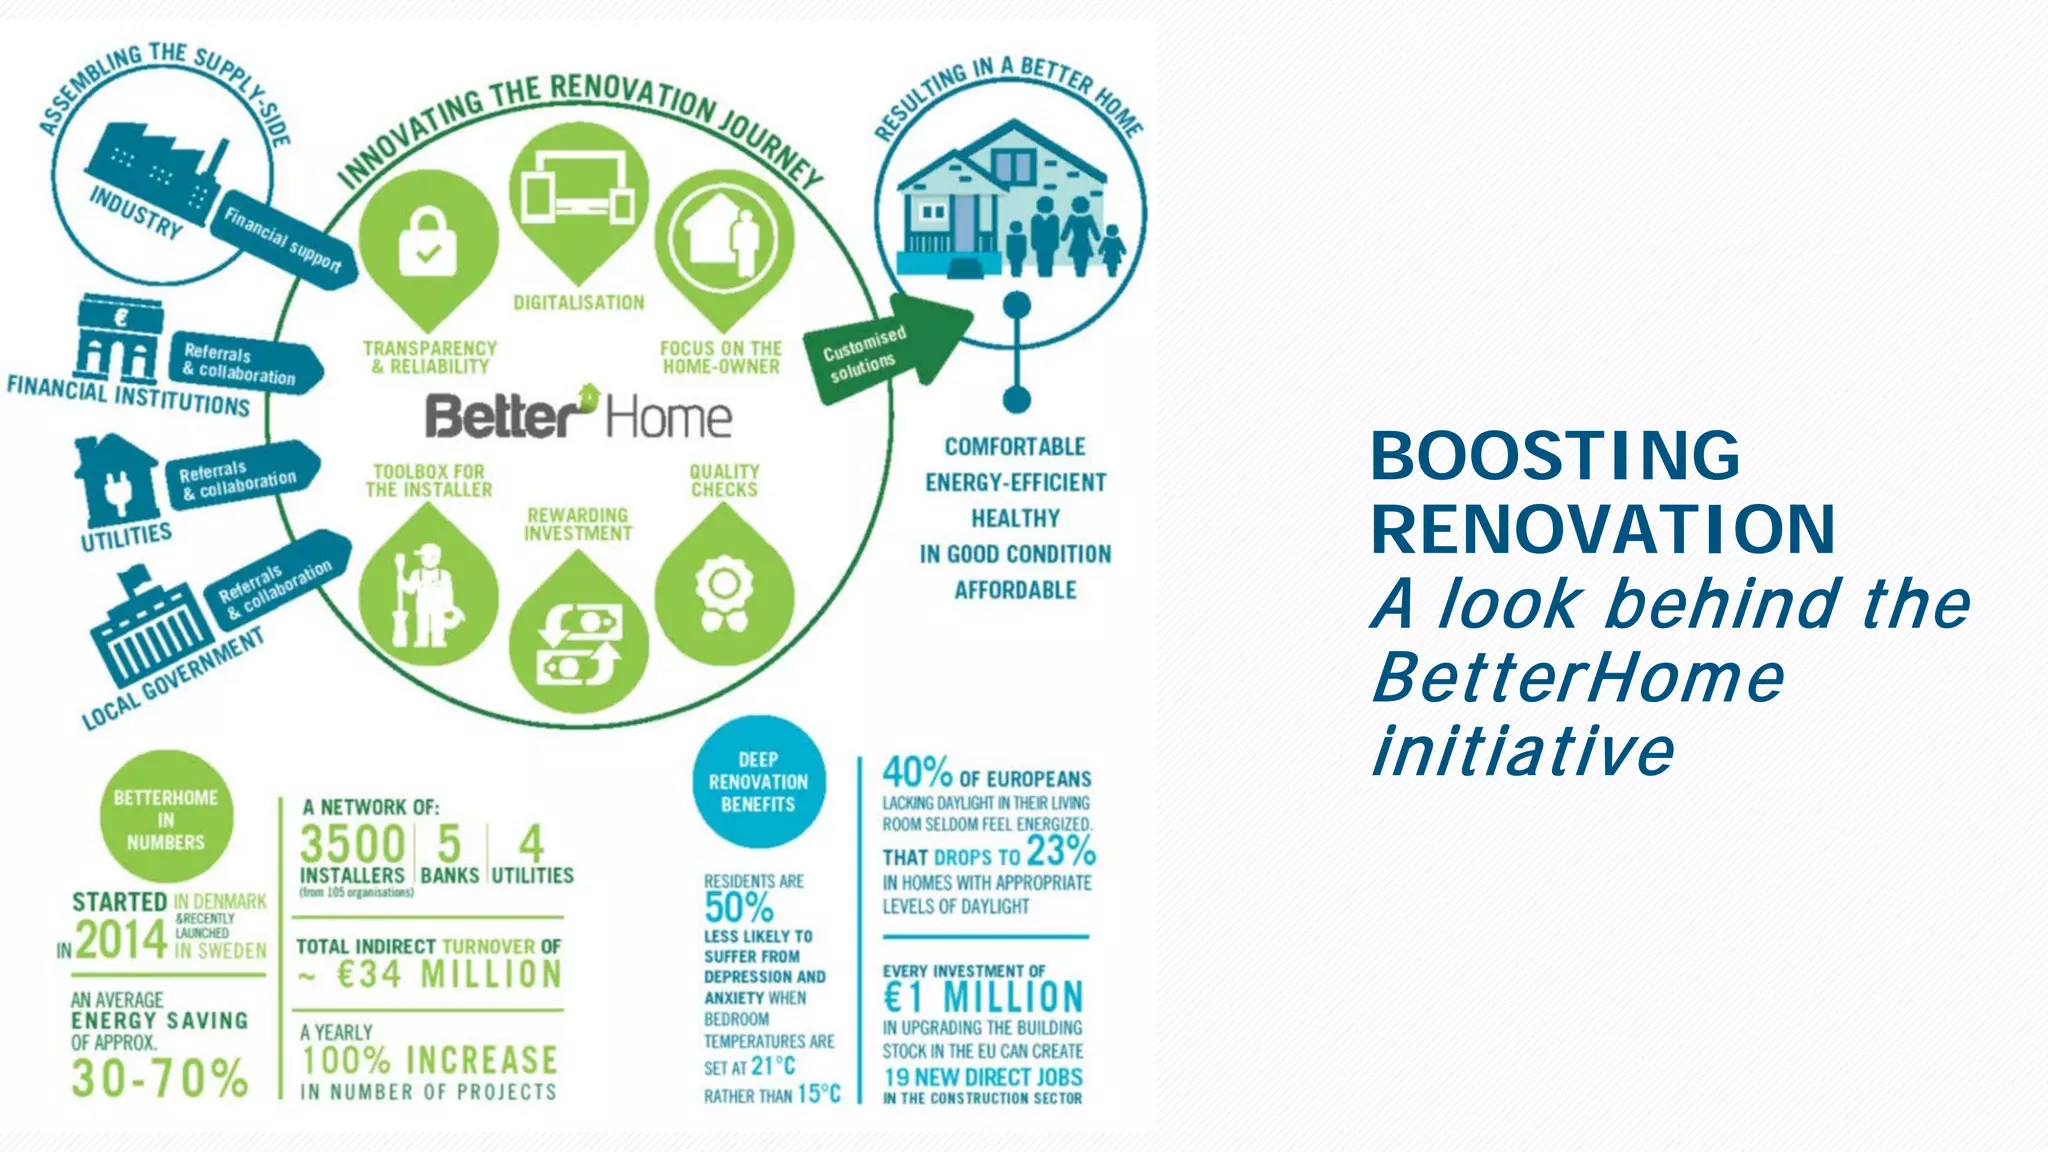
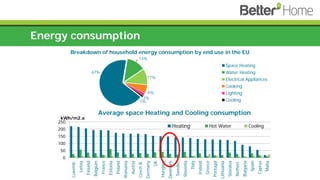
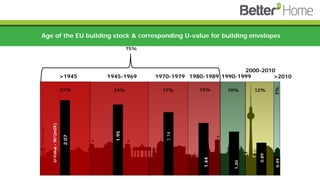
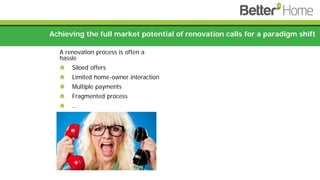
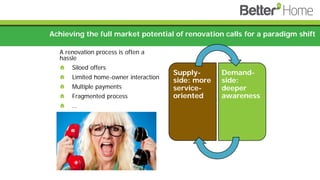
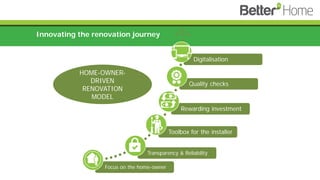
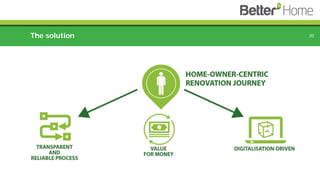
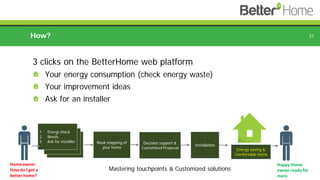
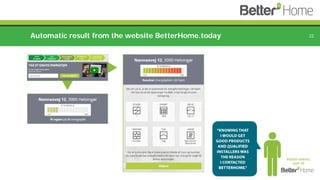
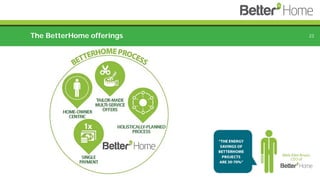
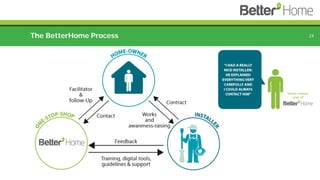

The document provides an overview of the Betterhome initiative, which aims to streamline the renovation process for homeowners in the EU. It highlights energy consumption breakdowns, the challenges of the current renovation market, and introduces a user-friendly digital platform for homeowners to improve energy efficiency in their homes. Key success factors include transparent processes, quality assurance, and homeowner-driven solutions facilitated by an innovative digital toolbox.


![Getting Started with Apache Spark: Big Data Made Simple [Free Meetup]](https://cdn.slidesharecdn.com/ss_thumbnails/apachesparkgettingstarted-260203175547-8361bcc3-thumbnail.jpg?width=640&height=640&fit=bounds)


