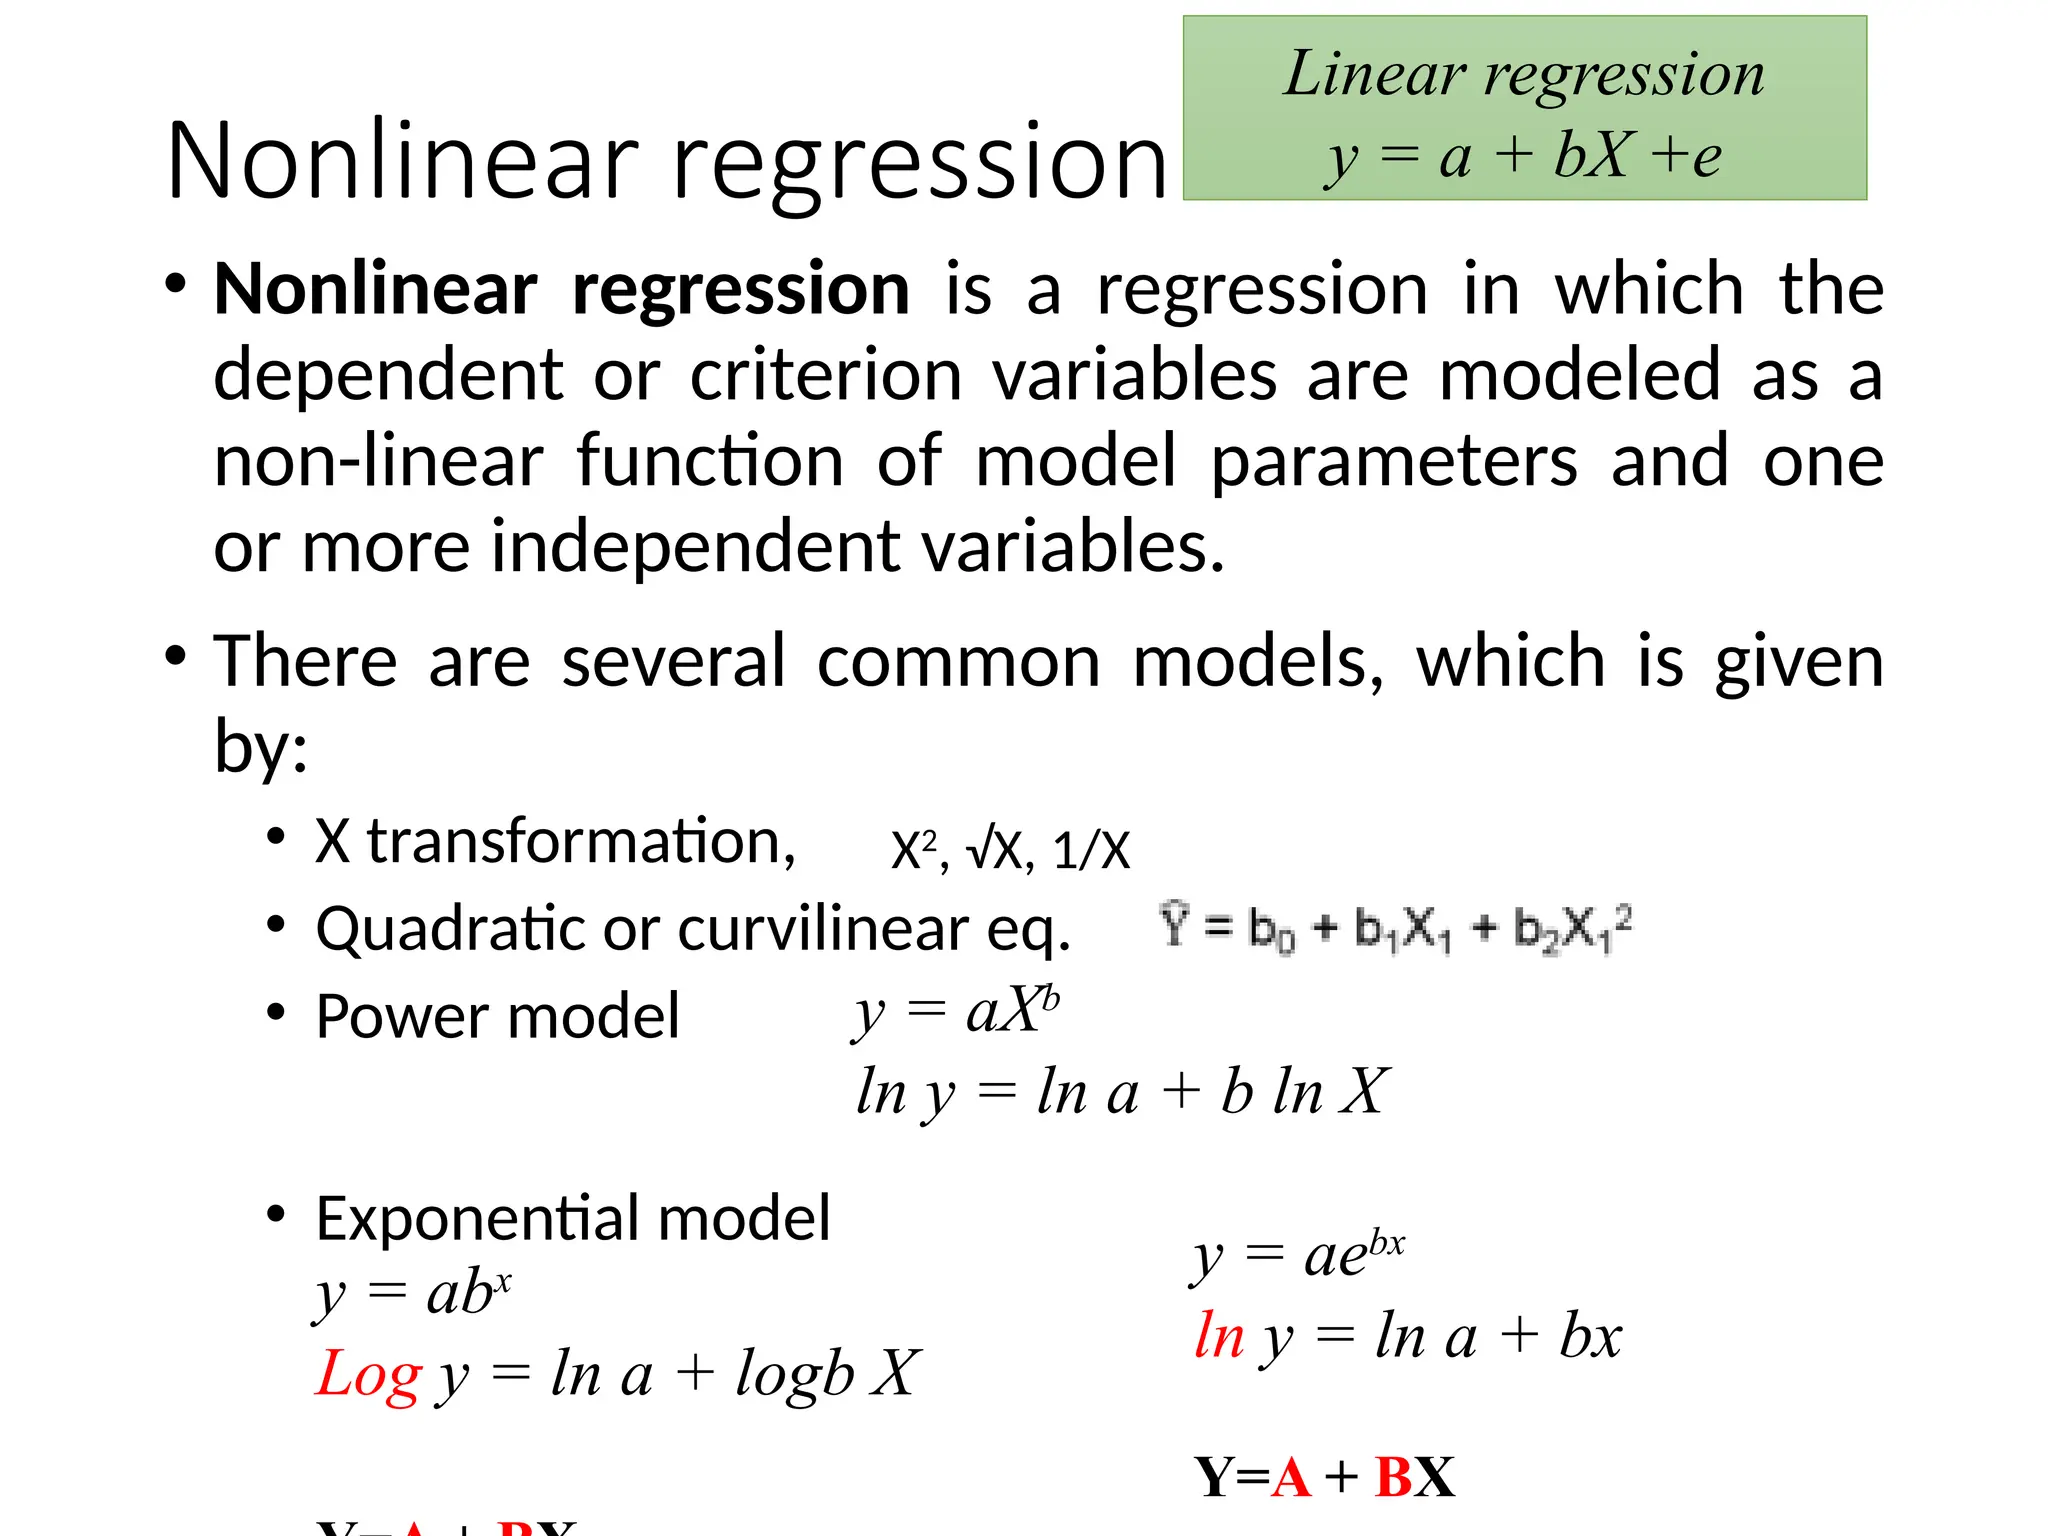
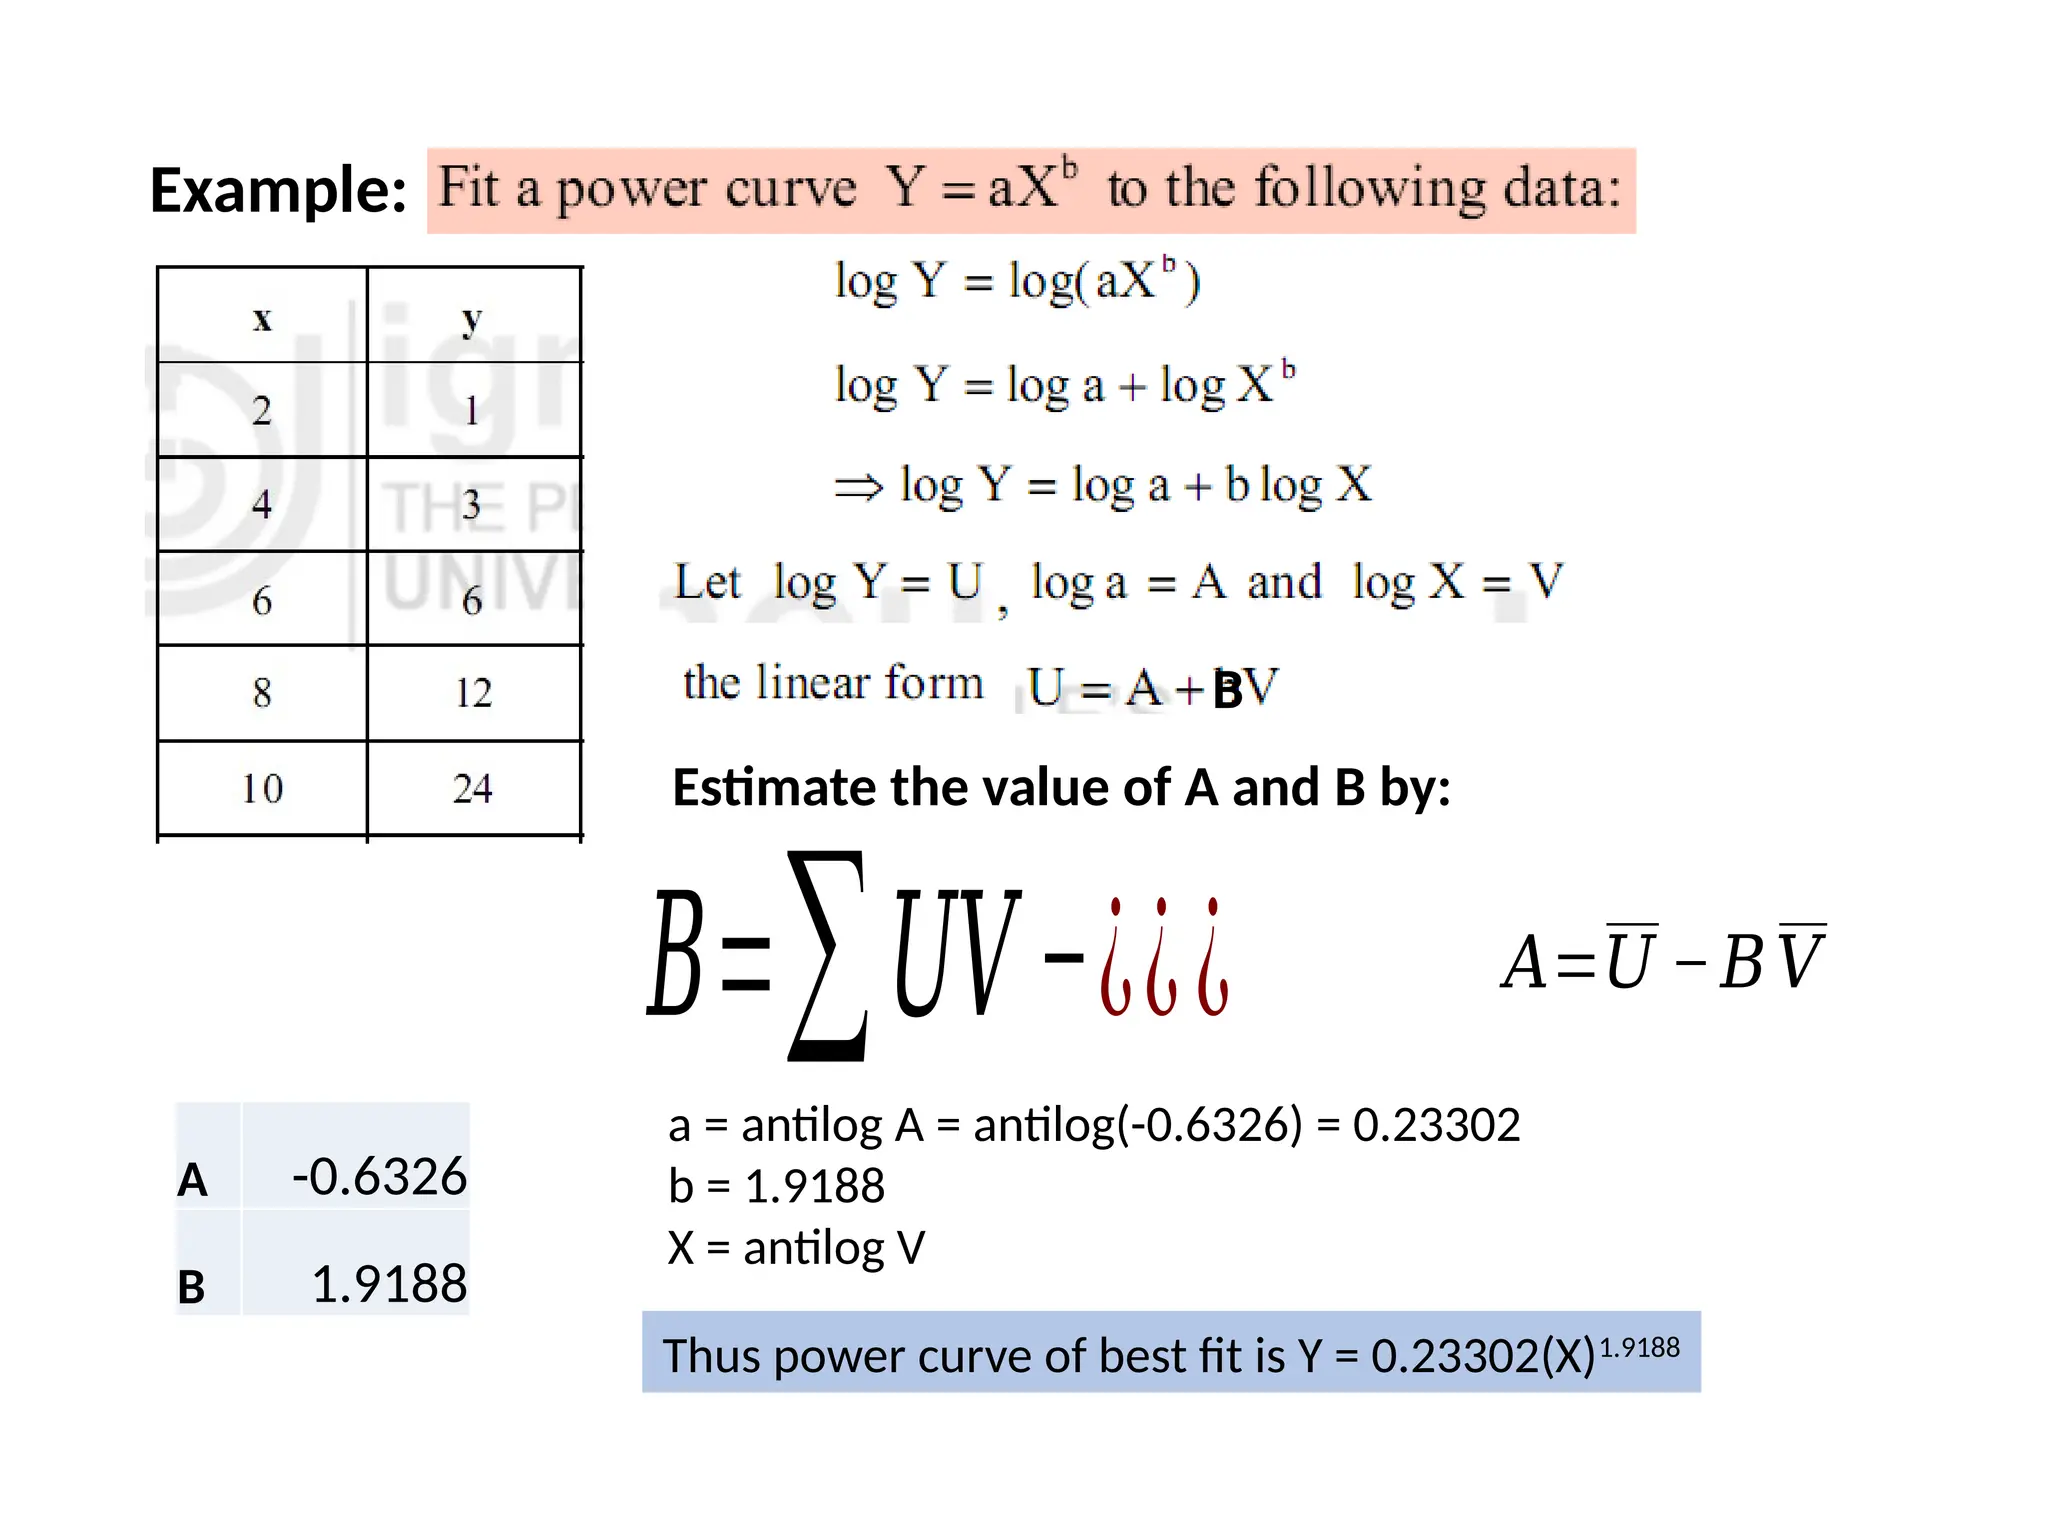
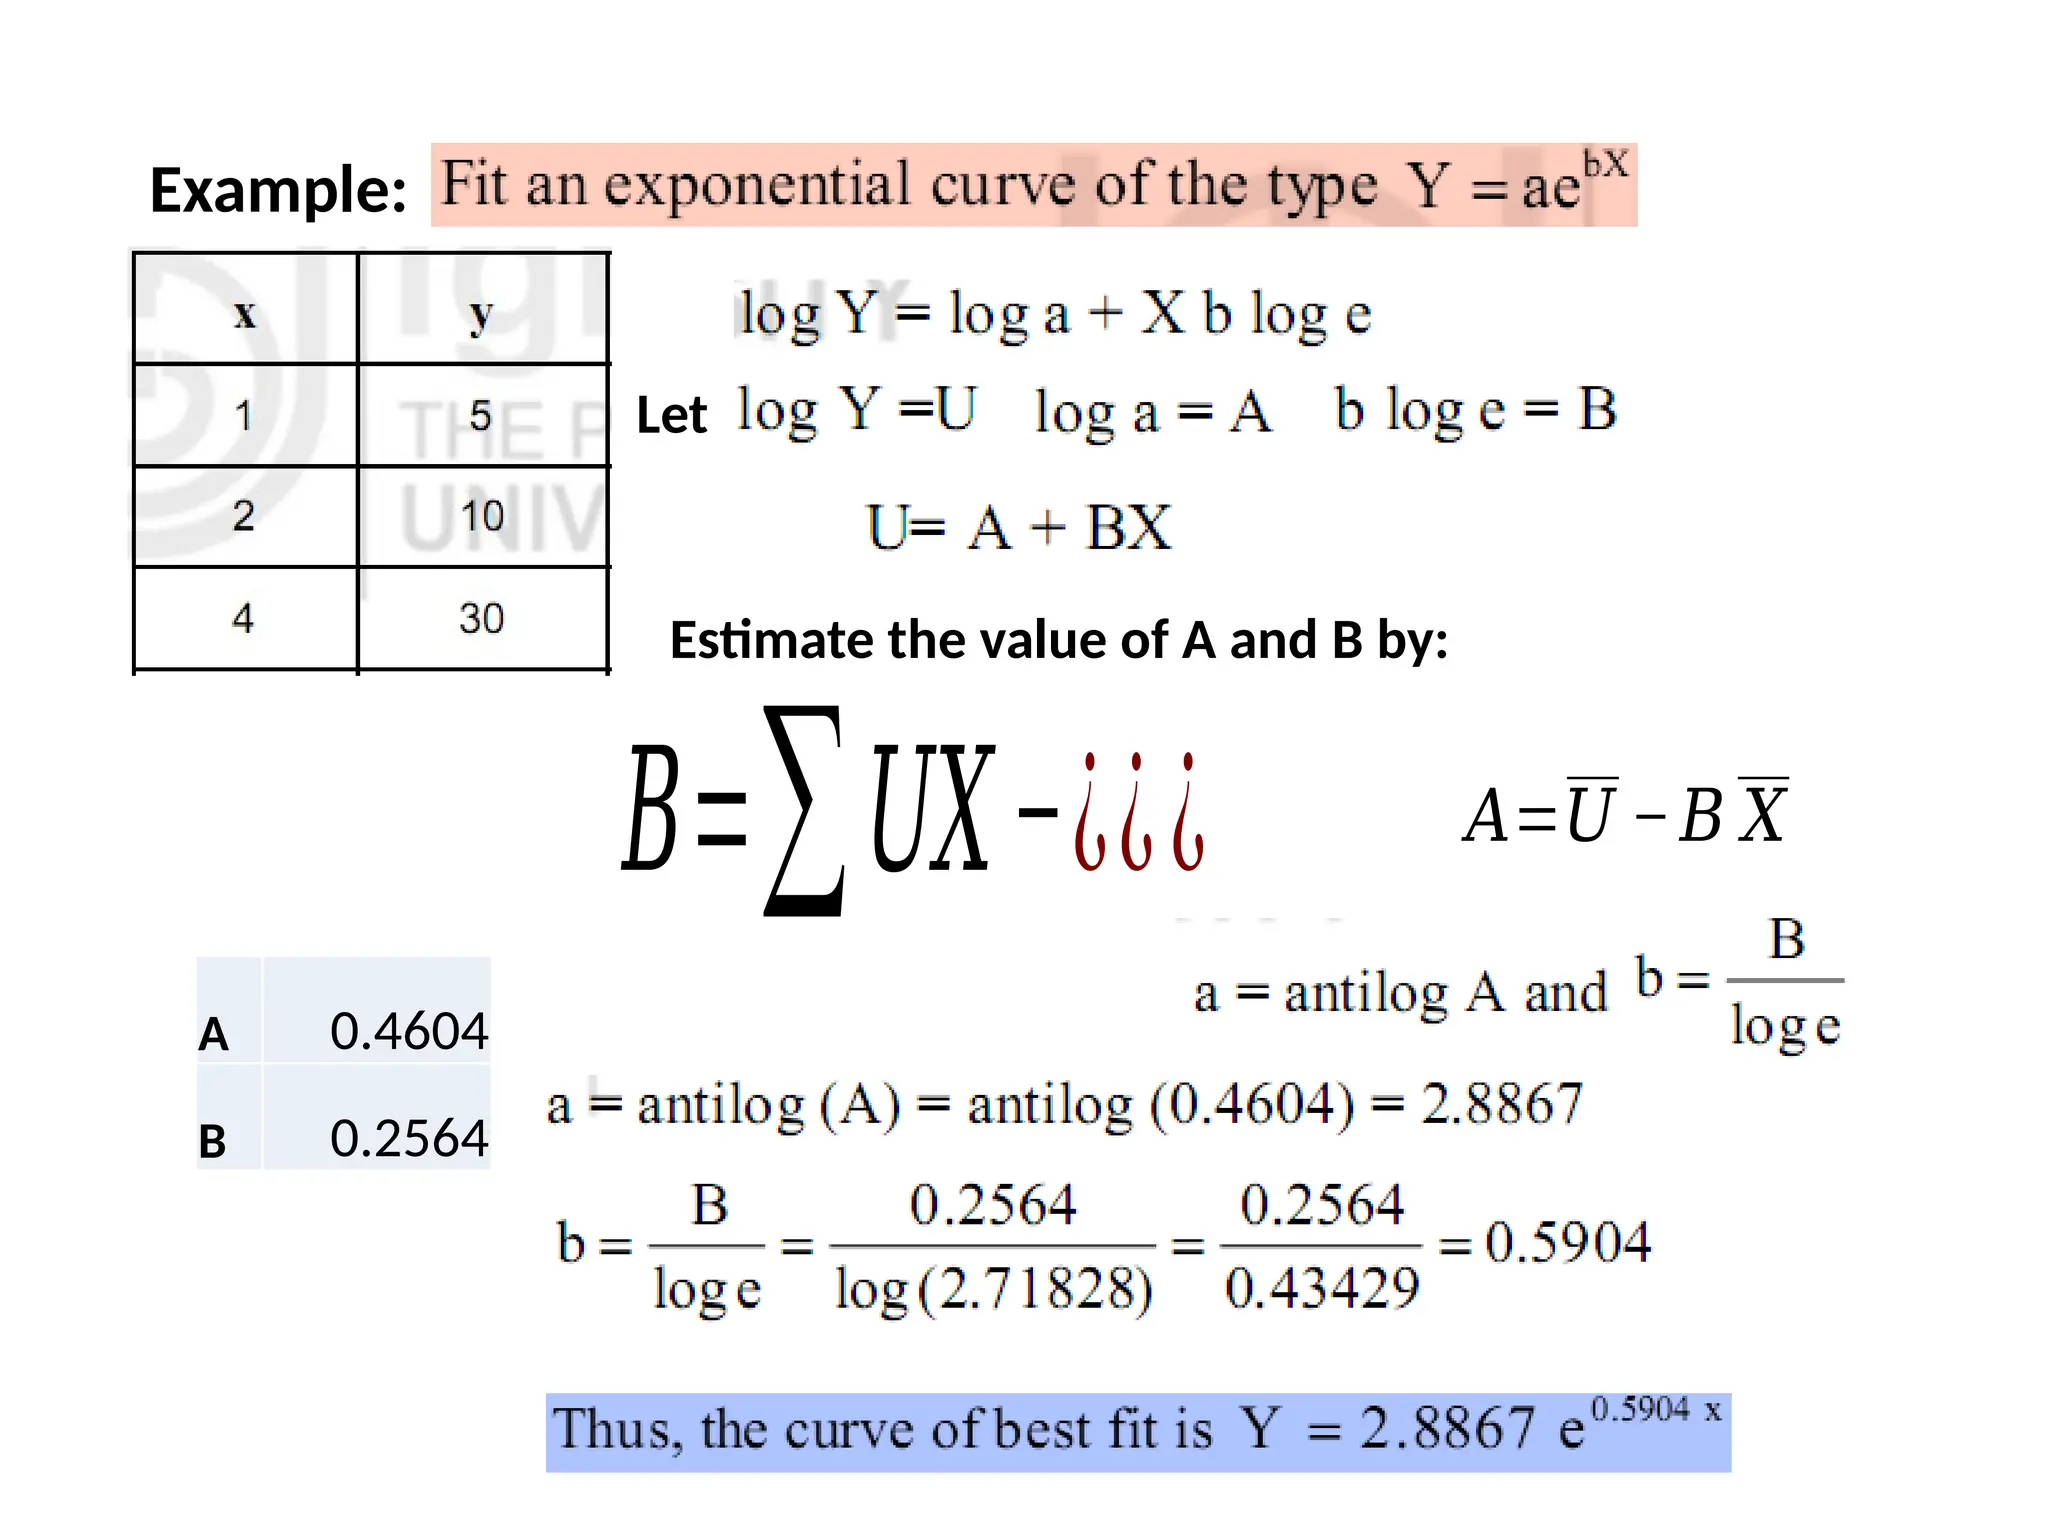
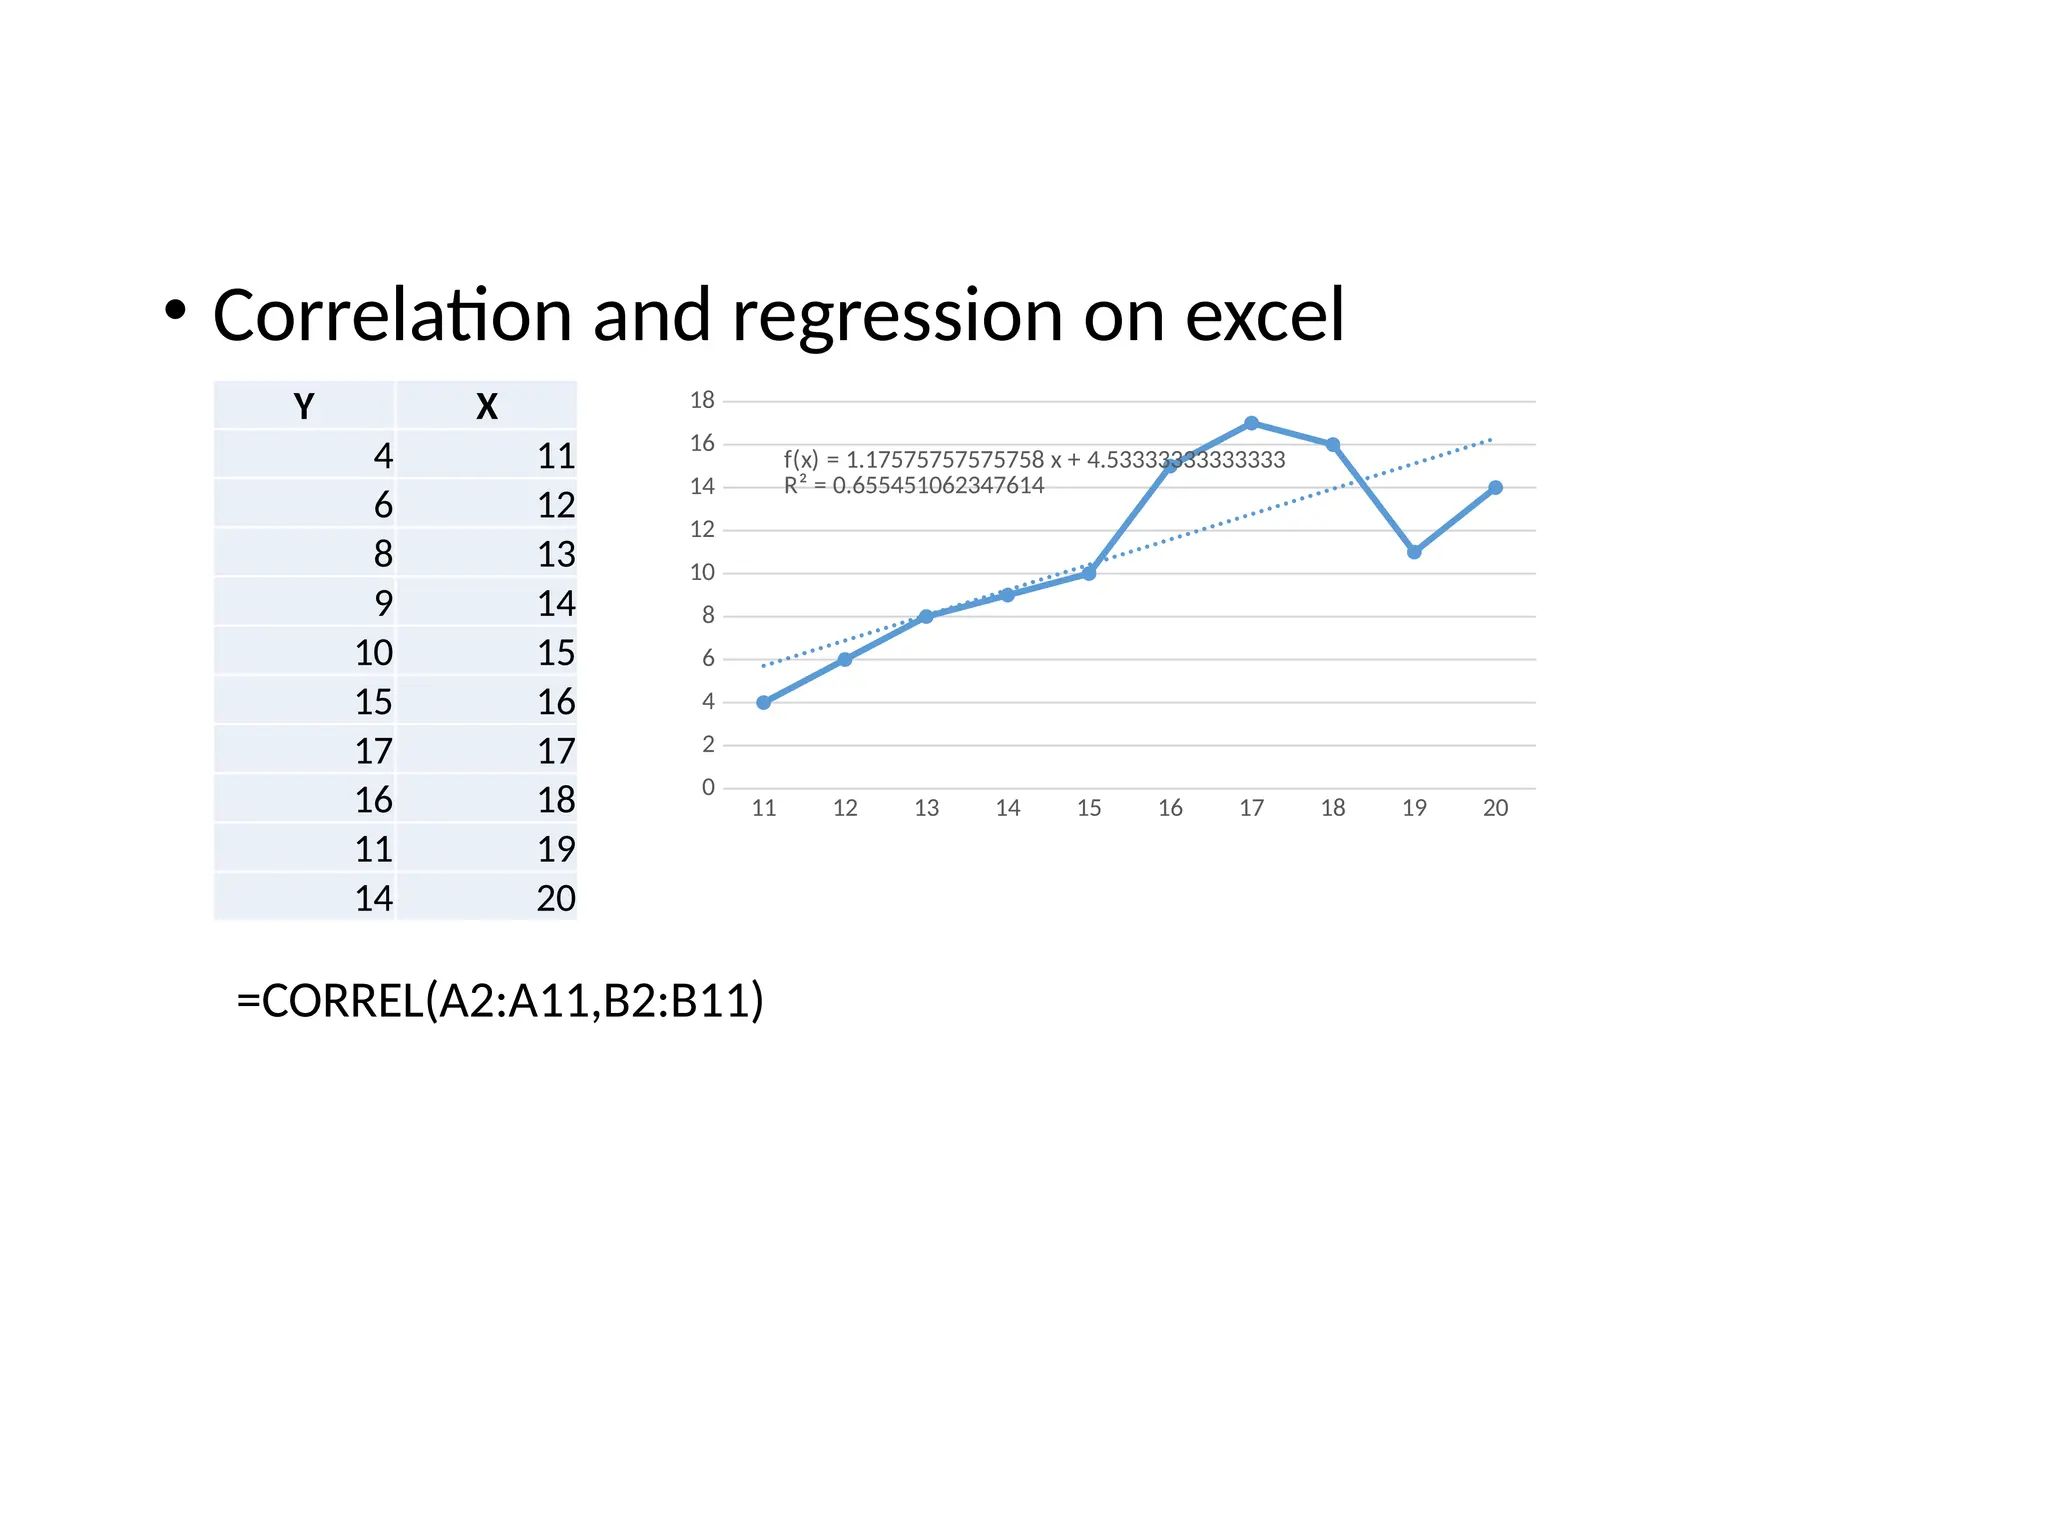
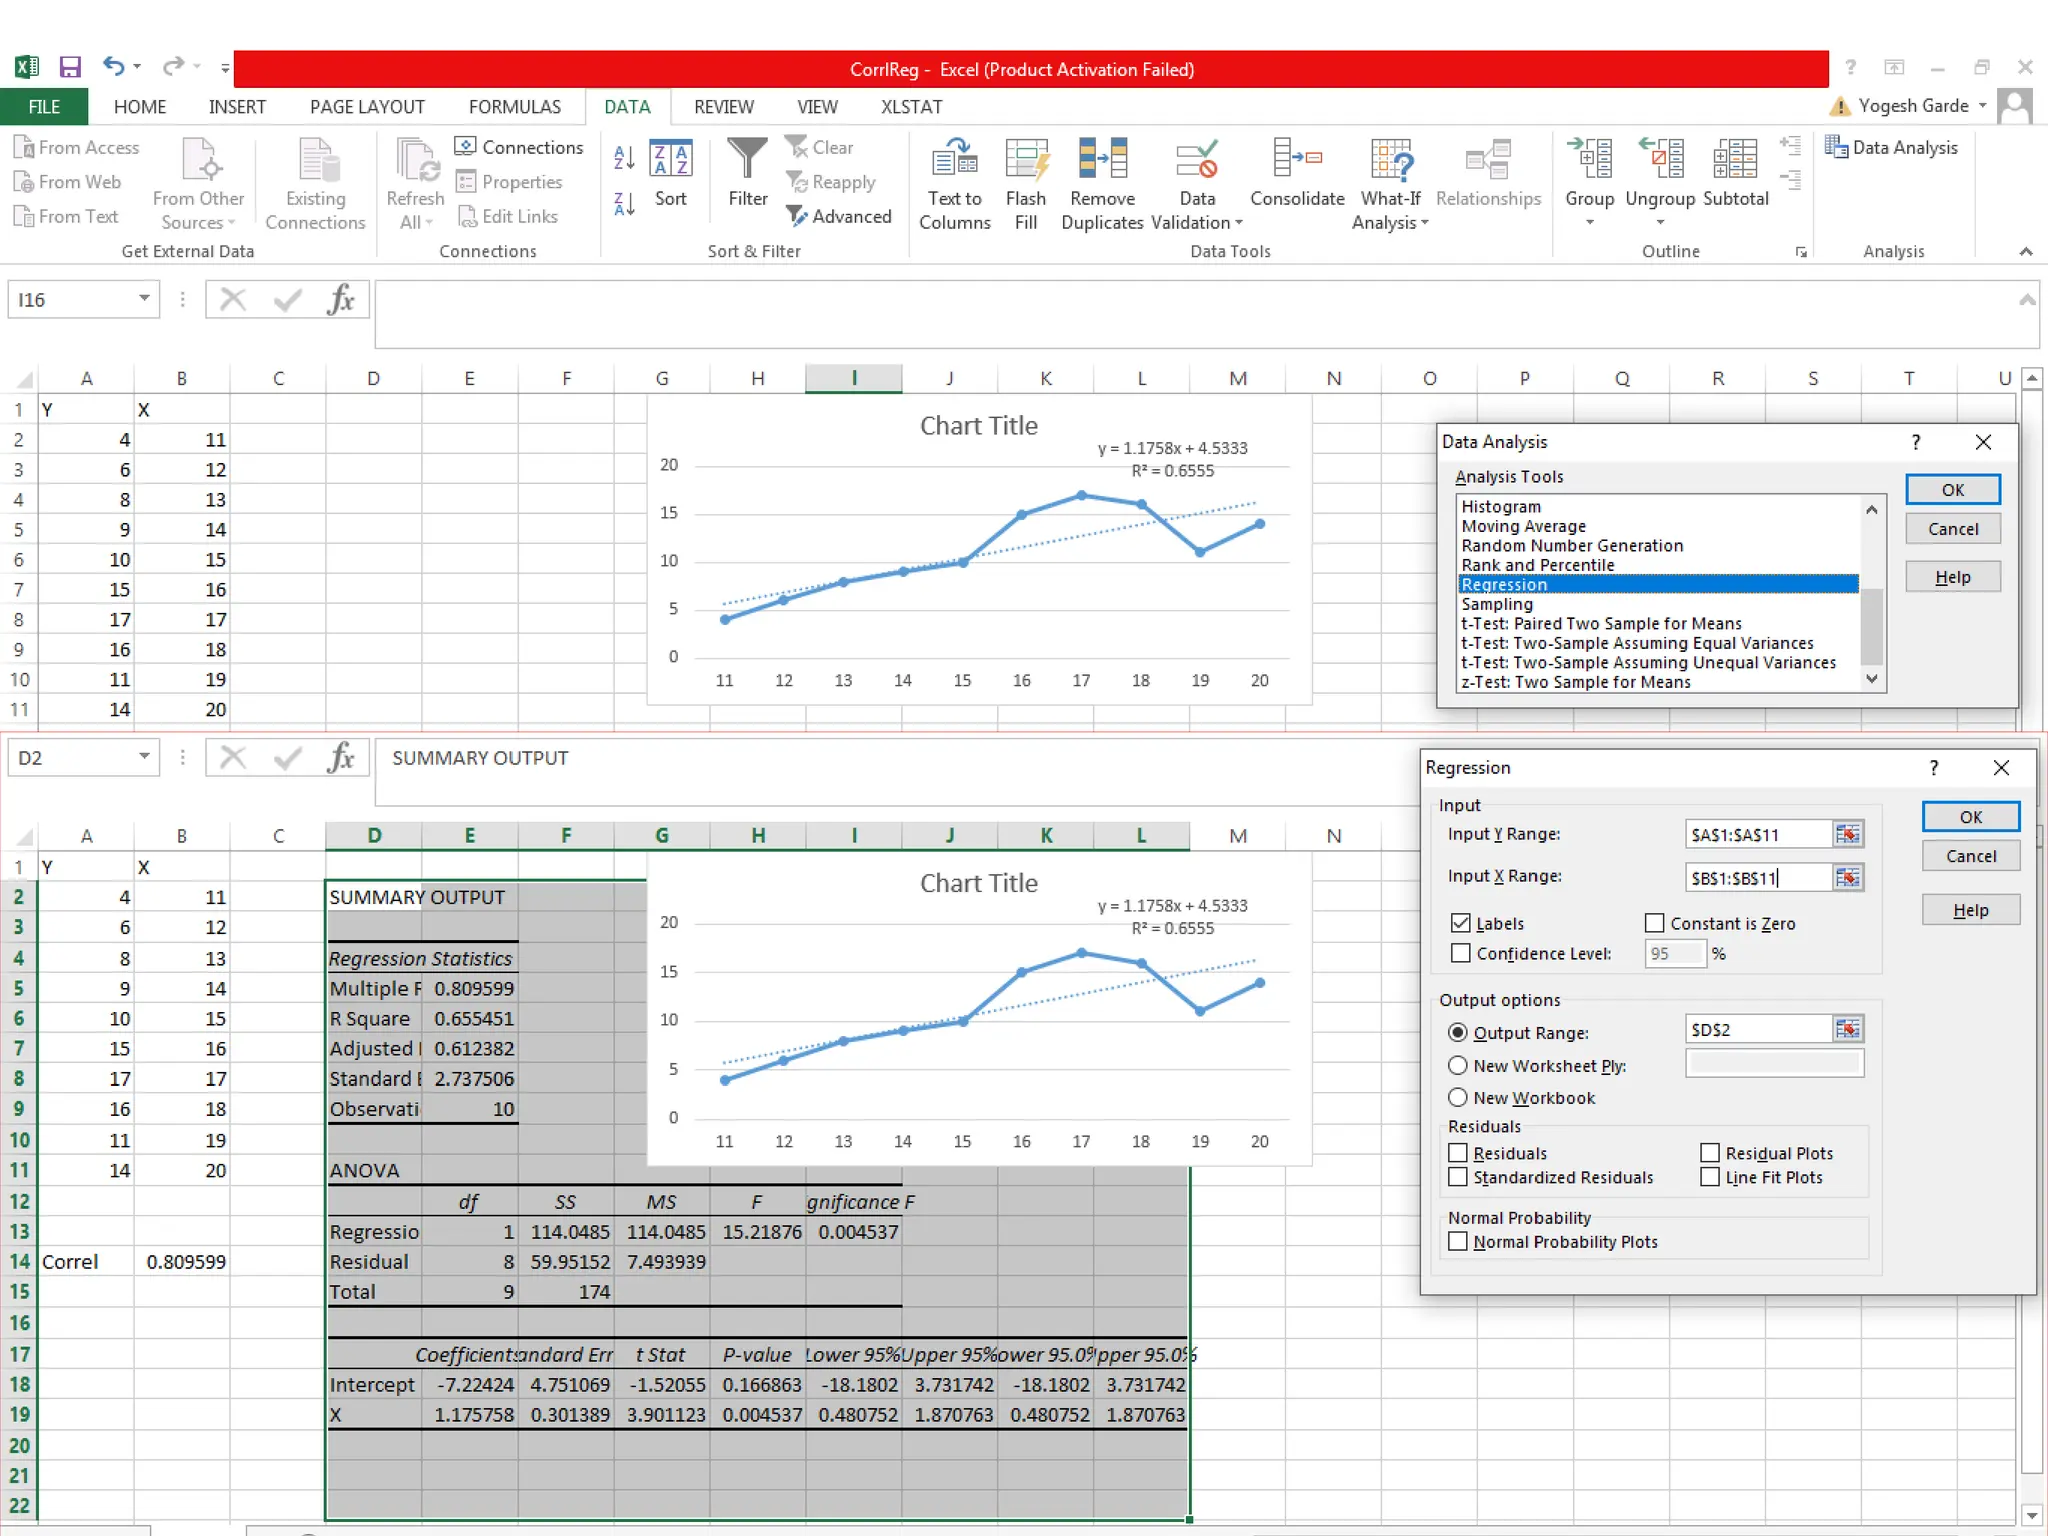
Nonlinear Regression
Dr. Yogesh A. Garde
Assistant Professor (Agril. Statistics)
Nonlinear regression
• Nonlinear regression is a regression in which the
dependent or criterion variables are modeled as a
non-linear function of model parameters and one
or more independent variables.
• There are several common models, which is given
by:
• X transformation,
• Quadratic or curvilinear eq.
• Power model
• Exponential model
y = aXb
ln y = ln a + b ln X
y = abx
Log y = ln a + logb X
Linear regression
y = a + bX +e
X2
, √X, 1/X
y = aebx
ln y = ln a + bx
Y=A + BX
The form of the nonlinear regression
•
Estimate the value of A and B by:
A -0.6326
B 1.9188
Example:
a = antilog A = antilog(-0.6326) = 0.23302
b = 1.9188
X = antilog V
B
𝐵=∑𝑈𝑉−¿¿¿ 𝐴=𝑈 −𝐵𝑉
Thus power curve of best fit is Y = 0.23302(X)1.9188
Example:
Let
Estimate the value of A and B by:
A 0.4604
B 0.2564
𝐵=∑𝑈𝑋−¿¿¿ 𝐴=𝑈 −𝐵 𝑋
• Correlation and regression on excel
Y X
4 11
6 12
8 13
9 14
10 15
15 16
17 17
16 18
11 19
14 20
11 12 13 14 15 16 17 18 19 20
0
2
4
6
8
10
12
14
16
18
f(x) = 1.17575757575758 x + 4.53333333333333
R² = 0.655451062347614
=CORREL(A2:A11,B2:B11)
Assignment
• Write steps to fitting of linear and nonlinear
regression line in excel
• Fit regression line using excel on any kind of data
• Calculate correlation coefficient on excel
Thank You

Basics of Non linear Regression analysis

  • 1.
    Nonlinear Regression Dr. YogeshA. Garde Assistant Professor (Agril. Statistics)
  • 2.
    Nonlinear regression • Nonlinearregression is a regression in which the dependent or criterion variables are modeled as a non-linear function of model parameters and one or more independent variables. • There are several common models, which is given by: • X transformation, • Quadratic or curvilinear eq. • Power model • Exponential model y = aXb ln y = ln a + b ln X y = abx Log y = ln a + logb X Linear regression y = a + bX +e X2 , √X, 1/X y = aebx ln y = ln a + bx Y=A + BX
  • 3.
    The form ofthe nonlinear regression •
  • 4.
    Estimate the valueof A and B by: A -0.6326 B 1.9188 Example: a = antilog A = antilog(-0.6326) = 0.23302 b = 1.9188 X = antilog V B 𝐵=∑𝑈𝑉−¿¿¿ 𝐴=𝑈 −𝐵𝑉 Thus power curve of best fit is Y = 0.23302(X)1.9188
  • 5.
    Example: Let Estimate the valueof A and B by: A 0.4604 B 0.2564 𝐵=∑𝑈𝑋−¿¿¿ 𝐴=𝑈 −𝐵 𝑋
  • 6.
    • Correlation andregression on excel Y X 4 11 6 12 8 13 9 14 10 15 15 16 17 17 16 18 11 19 14 20 11 12 13 14 15 16 17 18 19 20 0 2 4 6 8 10 12 14 16 18 f(x) = 1.17575757575758 x + 4.53333333333333 R² = 0.655451062347614 =CORREL(A2:A11,B2:B11)
  • 9.
    Assignment • Write stepsto fitting of linear and nonlinear regression line in excel • Fit regression line using excel on any kind of data • Calculate correlation coefficient on excel
  • 10.